Helen of Troy Limited (HELE) and Nu Skin Enterprises, Inc. (NUS) are two prominent players in the Household & Personal Products industry, each boasting distinct product portfolios and innovation strategies. Helen of Troy excels in diverse consumer goods spanning home, health, and beauty, while Nu Skin focuses on beauty and wellness with advanced skin care and nutritional supplements. This article will help you decide which company presents the most compelling investment opportunity for your portfolio.
Table of contents
Companies Overview
I will begin the comparison between Helen of Troy Limited and Nu Skin Enterprises, Inc. by providing an overview of these two companies and their main differences.
Helen of Troy Limited Overview
Helen of Troy Limited operates in the Household & Personal Products industry, offering a diverse range of consumer products across regions including the US, Canada, Europe, and Asia Pacific. The company focuses on three segments: Home & Outdoor, Health & Wellness, and Beauty, selling products like food preparation tools, health monitors, and hair care appliances. Founded in 1968 and headquartered in El Paso, Texas, Helen of Troy markets its products under multiple well-known brands.
Nu Skin Enterprises, Inc. Overview
Nu Skin Enterprises, Inc. develops and distributes beauty and wellness products worldwide, emphasizing skin care systems, nutritional supplements, and weight management products. The company sells through retail stores, distributors, and online platforms, primarily under the Nu Skin, Pharmanex, and ageLOC brands. Founded in 1984 and based in Provo, Utah, Nu Skin focuses on research and product development within the Household & Personal Products sector.
Key similarities and differences
Both Helen of Troy and Nu Skin operate in the Household & Personal Products industry, targeting health, wellness, and beauty markets. Helen of Troy emphasizes a broader product range across home, health, and beauty segments, while Nu Skin specializes more narrowly in skin care and nutritional supplements. Distribution channels differ, with Helen of Troy utilizing mass merchandisers and various retailers, whereas Nu Skin relies heavily on direct sales and distributors. Their geographic footprints overlap but differ in regional focus and sales strategies.
Income Statement Comparison
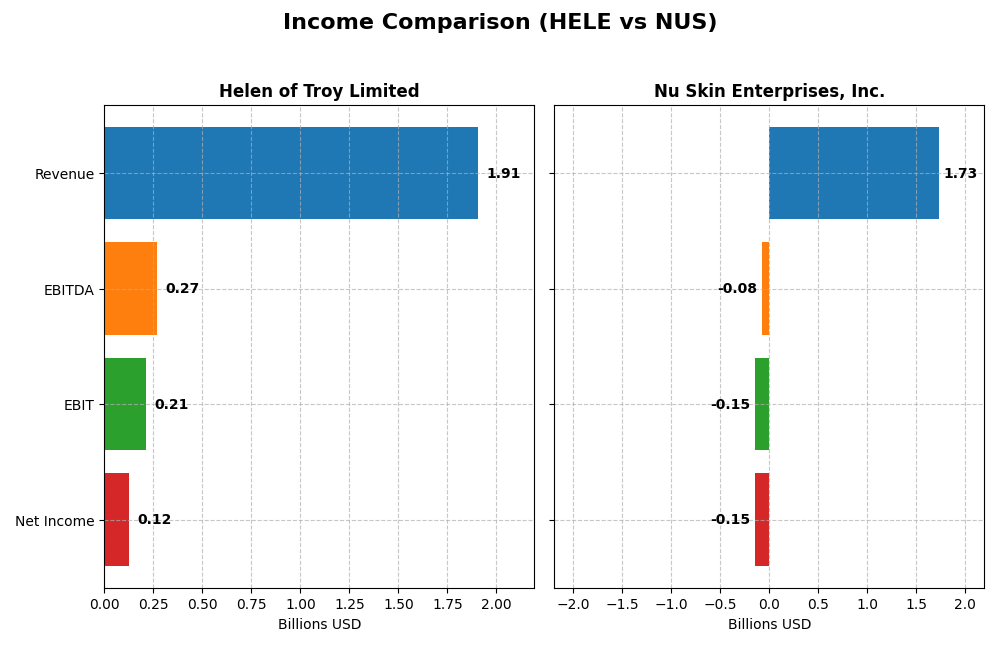
This table presents a side-by-side comparison of the key income statement metrics for Helen of Troy Limited and Nu Skin Enterprises, Inc. for their most recent fiscal years.
| Metric | Helen of Troy Limited (HELE) | Nu Skin Enterprises, Inc. (NUS) |
|---|---|---|
| Market Cap | 431M | 518M |
| Revenue | 1.91B | 1.73B |
| EBITDA | 269M | -79M |
| EBIT | 214M | -149M |
| Net Income | 124M | -147M |
| EPS | 5.38 | -2.95 |
| Fiscal Year | 2025 | 2024 |
Income Statement Interpretations
Helen of Troy Limited
Helen of Troy’s revenue and net income have declined over the 2021-2025 period, with a notable 4.86% revenue drop last year and a 51.27% net income decrease overall. Margins remain favorable, with a gross margin near 48% and a net margin of 6.5%. However, the latest year shows weakening growth and shrinking earnings per share, signaling margin and profitability pressures.
Nu Skin Enterprises, Inc.
Nu Skin’s revenue also decreased significantly, down 12% last year and nearly 33% over the longer term. Net income turned negative in 2024, reflecting a severe downturn with net margins below -8%. Despite a strong gross margin over 68%, EBIT and net margins are unfavorable, with a sharp decline in earnings per share signaling operational and profitability challenges in the latest fiscal year.
Which one has the stronger fundamentals?
Both companies present unfavorable income statement trends, with declining revenues and net incomes. Helen of Troy maintains healthier margins and positive net income, unlike Nu Skin’s negative profitability and steeper margin deterioration. While both face growth challenges, Helen of Troy’s relatively stronger margin profile and earnings stability suggest comparatively more resilient fundamentals.
Financial Ratios Comparison
Below is a comparison of the most recent financial ratios for Helen of Troy Limited (HELE) and Nu Skin Enterprises, Inc. (NUS) based on their fiscal year 2025 and 2024 data respectively.
| Ratios | Helen of Troy Limited (2025) | Nu Skin Enterprises, Inc. (2024) |
|---|---|---|
| ROE | 7.35% | -22.50% |
| ROIC | 5.32% | -10.40% |
| P/E | 10.25 | -2.33 |
| P/B | 0.75 | 0.53 |
| Current Ratio | 2.00 | 1.82 |
| Quick Ratio | 1.03 | 1.17 |
| D/E (Debt-to-Equity) | 0.57 | 0.73 |
| Debt-to-Assets | 30.7% | 32.6% |
| Interest Coverage | 2.75 | -5.74 |
| Asset Turnover | 0.61 | 1.18 |
| Fixed Asset Turnover | 5.23 | 3.71 |
| Payout Ratio | 0% | -8.14% |
| Dividend Yield | 0% | 3.49% |
Interpretation of the Ratios
Helen of Troy Limited
Helen of Troy shows a mixed ratios profile with 43% favorable, 14% unfavorable, and 43% neutral ratings. Key strengths include a low price-to-book at 0.75 and a strong current ratio near 2.0, indicating solid liquidity. However, return on equity at 7.35% is marked unfavorable, and dividend yield is zero, reflecting no dividend payments or shareholder returns through dividends.
Nu Skin Enterprises, Inc.
Nu Skin’s ratios are overall favorable at 57%, though with 29% unfavorable and 14% neutral. It benefits from a positive dividend yield of 3.49%, supported by share buybacks and a moderate payout ratio. Yet, profitability ratios are weak, with negative net margin and return on equity, indicating operational challenges despite solid liquidity and asset turnover.
Which one has the best ratios?
Nu Skin presents stronger favorable ratios, particularly in asset utilization and dividend yield, but suffers from significant profitability weaknesses. Helen of Troy has more balanced liquidity and valuation metrics but lower returns and no dividend payouts. Based on ratio evaluations alone, Nu Skin’s profile appears more favorable, albeit with considerable risks in profitability.
Strategic Positioning
This section compares the strategic positioning of Helen of Troy Limited (HELE) and Nu Skin Enterprises, Inc. (NUS) across Market position, Key segments, and Exposure to technological disruption:
Helen of Troy Limited
- Operates globally in household and personal products, facing moderate competitive pressure.
- Diversified segments: Home & Outdoor, Health & Wellness, Beauty, driven by varied consumer products.
- Limited explicit exposure to technological disruption mentioned; focus on consumer goods innovation.
Nu Skin Enterprises, Inc.
- Operates worldwide in beauty and wellness with direct sales and distributor model.
- Concentrated on skin care, nutritional supplements, and weight management products.
- Engages in research and product development, integrating technology in skin treatment devices.
Helen of Troy Limited vs Nu Skin Enterprises, Inc. Positioning
HELE’s strategy is diversified across multiple consumer product categories, offering broad market coverage but possibly facing varied segment risks. NUS is more concentrated in beauty and wellness, potentially benefiting from focused innovation but exposed to niche market shifts.
Which has the best competitive advantage?
Both companies show very unfavorable MOAT evaluations with declining ROIC trends and value destruction, indicating neither currently sustains a strong competitive advantage based on capital efficiency and profitability data.
Stock Comparison
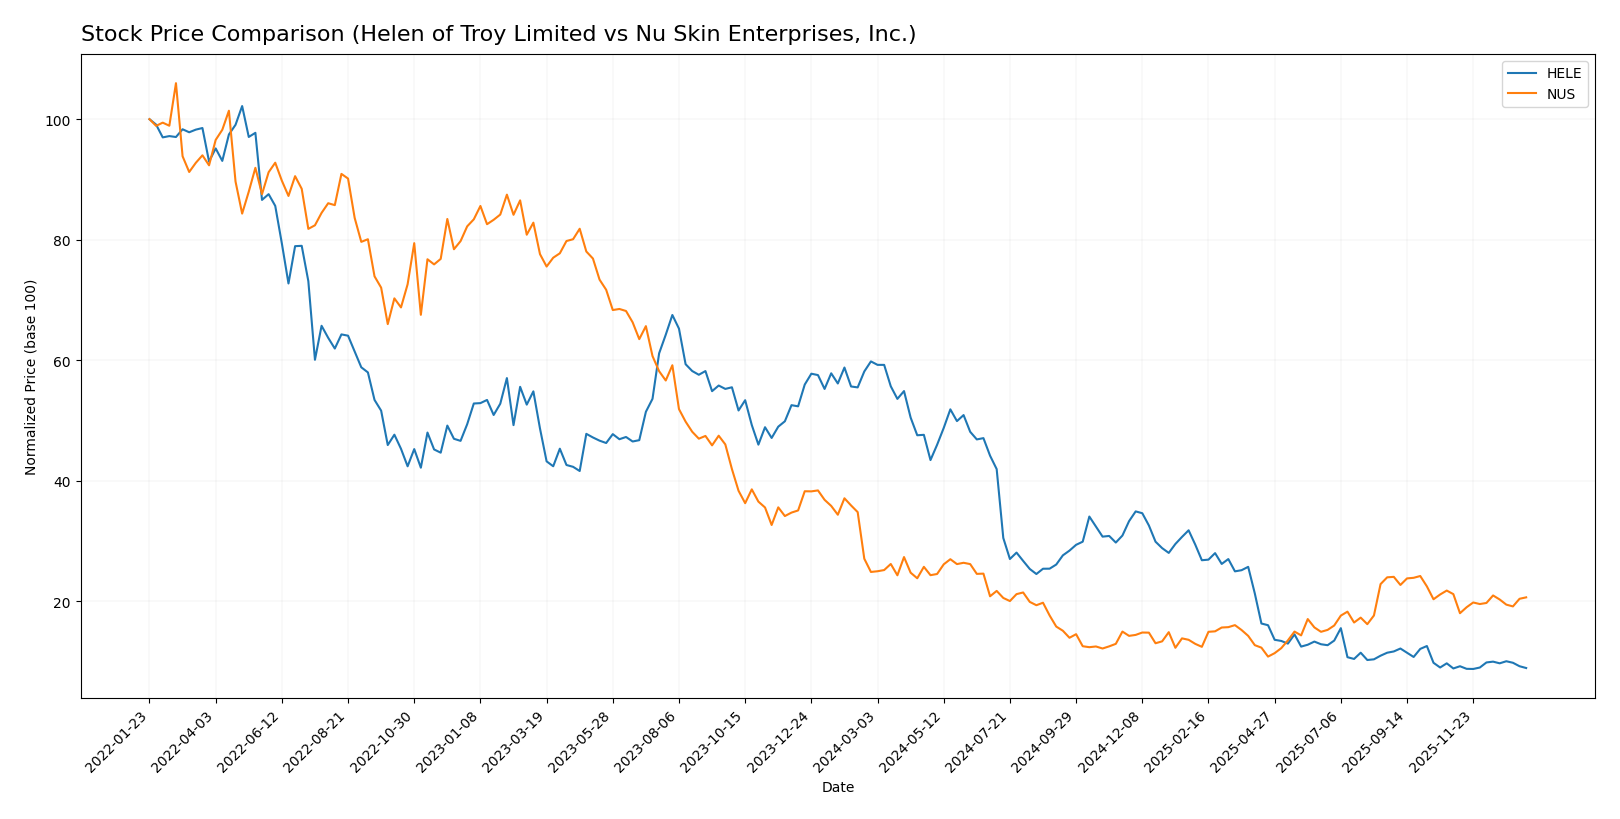
The stock prices of Helen of Troy Limited and Nu Skin Enterprises, Inc. have shown significant bearish trends over the past 12 months, with distinct variations in volatility and recent trading dynamics.
Trend Analysis
Helen of Troy Limited’s stock experienced a sharp bearish trend with an 85.04% decline over the past year, marked by acceleration and high volatility (31.1 std deviation). The stock reached a peak of 125.57 and a low of 18.45.
Nu Skin Enterprises, Inc. also shows a bearish trend with a 16.93% price decrease over the same period, accelerating downward but with lower volatility (2.34 std deviation). Its price fluctuated between 13.83 and 5.48.
Comparing both, Helen of Troy Limited recorded the steepest decline and largest volatility, while Nu Skin Enterprises, Inc. had a milder bearish trend, delivering relatively higher market performance.
Target Prices
The current analyst target consensus provides clear price expectations for Helen of Troy Limited and Nu Skin Enterprises, Inc.
| Company | Target High | Target Low | Consensus |
|---|---|---|---|
| Helen of Troy Limited | 22 | 22 | 22 |
| Nu Skin Enterprises, Inc. | 11 | 11 | 11 |
Analysts expect Helen of Troy Limited’s stock to rise from $18.78 to $22, indicating moderate growth potential. Nu Skin Enterprises, Inc. shows a target of $11, slightly above its current price of $10.45, suggesting limited upside.
Analyst Opinions Comparison
This section compares analysts’ ratings and grades for Helen of Troy Limited and Nu Skin Enterprises, Inc.:
Rating Comparison
HELE Rating
- Rating: B, classified as Very Favorable by analysts.
- Discounted Cash Flow Score: 5, reflecting a Very Favorable valuation based on future cash flows.
- ROE Score: 1, indicating Very Unfavorable efficiency in generating profit from equity.
- ROA Score: 1, Very Unfavorable effectiveness in asset utilization for earnings.
- Debt To Equity Score: 4, Favorable, indicating moderate financial risk with relatively low debt.
- Overall Score: 3, Moderate overall financial standing.
NUS Rating
- Rating: A, classified as Very Favorable by analysts.
- Discounted Cash Flow Score: 4, considered Favorable for discounted cash flow valuation.
- ROE Score: 4, Favorable efficiency in generating profit from shareholders’ equity.
- ROA Score: 4, Favorable asset utilization generating earnings effectively.
- Debt To Equity Score: 3, Moderate financial risk with a balanced debt-to-equity position.
- Overall Score: 4, Favorable overall financial standing.
Which one is the best rated?
Based strictly on the provided data, Nu Skin Enterprises, Inc. holds a higher rating (A) and better overall scores, especially in profitability and asset efficiency, compared to Helen of Troy Limited’s moderate ratings and low profitability scores.
Scores Comparison
The scores comparison between Helen of Troy Limited and Nu Skin Enterprises, Inc. is as follows:
HELE Scores
- Altman Z-Score: 1.10, in the distress zone, indicating high bankruptcy risk.
- Piotroski Score: 3, classified as very weak financial strength.
NUS Scores
- Altman Z-Score: 3.94, in the safe zone, indicating low bankruptcy risk.
- Piotroski Score: 8, classified as very strong financial strength.
Which company has the best scores?
Nu Skin Enterprises, Inc. shows significantly stronger financial health with a safe-zone Altman Z-Score and a very strong Piotroski Score. Helen of Troy Limited’s scores indicate financial distress and weak strength.
Grades Comparison
The following presents a detailed comparison of recent grades for Helen of Troy Limited and Nu Skin Enterprises, Inc.:
Helen of Troy Limited Grades
This table shows recent ratings and grade changes by reputable grading companies for Helen of Troy Limited.
| Grading Company | Action | New Grade | Date |
|---|---|---|---|
| UBS | Maintain | Neutral | 2026-01-09 |
| Canaccord Genuity | Maintain | Hold | 2026-01-09 |
| Canaccord Genuity | Maintain | Hold | 2026-01-06 |
| UBS | Maintain | Neutral | 2025-10-10 |
| Canaccord Genuity | Maintain | Hold | 2025-10-10 |
| UBS | Maintain | Neutral | 2025-10-02 |
| Canaccord Genuity | Downgrade | Hold | 2025-07-11 |
| UBS | Maintain | Neutral | 2025-07-11 |
| Canaccord Genuity | Maintain | Buy | 2025-07-07 |
| Canaccord Genuity | Maintain | Buy | 2025-04-25 |
The grades for Helen of Troy Limited have mostly stabilized at Hold and Neutral, with a recent downgrade from Buy to Hold by Canaccord Genuity, indicating cautious sentiment.
Nu Skin Enterprises, Inc. Grades
Below is an overview of recent ratings issued by established firms for Nu Skin Enterprises, Inc.
| Grading Company | Action | New Grade | Date |
|---|---|---|---|
| DA Davidson | Maintain | Neutral | 2024-12-20 |
| Citigroup | Maintain | Neutral | 2024-10-22 |
| DA Davidson | Maintain | Neutral | 2024-08-12 |
| Citigroup | Maintain | Neutral | 2024-08-09 |
| DA Davidson | Maintain | Neutral | 2024-05-09 |
| DA Davidson | Maintain | Neutral | 2024-01-05 |
| Stifel | Maintain | Hold | 2023-10-16 |
| Stifel | Maintain | Hold | 2023-10-15 |
| Citigroup | Maintain | Neutral | 2023-09-29 |
| Citigroup | Maintain | Neutral | 2023-09-28 |
Nu Skin Enterprises, Inc. displays a consistent pattern of Neutral and Hold ratings with no upgrades or downgrades, suggesting steady but cautious views.
Which company has the best grades?
Helen of Troy Limited has received more Buy ratings earlier but recently shifted toward Hold and Neutral, while Nu Skin Enterprises, Inc. maintains predominantly Neutral and Hold grades without any Buy ratings. This implies Helen of Troy has experienced a more dynamic rating environment, potentially reflecting evolving analyst confidence, whereas Nu Skin presents a stable but less optimistic outlook for investors.
Strengths and Weaknesses
Below is a comparative overview of the key strengths and weaknesses of Helen of Troy Limited (HELE) and Nu Skin Enterprises, Inc. (NUS) based on their most recent financial and operational data.
| Criterion | Helen of Troy Limited (HELE) | Nu Skin Enterprises, Inc. (NUS) |
|---|---|---|
| Diversification | Balanced revenue from Beauty & Wellness (1.0B) and Home & Outdoor (906M) segments indicates moderate diversification. | Revenue heavily concentrated in Nu Skin segment (1.45B) with smaller manufacturing and other segments, showing lower diversification. |
| Profitability | Neutral net margin (6.49%), ROIC slightly above WACC but declining; value destruction trend observed. | Negative net margin (-8.46%), negative ROIC (-10.4%), and declining profitability; value destruction evident. |
| Innovation | Moderate innovation implied by steady fixed asset turnover (5.23) and consistent product segments in beauty and home care. | Innovation challenged by declining ROIC and negative interest coverage (-5.63), despite some investment in manufacturing and Rhyz segments. |
| Global presence | Strong presence in health, beauty, and home products with diversified geographic sales. | Global reach supported by Nu Skin brand but facing profitability and operational challenges internationally. |
| Market Share | Solid market share in Beauty & Wellness and Home & Outdoor categories with steady revenue above 1.9B total. | Market share concentrated in core Nu Skin products with total revenue around 1.7B but shrinking and less profitable. |
Key takeaways: Helen of Troy shows moderate diversification and a slightly favorable financial stance, though profitability is declining. Nu Skin faces significant profitability and operational challenges despite its global presence, indicating higher investment risk at this time.
Risk Analysis
Below is a table summarizing key risks for Helen of Troy Limited (HELE) and Nu Skin Enterprises, Inc. (NUS) based on the most recent data available.
| Metric | Helen of Troy Limited (HELE) | Nu Skin Enterprises, Inc. (NUS) |
|---|---|---|
| Market Risk | Moderate (Beta 0.78, stable) | Moderate (Beta 0.98, volatile) |
| Debt level | Moderate (Debt/Equity 0.57) | Moderate (Debt/Equity 0.73) |
| Regulatory Risk | Low to Moderate | Moderate (Operations in China) |
| Operational Risk | Moderate | Moderate |
| Environmental Risk | Low | Low |
| Geopolitical Risk | Moderate (Global operations) | Moderate (Exposure to China) |
In synthesis, Nu Skin faces higher operational and regulatory risks due to its exposure to the Chinese market and negative profitability metrics. Helen of Troy’s risks are more moderate but include moderate leverage and operational complexities from diverse product segments. Nu Skin’s strong Altman Z-Score and Piotroski Score suggest better financial health despite its challenges, while Helen of Troy shows signs of financial distress, increasing risk for investors.
Which Stock to Choose?
Helen of Troy Limited (HELE) shows a declining income trend with unfavorable revenue and net margin growth over 2021-2025. Its financial ratios are slightly favorable overall, but profitability is moderate with a 7.35% ROE and manageable debt. The company’s rating is very favorable, yet its economic moat is very unfavorable due to value destruction and declining ROIC.
Nu Skin Enterprises, Inc. (NUS) also faces unfavorable income evolution with significant declines in revenue and profitability over 2020-2024. However, its financial ratios appear favorable overall despite negative margins and returns, supported by low valuation multiples. NUS holds a very favorable rating and a very unfavorable economic moat, reflecting value erosion and decreasing profitability.
For investors prioritizing financial stability and valuation metrics, NUS might appear more favorable given its overall favorable ratios and strong rating, despite income challenges. Conversely, those focused on companies with a better income statement track record and moderate profitability may view HELE as more aligned, although its declining moat signals caution. The choice could depend on the investor’s tolerance for risk and preference for either valuation strength or income consistency.
Disclaimer: Investment carries a risk of loss of initial capital. The past performance is not a reliable indicator of future results. Be sure to understand risks before making an investment decision.
Go Further
I encourage you to read the complete analyses of Helen of Troy Limited and Nu Skin Enterprises, Inc. to enhance your investment decisions: