In the competitive realm of household and personal products, Newell Brands Inc. (NWL) and Helen of Troy Limited (HELE) stand out as influential players. Both companies innovate across diverse consumer segments, offering a wide range of trusted brands that overlap in markets such as home organization, health, and beauty. This article will analyze their strategies and financial profiles to help you decide which company presents the most compelling opportunity for your investment portfolio.
Table of contents
Companies Overview
I will begin the comparison between Newell Brands Inc. and Helen of Troy Limited by providing an overview of these two companies and their main differences.
Newell Brands Inc. Overview
Newell Brands Inc. is a diversified consumer products company headquartered in Atlanta, Georgia. It designs, manufactures, sources, and distributes products across five segments, including Commercial Solutions, Home Appliances, and Outdoor and Recreation. Operating globally, Newell serves various retail channels with brands like Rubbermaid, Calphalon, and Yankee Candle, aiming to provide household and personal products.
Helen of Troy Limited Overview
Helen of Troy Limited, based in El Paso, Texas, offers consumer products in multiple regions including the US, Europe, and Asia Pacific. It operates through three segments: Home & Outdoor, Health & Wellness, and Beauty. The company markets brands such as OXO, Hydro Flask, and Braun, focusing on household gadgets, health devices, and beauty products, distributing through mass merchandisers, specialty stores, and e-commerce.
Key similarities and differences
Both companies operate in the Household & Personal Products industry and serve a global market with diversified product portfolios. Newell Brands has a broader segment structure with an emphasis on commercial and home solutions, while Helen of Troy focuses on health, wellness, and beauty alongside home products. Newell employs a significantly larger workforce and offers a wider brand range, whereas Helen of Troy concentrates on specific lifestyle and wellness categories.
Income Statement Comparison
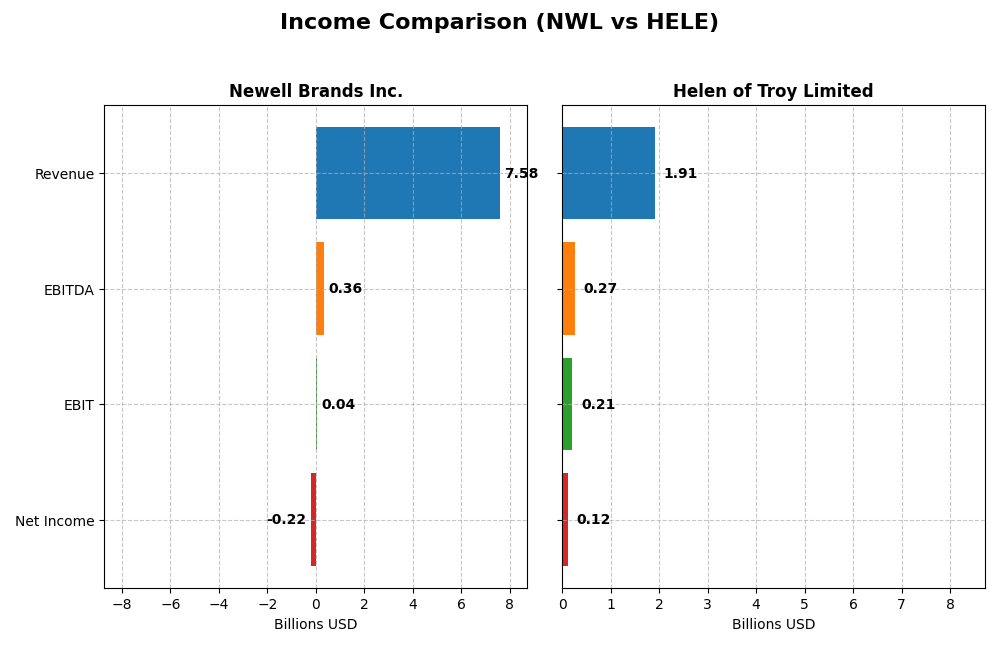
This table presents a side-by-side comparison of key income statement metrics for Newell Brands Inc. and Helen of Troy Limited, based on their most recent fiscal year data.
| Metric | Newell Brands Inc. (NWL) | Helen of Troy Limited (HELE) |
|---|---|---|
| Market Cap | 1.74B | 431M |
| Revenue | 7.58B | 1.91B |
| EBITDA | 358M | 269M |
| EBIT | 35M | 214M |
| Net Income | -216M | 124M |
| EPS | -0.52 | 5.38 |
| Fiscal Year | 2024 | 2025 |
Income Statement Interpretations
Newell Brands Inc.
Newell Brands’ revenue declined from $10.6B in 2021 to $7.6B in 2024, showing a negative growth trend over five years. Despite this, net income improved from a loss of $770M in 2020 to a loss of $216M in 2024, with net margin turning less negative. The gross margin remains stable around 33.6%, while EBIT margin is neutral, and the most recent year saw EBIT turnaround positive, indicating early signs of operational improvement.
Helen of Troy Limited
Helen of Troy’s revenue decreased from $2.1B in 2021 to approximately $1.9B in 2025, reflecting a declining trend. Net income dropped significantly by over 50% in the overall period, with net margin falling to 6.49% in 2025. Despite a favorable gross and EBIT margin, recent year results show weakening profitability and margins, accompanied by negative EPS growth and reduced EBIT, indicating operational and earnings pressure.
Which one has the stronger fundamentals?
Newell Brands presents a mixed picture with unfavorable revenue trends but improving net income, margins, and EBIT growth, supported by a favorable global income statement evaluation. Conversely, Helen of Troy struggles with declining revenue, net income, and margins, and a predominantly unfavorable income statement assessment. Based on the income statement metrics alone, Newell Brands shows relatively stronger fundamentals.
Financial Ratios Comparison
The table below compares key financial ratios for Newell Brands Inc. (NWL) and Helen of Troy Limited (HELE) based on the most recent fiscal year data available.
| Ratios | Newell Brands Inc. (2024) | Helen of Troy Limited (2025) |
|---|---|---|
| ROE | -7.85% | 7.35% |
| ROIC | 0.64% | 5.32% |
| P/E | -19.16 | 10.25 |
| P/B | 1.50 | 0.75 |
| Current Ratio | 1.14 | 2.00 |
| Quick Ratio | 0.56 | 1.03 |
| D/E (Debt-to-Equity) | 1.86 | 0.57 |
| Debt-to-Assets | 46.56% | 30.74% |
| Interest Coverage | 0.23 | 2.75 |
| Asset Turnover | 0.69 | 0.61 |
| Fixed Asset Turnover | 4.67 | 5.23 |
| Payout ratio | -54.63% | 0% |
| Dividend yield | 2.85% | 0% |
Interpretation of the Ratios
Newell Brands Inc.
Newell Brands shows a mix of ratio strengths and weaknesses. Key concerns include negative net margin (-2.85%) and return on equity (-7.85%), indicating profitability challenges. The debt-to-equity ratio at 1.86 and low interest coverage of 0.12 suggest financial risk. The dividend yield is a favorable 2.85%, supported by a stable payout, but investors should monitor cash flow coverage and leverage.
Helen of Troy Limited
Helen of Troy presents mostly favorable to neutral ratios, with a net margin of 6.49% and a return on equity of 7.35% marked as unfavorable but moderate. The company benefits from strong liquidity, with a current ratio of 2.0 and quick ratio above 1.0, and a conservative debt level (debt-to-equity 0.57). Helen of Troy does not pay dividends, likely due to reinvestment and growth priorities.
Which one has the best ratios?
Helen of Troy exhibits a more favorable overall ratio profile, with 42.86% favorable metrics and strong liquidity ratios. Newell Brands has a slightly unfavorable profile with notable profitability and leverage concerns. While Helen of Troy’s lack of dividends may reflect growth focus, its healthier balance sheet contrasts with Newell’s financial risk indicators.
Strategic Positioning
This section compares the strategic positioning of Newell Brands Inc. and Helen of Troy Limited, including market position, key segments, and exposure to technological disruption:
Newell Brands Inc.
- Established consumer products company with $1.74B market cap, facing moderate competitive pressure in consumer defensive sector.
- Diverse segments: Commercial Solutions, Home Appliances, Home Solutions, Learning and Development, Outdoor.
- No explicit mention of technological disruption exposure; operates in traditional household and personal products.
Helen of Troy Limited
- Smaller player with $431M market cap, operating in the same sector with less market influence and competitive pressure.
- Focused on three segments: Home & Outdoor, Health & Wellness, and Beauty products.
- No explicit mention of technological disruption exposure; operates in traditional consumer goods markets.
Newell Brands Inc. vs Helen of Troy Limited Positioning
Newell Brands exhibits a diversified product portfolio across multiple segments, potentially mitigating risks through broad exposure. Helen of Troy concentrates on fewer segments, possibly enabling focused expertise but increasing dependence on fewer markets.
Which has the best competitive advantage?
Both companies are currently shedding value relative to their cost of capital. Newell’s slightly unfavorable MOAT contrasts with Helen of Troy’s very unfavorable status, indicating Newell may have a relatively better competitive advantage despite both facing profitability challenges.
Stock Comparison
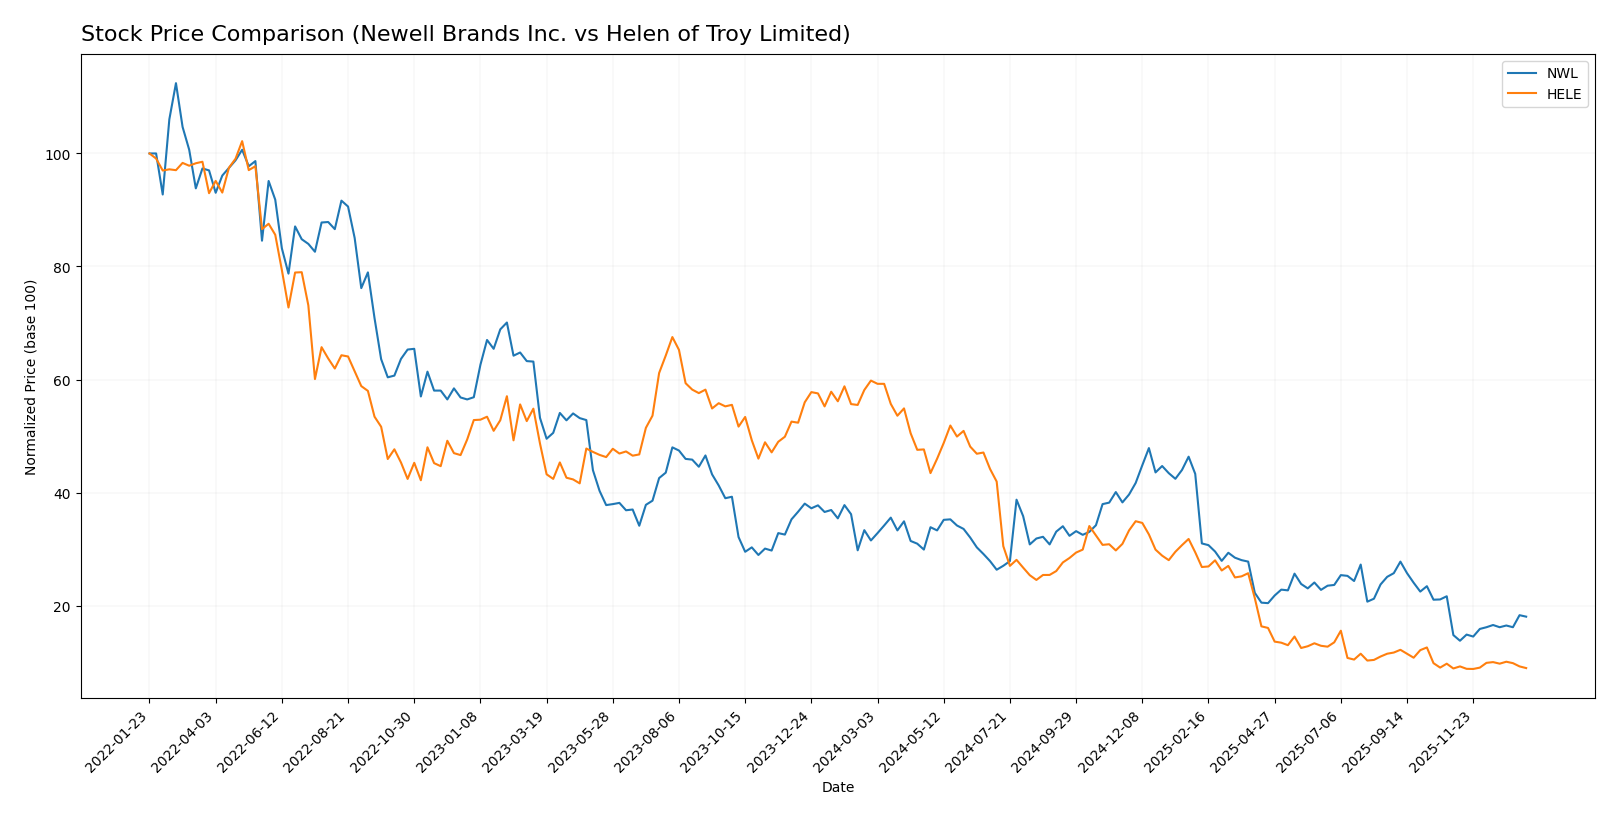
The stock prices of Newell Brands Inc. (NWL) and Helen of Troy Limited (HELE) have experienced significant declines over the past year, with notable recent shifts in trading dynamics and volume trends.
Trend Analysis
Newell Brands Inc. (NWL) shows a bearish trend over the past 12 months with a price decline of -42.76%, accompanied by accelerating downward momentum and a moderate volatility of 1.87. Recent months reveal a bullish reversal with a 22.06% gain and stable low volatility.
Helen of Troy Limited (HELE) also experienced a bearish trend over 12 months, with a steep -85.04% drop and accelerating decline, marked by high volatility at 31.1. The recent short-term trend is neutral with a 0.81% rise but seller dominance persists in volume.
Comparing the two, NWL has delivered the higher market performance with a smaller overall loss and stronger recent recovery, while HELE shows a more pronounced long-term decline and weaker short-term price gains.
Target Prices
The current analyst consensus presents a mixed outlook for Newell Brands Inc. and Helen of Troy Limited.
| Company | Target High | Target Low | Consensus |
|---|---|---|---|
| Newell Brands Inc. | 7.00 | 4.00 | 5.08 |
| Helen of Troy Limited | 22.00 | 22.00 | 22.00 |
Analysts expect Newell Brands to trade moderately above its current price of 4.15 USD, while Helen of Troy’s consensus target of 22 USD suggests significant upside from its current 18.78 USD price.
Analyst Opinions Comparison
This section compares analysts’ ratings and grades for Newell Brands Inc. and Helen of Troy Limited:
Rating Comparison
NWL Rating
- Rating: C+, considered very favorable overall.
- Discounted Cash Flow Score: 5, very favorable.
- ROE Score: 1, very unfavorable.
- ROA Score: 1, very unfavorable.
- Debt To Equity Score: 1, very unfavorable.
- Overall Score: 2, moderate.
HELE Rating
- Rating: B, considered very favorable overall.
- Discounted Cash Flow Score: 5, very favorable.
- ROE Score: 1, very unfavorable.
- ROA Score: 1, very unfavorable.
- Debt To Equity Score: 4, favorable.
- Overall Score: 3, moderate.
Which one is the best rated?
Helen of Troy Limited holds a higher overall rating (B) and score (3) compared to Newell Brands Inc. (C+ and 2). HELE also has a stronger debt-to-equity score, indicating relatively better financial stability in this metric.
Scores Comparison
The following table presents a comparison of financial scores for Newell Brands Inc. and Helen of Troy Limited:
NWL Scores
- Altman Z-Score: 0.51, indicating distress zone risk of bankruptcy.
- Piotroski Score: 4, categorized as average financial strength.
HELE Scores
- Altman Z-Score: 1.10, also in distress zone signaling financial distress.
- Piotroski Score: 3, indicating very weak financial health.
Which company has the best scores?
Based on the provided data, NWL shows a slightly lower bankruptcy risk with a better Piotroski score than HELE, which has weaker financial strength and a marginally higher distress risk.
Grades Comparison
The following is a detailed comparison of the recent grades assigned to Newell Brands Inc. and Helen of Troy Limited:
Newell Brands Inc. Grades
Presented below are the recent grades for Newell Brands Inc. from leading financial institutions:
| Grading Company | Action | New Grade | Date |
|---|---|---|---|
| Citigroup | Maintain | Neutral | 2025-12-17 |
| UBS | Maintain | Neutral | 2025-12-02 |
| Canaccord Genuity | Maintain | Buy | 2025-11-03 |
| RBC Capital | Maintain | Sector Perform | 2025-11-03 |
| JP Morgan | Maintain | Overweight | 2025-11-03 |
| Citigroup | Maintain | Neutral | 2025-11-03 |
| JP Morgan | Maintain | Overweight | 2025-10-23 |
| Citigroup | Maintain | Neutral | 2025-10-09 |
| Citigroup | Maintain | Neutral | 2025-09-16 |
| Canaccord Genuity | Maintain | Buy | 2025-08-04 |
Newell Brands shows a consistent pattern of neutral to buy ratings, with no downgrades reported recently.
Helen of Troy Limited Grades
Below are the recent grades for Helen of Troy Limited from recognized grading firms:
| Grading Company | Action | New Grade | Date |
|---|---|---|---|
| UBS | Maintain | Neutral | 2026-01-09 |
| Canaccord Genuity | Maintain | Hold | 2026-01-09 |
| Canaccord Genuity | Maintain | Hold | 2026-01-06 |
| UBS | Maintain | Neutral | 2025-10-10 |
| Canaccord Genuity | Maintain | Hold | 2025-10-10 |
| UBS | Maintain | Neutral | 2025-10-02 |
| Canaccord Genuity | Downgrade | Hold | 2025-07-11 |
| UBS | Maintain | Neutral | 2025-07-11 |
| Canaccord Genuity | Maintain | Buy | 2025-07-07 |
| Canaccord Genuity | Maintain | Buy | 2025-04-25 |
Helen of Troy’s grades primarily range from hold to neutral, with some recent downgrades from buy to hold.
Which company has the best grades?
Newell Brands consistently receives more favorable grades, frequently rated as buy or overweight, while Helen of Troy tends toward hold and neutral ratings. This suggests Newell may be viewed with slightly higher confidence by analysts, potentially influencing investors seeking stronger endorsement signals.
Strengths and Weaknesses
Below is a comparative overview of key strengths and weaknesses for Newell Brands Inc. (NWL) and Helen of Troy Limited (HELE) based on the most recent financial and operational data.
| Criterion | Newell Brands Inc. (NWL) | Helen of Troy Limited (HELE) |
|---|---|---|
| Diversification | Highly diversified product segments including Home, Learning, Outdoor; broad revenue base (e.g., $4.1B Home & Commercial in 2024) | Focused on Beauty & Wellness and Home & Outdoor; less diversified but concentrated in growing segments |
| Profitability | Currently unfavorable profitability metrics; negative net margin (-2.85%) and ROE (-7.85%); ROIC slightly positive but below WACC | Moderate profitability with 6.49% net margin and 7.35% ROE; ROIC above 5%, but declining trend observed |
| Innovation | Moderate innovation; improving ROIC trend indicates some operational improvements | Innovation impact unclear; declining ROIC suggests challenges in sustaining competitive advantage |
| Global presence | Strong global footprint via multiple segments and markets | Strong presence in niche consumer sectors globally, but less broad than NWL |
| Market Share | Large market share in several categories, but value destruction ongoing | Smaller than NWL but stable market share in beauty and home segments |
Key takeaways: Newell Brands offers broad diversification and improving operational efficiency but struggles with profitability and value creation. Helen of Troy shows better profitability metrics and a focused product portfolio but faces declining returns on invested capital, signaling caution for growth sustainability.
Risk Analysis
Below is a comparison table of key risks for Newell Brands Inc. (NWL) and Helen of Troy Limited (HELE) based on the latest available data from 2025-2026.
| Metric | Newell Brands Inc. (NWL) | Helen of Troy Limited (HELE) |
|---|---|---|
| Market Risk | Beta 0.89, moderate market sensitivity but recent stock price dropped 1.4% | Beta 0.78, slightly lower market sensitivity, recent decline of 3.17% |
| Debt Level | High debt-to-equity ratio of 1.86, interest coverage very low at 0.12 | Moderate debt-to-equity ratio of 0.57, interest coverage adequate at 4.11 |
| Regulatory Risk | Moderate, operates globally with diverse product lines, but no recent regulatory issues reported | Moderate, sells across multiple regions with health & wellness products subject to regulation |
| Operational Risk | Large workforce (23,700 employees) and diversified segments increase complexity | Smaller company (1,883 employees) but broad product range increases operational challenges |
| Environmental Risk | Exposure through manufacturing and product sourcing, but no major incidents reported | Moderate exposure, especially in health and outdoor products sectors |
| Geopolitical Risk | Global supply chain could be affected by international tensions | Exposure in multiple continents but less scale reduces absolute risk |
Synthesis: Newell Brands faces the most impactful risk from its high debt level combined with very low interest coverage, raising concerns about financial stability despite its broad market presence. Helen of Troy shows lower financial leverage and better liquidity but has weaker profitability scores and a very weak Piotroski score, indicating operational and value risks. Market fluctuations remain relevant for both due to beta near 0.8-0.9 and recent price declines. Investors should prioritize debt management and cash flow monitoring when considering these stocks.
Which Stock to Choose?
Newell Brands Inc. (NWL) shows a declining revenue trend with a 6.77% drop in 2024 and a negative net margin of -2.85%. Its financial ratios are slightly unfavorable, with weak profitability metrics and high debt levels. The rating is very favorable (C+), reflecting mixed performance, while the company is shedding value despite an improving ROIC trend.
Helen of Troy Limited (HELE) presents a higher gross margin of 47.93% and a positive net margin of 6.49%, though recent revenue and earnings growth are unfavorable. Its financial ratios are slightly favorable overall, supported by strong liquidity and moderate debt. The rating is very favorable (B), but the company is destroying value with declining profitability.
Investors prioritizing income statement strength and improving profitability might find Newell Brands appealing due to its favorable income trends and improving ROIC, despite financial weaknesses. Conversely, those valuing stronger liquidity and stable financial ratios could see Helen of Troy as more suitable, though its profitability decline signals caution.
Disclaimer: Investment carries a risk of loss of initial capital. The past performance is not a reliable indicator of future results. Be sure to understand risks before making an investment decision.
Go Further
I encourage you to read the complete analyses of Newell Brands Inc. and Helen of Troy Limited to enhance your investment decisions: