Home > Comparison > Consumer Defensive > KMB vs HELE
The strategic rivalry between Kimberly-Clark Corporation and Helen of Troy Limited shapes the Consumer Defensive sector’s competitive landscape. Kimberly-Clark operates as a capital-intensive manufacturer of personal care and tissue products, while Helen of Troy functions as a diversified consumer products innovator across health, beauty, and home segments. This clash highlights a battle between scale-driven stability and agile brand expansion. This analysis will identify which business model offers superior risk-adjusted returns for a diversified portfolio.
Table of contents
Companies Overview
Kimberly-Clark and Helen of Troy both shape the global household and personal products market with distinct scale and reach.
Kimberly-Clark Corporation: Global Consumer Tissue Leader
Kimberly-Clark dominates the household & personal products sector through its diversified portfolio of personal care and consumer tissue products. Its revenue engine splits across Personal Care, Consumer Tissue, and K-C Professional segments, leveraging iconic brands like Huggies and Kleenex. In 2026, its strategic focus remains on expanding away-from-home use products and direct-to-retail distribution channels, cementing its broad market footprint.
Helen of Troy Limited: Diverse Consumer Products Innovator
Helen of Troy operates primarily in consumer goods across Home & Outdoor, Health & Wellness, and Beauty segments. Its revenue model hinges on branded products such as OXO, Hydro Flask, and Braun distributed globally via mass merchandisers and e-commerce. The company’s 2026 strategy emphasizes innovation in health and wellness products, broadening its footprint in specialty retail and direct consumer channels.
Strategic Collision: Similarities & Divergences
Both firms emphasize branded consumer products but diverge in scale and segment focus—Kimberly-Clark favors essential consumables, Helen of Troy leans on lifestyle and wellness innovation. They compete for consumer mindshare across mass retail and specialty channels. Kimberly-Clark’s massive scale contrasts with Helen of Troy’s niche agility, creating distinct investment profiles centered on steady cash flow versus growth potential.
Income Statement Comparison
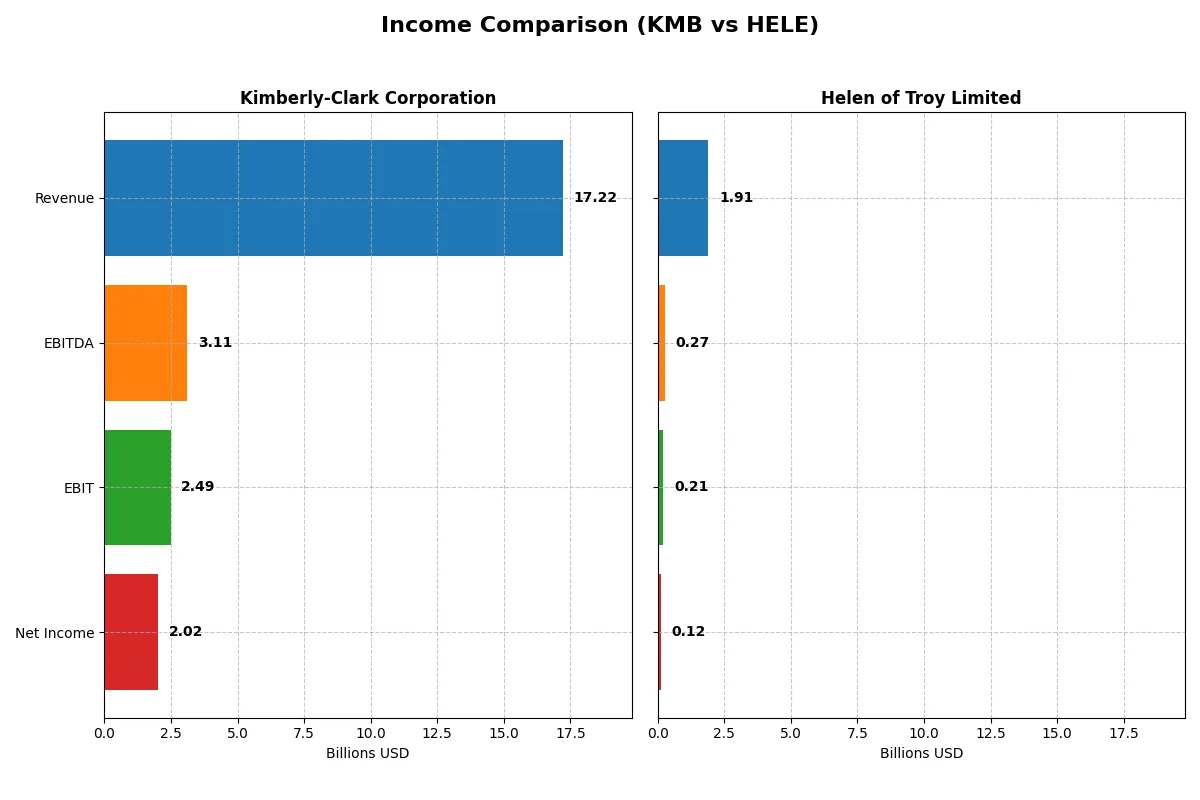
This data dissects the core profitability and scalability of both corporate engines to reveal who dominates the bottom line:
| Metric | Kimberly-Clark Corporation (KMB) | Helen of Troy Limited (HELE) |
|---|---|---|
| Revenue | 17.2B | 1.91B |
| Cost of Revenue | 11.1B | 993M |
| Operating Expenses | 3.64B | 772M |
| Gross Profit | 6.13B | 914M |
| EBITDA | 3.11B | 269M |
| EBIT | 2.49B | 214M |
| Interest Expense | 256M | 52M |
| Net Income | 2.02B | 124M |
| EPS | 6.08 | 5.38 |
| Fiscal Year | 2025 | 2025 |
Income Statement Analysis: The Bottom-Line Duel
This income statement comparison unveils the core operating efficiency and profitability trends of two distinct corporate engines.
Kimberly-Clark Corporation Analysis
Kimberly-Clark’s revenue fell 14% in 2025, yet net income rose 11% over five years, signaling resilient bottom-line growth. Gross margin stayed healthy at 35.6%, with net margin solid at 11.7%. Despite a recent revenue dip, the company maintains strong operational leverage and efficiency, supported by a favorable EBIT margin of 14.5%.
Helen of Troy Limited Analysis
Helen of Troy’s revenue declined nearly 5% in 2025, with net income shrinking over 50% across five years. Gross margin remains robust at 47.9%, but net margin dropped to 6.5%, reflecting margin compression. The company’s EBIT margin at 11.2% indicates moderate operating efficiency, yet recent earnings contraction highlights challenges in sustaining profitability momentum.
Margin Sustainability vs. Earnings Resilience
Kimberly-Clark delivers steadier net income growth and stronger EBIT margins despite revenue headwinds. Helen of Troy boasts higher gross margins but suffers marked net income and margin declines. For investors prioritizing consistent earnings resilience, Kimberly-Clark’s profile appears more attractive given its superior margin sustainability and overall income growth.
Financial Ratios Comparison
These vital ratios act as a diagnostic tool to expose the underlying fiscal health, valuation premiums, and capital efficiency of the companies compared below:
| Ratios | Kimberly-Clark Corporation (KMB) | Helen of Troy Limited (HELE) |
|---|---|---|
| ROE | 3.03% (2024) | 7.35% (2025) |
| ROIC | 25.33% (2024) | 5.34% (2025) |
| P/E | 17.35 (2024) | 10.25 (2025) |
| P/B | 52.57 (2024) | 0.75 (2025) |
| Current Ratio | 0.80 (2024) | 2.00 (2025) |
| Quick Ratio | 0.54 (2024) | 1.03 (2025) |
| D/E | 9.42 (2024) | 0.57 (2025) |
| Debt-to-Assets | 47.84% (2024) | 30.55% (2025) |
| Interest Coverage | 11.89 (2024) | 2.75 (2025) |
| Asset Turnover | 1.21 (2024) | 0.61 (2025) |
| Fixed Asset Turnover | 2.67 (2024) | 5.23 (2025) |
| Payout ratio | 64.0% (2024) | 0% (2025) |
| Dividend yield | 3.69% (2024) | 0% (2025) |
| Fiscal Year | 2024 | 2025 |
Efficiency & Valuation Duel: The Vital Signs
Ratios act as a company’s DNA, revealing hidden risks and operational excellence through key profitability and valuation metrics.
Kimberly-Clark Corporation
Kimberly-Clark shows strong net margins at 11.74%, signaling operational efficiency. Its P/E ratio of 16.63 suggests a fairly valued stock, neither expensive nor cheap. The 4.94% dividend yield rewards shareholders consistently. However, zero return on equity and invested capital raise concerns about capital efficiency, despite favorable debt and interest coverage metrics.
Helen of Troy Limited
Helen of Troy posts a moderate net margin of 6.49% with a low P/E of 10.25, indicating an attractively valued stock. ROE at 7.35% is modest but below ideal levels. The company retains earnings to fuel growth, offering no dividends. Its liquidity ratios, including a 2.0 current ratio, reflect financial stability, though interest coverage is just neutral.
Stable Income vs. Growth Potential
Kimberly-Clark balances solid margins and shareholder dividends against weak capital returns, reflecting a mature, income-oriented profile. Helen of Troy presents a cheaper valuation and stronger liquidity but lower profitability and no dividend. Investors seeking steady income may prefer Kimberly-Clark; those favoring growth and financial safety might lean toward Helen of Troy.
Which one offers the Superior Shareholder Reward?
I observe Kimberly-Clark (KMB) delivers a steady 4.9% dividend yield with an 82% payout ratio, signaling a mature, income-focused distribution strategy. Helen of Troy (HELE) pays no dividend, reinvesting heavily in growth and acquisitions, supported by a solid free cash flow coverage near 73%. KMB counters with moderate buybacks, enhancing total returns alongside dividends. HELE’s buyback intensity is less evident but its reinvestment fuels higher operating margins and cash flow growth. I judge KMB’s model more sustainable for income investors due to consistent dividends and buybacks. For growth-focused investors, HELE’s reinvestment offers upside but with higher risk. In 2026, KMB offers the superior total shareholder reward for prudent, income-oriented portfolios.
Comparative Score Analysis: The Strategic Profile
The radar chart reveals the fundamental DNA and trade-offs of Kimberly-Clark Corporation and Helen of Troy Limited:
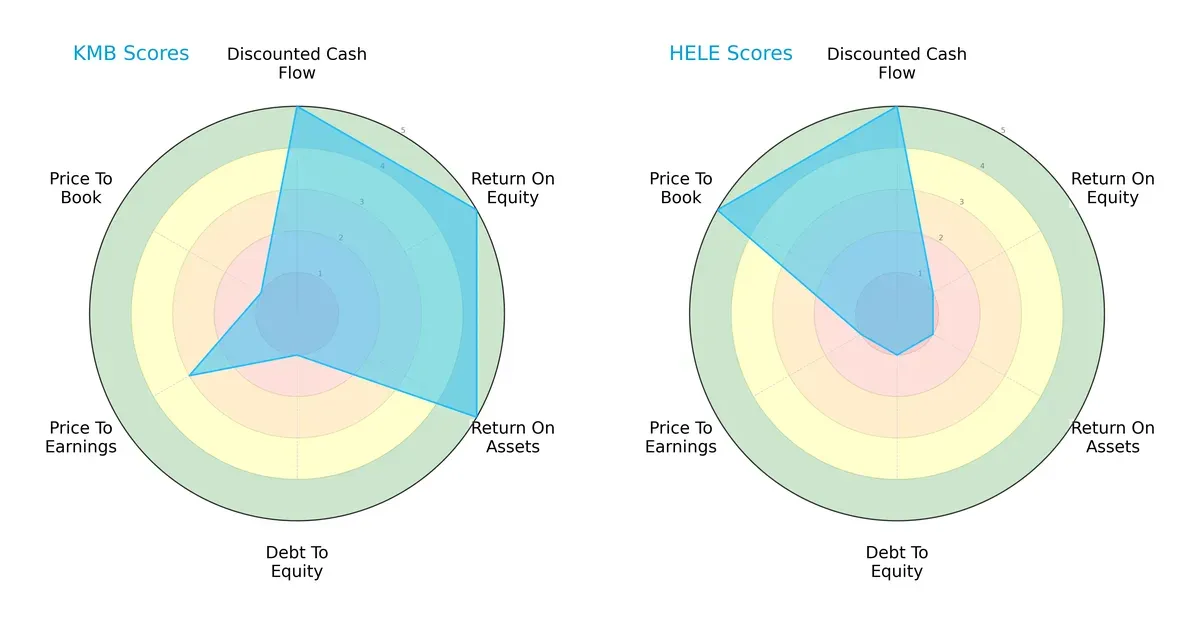
Kimberly-Clark delivers a balanced profile with very favorable DCF, ROE, and ROA scores, indicating strong profitability and asset use. However, its debt-to-equity and price-to-book scores are very unfavorable, signaling financial leverage risks and possible overvaluation on book value. Helen of Troy matches Kimberly-Clark’s DCF strength but underperforms sharply on ROE and ROA, reflecting weaker operational efficiency. Its strong price-to-book score suggests market optimism despite financial weaknesses. Kimberly-Clark’s profile is more balanced; Helen of Troy relies on valuation appeal.
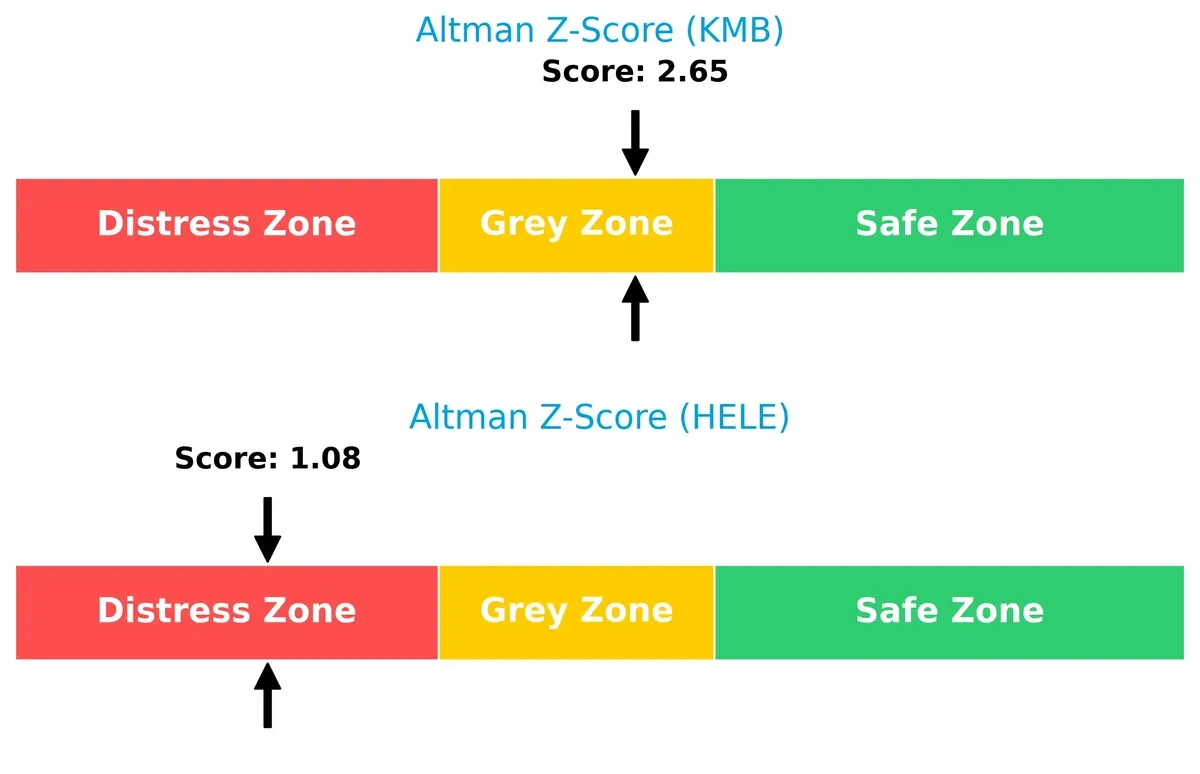
Bankruptcy Risk: Solvency Showdown
Kimberly-Clark’s Altman Z-Score of 2.65 places it in the grey zone, signaling moderate bankruptcy risk. Helen of Troy scores 1.08, deep in the distress zone, implying high financial distress and survival risk in this cycle:
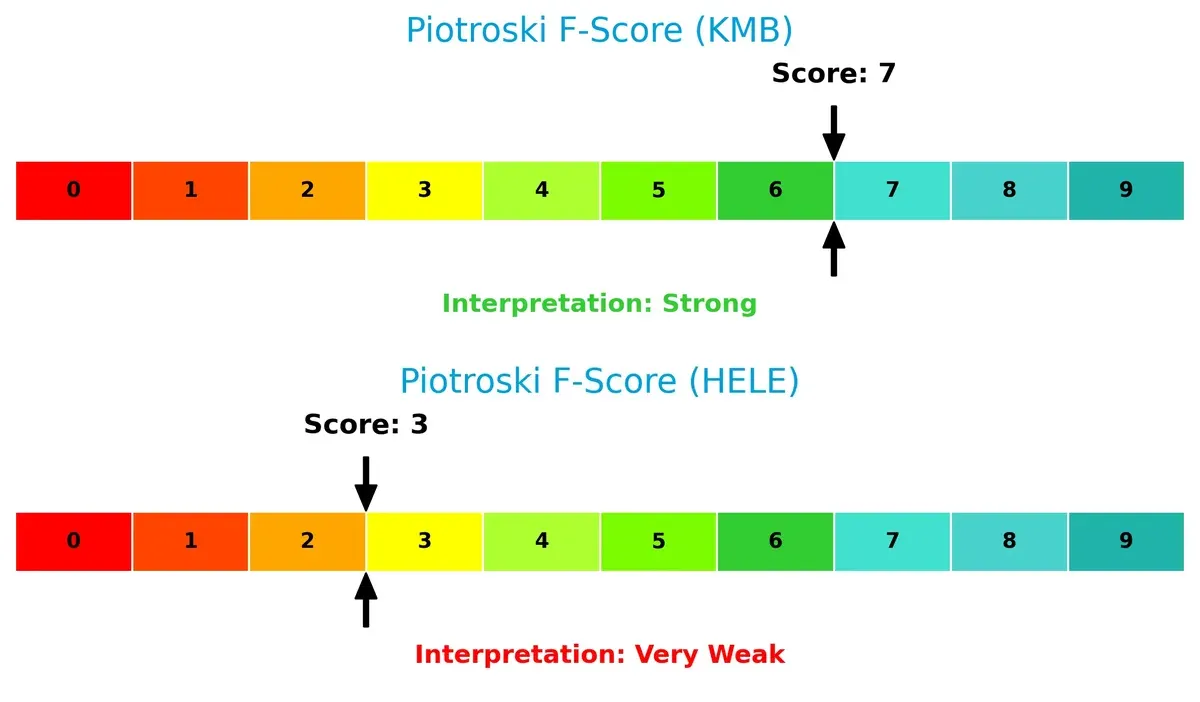
Financial Health: Quality of Operations
Kimberly-Clark’s Piotroski F-Score of 7 reflects strong financial health with solid profitability and operational efficiency. Helen of Troy’s score of 3 raises red flags, indicating weak internal financial metrics and poor quality of earnings:
How are the two companies positioned?
This section dissects the operational DNA of Kimberly-Clark and Helen of Troy by comparing their revenue distribution by segment and internal dynamics. The goal is to confront their economic moats and reveal which model offers the most resilient and sustainable competitive advantage today.
Revenue Segmentation: The Strategic Mix
This visual comparison dissects how Kimberly-Clark and Helen of Troy diversify their income streams and reveals where their primary sector bets lie:
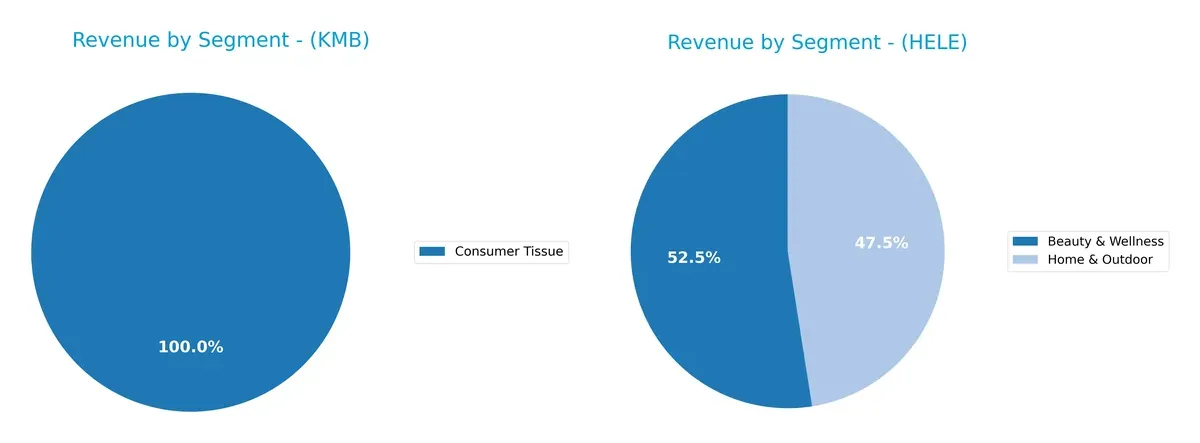
Kimberly-Clark anchors its revenue heavily in Personal Care, generating over 10B recently, with Consumer Tissue and K-C Professional adding diversification but less than half of Personal Care. Helen of Troy displays a balanced mix between Beauty & Wellness (~1.0B) and Home & Outdoor (~0.9B), avoiding concentration risk. Kimberly-Clark’s reliance on one dominant segment implies ecosystem lock-in, while Helen of Troy’s split mitigates volatility across consumer categories.
Strengths and Weaknesses Comparison
This table compares the Strengths and Weaknesses of Kimberly-Clark Corporation (KMB) and Helen of Troy Limited (HELE):
KMB Strengths
- Strong diversification in Consumer Tissue, K-C Professional, and Personal Care segments
- Favorable net margin at 11.74%
- Low debt-to-equity and debt-to-assets ratios
- High interest coverage ratio at 9.73
- Attractive dividend yield at 4.94%
HELE Strengths
- Balanced product segmentation in Beauty & Wellness and Home & Outdoor
- Favorable WACC at 5.58% and PE ratio at 10.25
- Solid current and quick ratios indicating liquidity
- Favorable fixed asset turnover at 5.23
- Moderate ROIC at 5.34% with positive trend
KMB Weaknesses
- Unfavorable ROE and ROIC at 0%, indicating poor capital efficiency
- Unavailable WACC data limits cost of capital analysis
- Weak liquidity ratios with zero current and quick ratios
- Unfavorable asset and fixed asset turnover ratios
- Neutral PE ratio suggests limited valuation upside
HELE Weaknesses
- Lower net margin at 6.49%
- ROE at 7.35% considered unfavorable
- Moderate debt-to-equity and debt-to-assets ratios
- Interest coverage ratio only neutral at 4.11
- No dividend yield, reducing income appeal
KMB’s strength lies in its diversified product base and conservative leverage, but poor capital efficiency and liquidity metrics raise concerns. HELE shows solid liquidity and asset utilization but faces profitability challenges and lacks dividend income, signaling different strategic priorities.
The Moat Duel: Analyzing Competitive Defensibility
A structural moat is the only reliable barrier protecting long-term profits from relentless competitive erosion. Let’s dissect the defensive strengths of two industry players:
Kimberly-Clark Corporation: Intangible Asset Moat
Kimberly-Clark’s competitive edge stems from powerful brand recognition and trusted product lines. This intangible asset moat delivers stable margins near 14.5% EBIT. I see risks from declining revenue trends but potential in expanding emerging markets in 2026.
Helen of Troy Limited: Product Differentiation Moat
Helen of Troy relies on innovative consumer products and diversified categories, contrasting Kimberly-Clark’s brand moat. Despite a higher gross margin near 48%, its shrinking ROIC signals weakening defense. New health and wellness expansions could revive growth if executed well.
Moat Battle: Brand Strength vs. Innovation Agility
Kimberly-Clark’s deeper moat is anchored in enduring brand loyalty and margin stability. Helen of Troy’s innovation moat is narrower and currently under pressure from declining returns. Kimberly-Clark remains better positioned to protect market share amid 2026’s challenges.
Which stock offers better returns?
Both Kimberly-Clark Corporation and Helen of Troy Limited have experienced significant downward price movements over the past year, with differing volatility and trading dynamics.
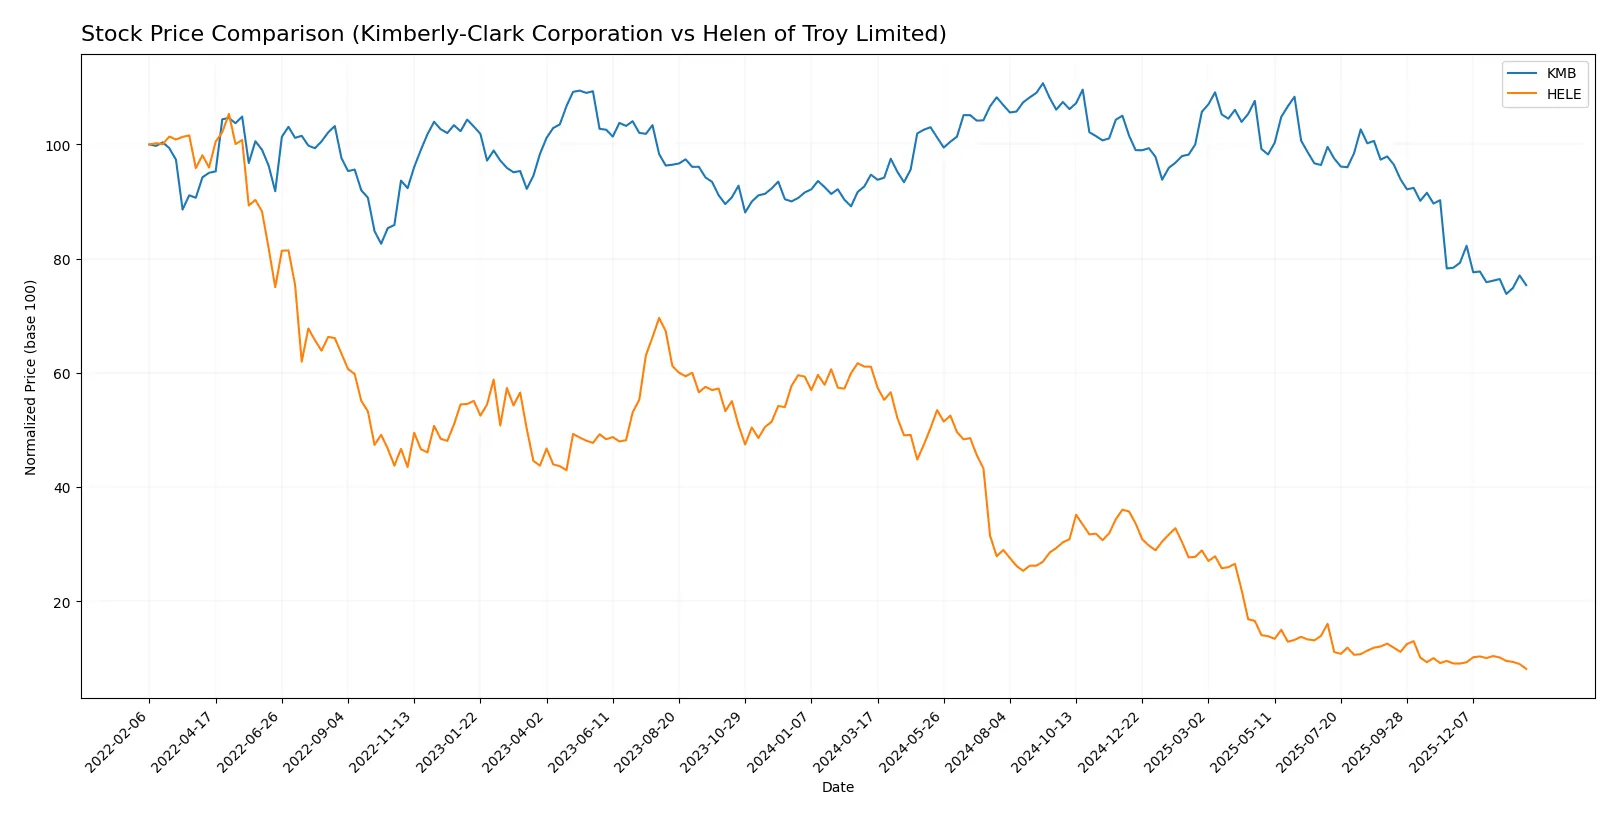
Trend Comparison
Kimberly-Clark Corporation’s stock declined 20.42% over the past 12 months, marking a bearish trend with decelerating losses. The price fluctuated between 146.91 and 97.92, showing moderate volatility (std deviation 12.48).
Helen of Troy Limited’s stock fell 86.68% during the same period, also bearish but with accelerating losses. The price ranged widely from 124.36 to 16.56, accompanied by high volatility (std deviation 29.84).
Kimberly-Clark’s decline was less severe than Helen of Troy’s. KMB delivered the highest market performance despite both stocks trending downward.
Target Prices
Analysts present a mixed but actionable consensus for Kimberly-Clark and Helen of Troy.
| Company | Target Low | Target High | Consensus |
|---|---|---|---|
| Kimberly-Clark Corporation | 102 | 162 | 122.38 |
| Helen of Troy Limited | 22 | 22 | 22 |
Kimberly-Clark’s consensus target of 122.38 suggests a 22% upside versus the current 99.99 share price. Helen of Troy’s fixed target at 22 signals a significant potential gain from 16.56.

Don’t Let Luck Decide Your Entry Point
Optimize your entry points with our advanced ProRealTime indicators. You’ll get efficient buy signals with precise price targets for maximum performance. Start outperforming now!
How do institutions grade them?
Here are the latest institutional grades for Kimberly-Clark Corporation and Helen of Troy Limited:
Kimberly-Clark Corporation Grades
The table below shows recent grades from recognized financial institutions for Kimberly-Clark Corporation.
| Grading Company | Action | New Grade | Date |
|---|---|---|---|
| UBS | Maintain | Neutral | 2026-01-28 |
| Citigroup | Maintain | Sell | 2026-01-14 |
| UBS | Maintain | Neutral | 2026-01-14 |
| TD Cowen | Maintain | Hold | 2026-01-08 |
| Wells Fargo | Maintain | Equal Weight | 2026-01-05 |
| Citigroup | Maintain | Sell | 2025-12-17 |
| BNP Paribas Exane | Maintain | Neutral | 2025-12-01 |
| Argus Research | Upgrade | Buy | 2025-11-13 |
| Wells Fargo | Maintain | Equal Weight | 2025-11-04 |
| Evercore ISI Group | Downgrade | In Line | 2025-11-04 |
Helen of Troy Limited Grades
Below is a summary of recent grades from established financial firms for Helen of Troy Limited.
| Grading Company | Action | New Grade | Date |
|---|---|---|---|
| Canaccord Genuity | Maintain | Hold | 2026-01-09 |
| UBS | Maintain | Neutral | 2026-01-09 |
| Canaccord Genuity | Maintain | Hold | 2026-01-06 |
| Canaccord Genuity | Maintain | Hold | 2025-10-10 |
| UBS | Maintain | Neutral | 2025-10-10 |
| UBS | Maintain | Neutral | 2025-10-02 |
| UBS | Maintain | Neutral | 2025-07-11 |
| Canaccord Genuity | Downgrade | Hold | 2025-07-11 |
| Canaccord Genuity | Maintain | Buy | 2025-07-07 |
| Canaccord Genuity | Maintain | Buy | 2025-04-25 |
Which company has the best grades?
Kimberly-Clark has a wider grade range, including buy and sell ratings, while Helen of Troy’s grades concentrate mostly on hold and neutral. Kimberly-Clark’s mixed signals suggest more analyst debate, potentially increasing volatility for investors. Helen of Troy’s consistent hold ratings indicate stable sentiment but limited upside expectations.
Risks specific to each company
The following categories identify the critical pressure points and systemic threats facing both firms in the 2026 market environment:
1. Market & Competition
Kimberly-Clark Corporation
- Established leader with strong brand portfolio in consumer tissue and personal care, but faces mature market pressures.
Helen of Troy Limited
- Diverse consumer products with exposure to competitive niches, yet limited scale and brand power relative to KMB.
2. Capital Structure & Debt
Kimberly-Clark Corporation
- Strong debt metrics with favorable interest coverage, low leverage reported.
Helen of Troy Limited
- Moderate leverage; debt-to-assets at 30.55% reflects higher financial risk than KMB.
3. Stock Volatility
Kimberly-Clark Corporation
- Very low beta (0.276) indicates defensive stock with low market volatility.
Helen of Troy Limited
- Higher beta (0.78) shows greater sensitivity to market swings, riskier equity profile.
4. Regulatory & Legal
Kimberly-Clark Corporation
- Operates globally with exposure to regulatory scrutiny in personal care and hygiene products.
Helen of Troy Limited
- Broad geographic reach in regulated consumer goods, with risks in health and wellness product compliance.
5. Supply Chain & Operations
Kimberly-Clark Corporation
- Large-scale operations with potential supply chain complexity but benefits from scale economies.
Helen of Troy Limited
- Smaller scale operations increase vulnerability to supply disruptions and cost pressures.
6. ESG & Climate Transition
Kimberly-Clark Corporation
- Increasing ESG focus, especially in sustainable sourcing and packaging, but faces industry-wide pressures.
Helen of Troy Limited
- ESG initiatives less mature; climate transition risks more pronounced given product diversity and supply chain.
7. Geopolitical Exposure
Kimberly-Clark Corporation
- Global footprint exposes it to geopolitical risks, but diversified markets mitigate impact.
Helen of Troy Limited
- Exposure to emerging markets heightens geopolitical risk, with less geographical diversification.
Which company shows a better risk-adjusted profile?
Kimberly-Clark’s strongest risk is intense market maturity limiting growth. Helen of Troy faces capital structure risks and weaker financial health. KMB’s lower volatility and stronger balance sheet yield a superior risk-adjusted profile. Its Altman Z-Score in the grey zone contrasts with HELE’s distress zone, underscoring higher bankruptcy risk for Helen of Troy. Recent data reveal KMB’s robust interest coverage (9.73x) versus HELE’s weaker 4.11x, justifying caution toward Helen of Troy’s leverage.
Final Verdict: Which stock to choose?
Kimberly-Clark’s superpower lies in its dependable cash generation and strong dividend yield, making it a reliable income source. However, its weakening asset efficiency and low liquidity ratios are points of vigilance. It suits portfolios seeking steady income with moderate growth exposure.
Helen of Troy benefits from a distinct strategic moat in product innovation and a solid balance sheet with healthy liquidity. While it shows slower profitability and some value erosion, it offers better financial stability compared to Kimberly-Clark. It fits well with GARP (Growth at a Reasonable Price) investors who tolerate moderate risk.
If you prioritize consistent income and dividend stability, Kimberly-Clark is the compelling choice due to its proven cash flow resilience. However, if you seek moderate growth with stronger financial footing, Helen of Troy offers better stability despite current profitability challenges. Both carry risks that require careful portfolio alignment.
Disclaimer: Investment carries a risk of loss of initial capital. The past performance is not a reliable indicator of future results. Be sure to understand risks before making an investment decision.
Go Further
I encourage you to read the complete analyses of Kimberly-Clark Corporation and Helen of Troy Limited to enhance your investment decisions: