In the competitive world of household and personal products, Kenvue Inc. and Helen of Troy Limited stand out as influential players with distinct market approaches. Both companies innovate across overlapping consumer segments, from health and beauty to wellness and home essentials. This comparison explores their strategies and market positions to help you, the investor, identify which company offers the most compelling opportunity for your portfolio in 2026.
Table of contents
Companies Overview
I will begin the comparison between Kenvue Inc. and Helen of Troy Limited by providing an overview of these two companies and their main differences.
Kenvue Inc. Overview
Kenvue Inc. operates as a global consumer health company focused on three segments: Self Care, Skin Health and Beauty, and Essential Health. Its product portfolio includes well-known brands like Tylenol, Neutrogena, and Johnson’s. Headquartered in Skillman, New Jersey, Kenvue is a subsidiary of Johnson & Johnson and serves the household and personal products industry with a market cap of approximately 32.6B USD.
Helen of Troy Limited Overview
Helen of Troy Limited is a multinational consumer products company operating through Home & Outdoor, Health & Wellness, and Beauty segments. Its diverse brand lineup includes OXO, Hydro Flask, and Braun. Incorporated in 1968 and based in El Paso, Texas, Helen of Troy sells across various global markets and retail channels. The company’s market cap stands near 431M USD in the household and personal products sector.
Key similarities and differences
Both companies operate in the household and personal products industry, offering diverse product ranges across consumer health, beauty, and wellness segments. Kenvue targets global health-focused brands and operates as a subsidiary, while Helen of Troy focuses on a broader consumer goods portfolio with multiple brands and global retail presence. Market capitalization and scale differ substantially, with Kenvue being significantly larger in workforce and valuation.
Income Statement Comparison
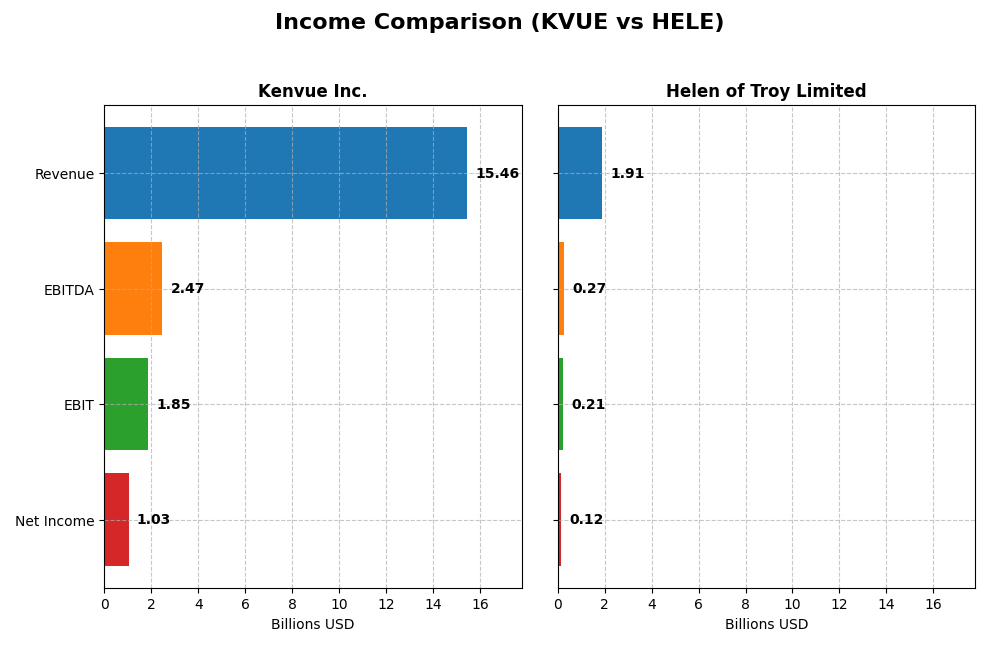
This table compares key income statement metrics for Kenvue Inc. and Helen of Troy Limited for their most recent fiscal years, providing a clear overview of their financial performance.
| Metric | Kenvue Inc. (KVUE) | Helen of Troy Limited (HELE) |
|---|---|---|
| Market Cap | 32.6B | 431M |
| Revenue | 15.5B | 1.91B |
| EBITDA | 2.47B | 269M |
| EBIT | 1.85B | 214M |
| Net Income | 1.03B | 124M |
| EPS | 0.54 | 5.38 |
| Fiscal Year | 2024 | 2025 |
Income Statement Interpretations
Kenvue Inc.
Kenvue’s revenue showed modest growth of 6.83% over 2020-2024, peaking at $15.45B in 2024, with net income surging 217.18% to $1.03B. Margins remain favorable, with a gross margin near 58% and a net margin of 6.66%. However, 2024 saw slowing revenue growth (0.07%) and a decline in EBIT and net margin, signaling margin pressure despite overall positive fundamentals.
Helen of Troy Limited
Helen of Troy’s revenue declined 9.11% over 2021-2025, falling to $1.91B in 2025, with net income dropping 51.27% to $124M. Margins are stable but lower than Kenvue’s, with a gross margin around 48% and net margin of 6.49%. The latest year’s performance showed negative growth across revenue, EBIT, and net margin, indicating ongoing profitability challenges.
Which one has the stronger fundamentals?
Kenvue demonstrates stronger fundamentals with favorable margin levels, positive net income growth over the period, and a larger revenue base. Despite recent slowing growth and margin compression, its overall income statement outlook remains positive. Helen of Troy faces consistent revenue and profit declines, with unfavorable margin trends and weaker scale, reflecting more pronounced operational hurdles.
Financial Ratios Comparison
The table below presents key financial ratios for Kenvue Inc. and Helen of Troy Limited, reflecting their latest fiscal year data available for comparison.
| Ratios | Kenvue Inc. (2024) | Helen of Troy Limited (2025) |
|---|---|---|
| ROE | 10.65% | 7.35% |
| ROIC | 6.25% | 5.32% |
| P/E | 39.38 | 10.25 |
| P/B | 4.20 | 0.75 |
| Current Ratio | 0.96 | 2.00 |
| Quick Ratio | 0.69 | 1.03 |
| D/E (Debt to Equity) | 0.90 | 0.57 |
| Debt-to-Assets | 34.06% | 30.74% |
| Interest Coverage | 4.27 | 2.75 |
| Asset Turnover | 0.60 | 0.61 |
| Fixed Asset Turnover | 8.36 | 5.23 |
| Payout Ratio | 150.68% | 0% |
| Dividend Yield | 3.83% | 0% |
Interpretation of the Ratios
Kenvue Inc.
Kenvue shows a mixed ratio profile with strengths in fixed asset turnover (8.36, favorable) and dividend yield (3.83%, favorable), but weaknesses in valuation metrics like P/E (39.38, unfavorable) and P/B (4.2, unfavorable). Liquidity ratios are also low (current ratio 0.96, unfavorable). The payout ratio supports a stable dividend with a favorable yield, but coverage by free cash flow is a concern given negative free cash flow to equity.
Helen of Troy Limited
Helen of Troy presents generally favorable liquidity and valuation ratios, including a strong current ratio of 2.0 and P/E of 10.25, both favorable. However, its ROE is modest at 7.35% and rated unfavorable. The company does not pay dividends, likely focusing on reinvestment and growth. This is consistent with its moderate free cash flow and a slight emphasis on R&D and operating efficiency.
Which one has the best ratios?
Helen of Troy has a stronger overall ratio profile, with 42.86% favorable ratios and fewer unfavorable marks, especially in liquidity and valuation. Kenvue’s profile is more mixed, with a slightly unfavorable global opinion due to weaker liquidity and high valuation multiples. Thus, Helen of Troy appears to have the more balanced and favorable financial ratios.
Strategic Positioning
This section compares the strategic positioning of Kenvue Inc. and Helen of Troy Limited, focusing on market position, key segments, and exposure to technological disruption:
Kenvue Inc.
- Market leader in consumer health with strong brand portfolio and relatively low competitive pressure due to scale.
- Operates in three key segments: Self Care, Skin Health and Beauty, and Essential Health, driving diversified revenues.
- Limited exposure to technological disruption, primarily relying on established consumer health and personal care products.
Helen of Troy Limited
- Smaller market cap with niche presence in consumer products, facing moderate competitive pressure in diversified segments.
- Focused on Home & Outdoor, Health & Wellness, and Beauty, with a concentration on specialized consumer product categories.
- Also low exposure to tech disruption, focusing on traditional consumer goods across multiple health and home segments.
Kenvue Inc. vs Helen of Troy Limited Positioning
Kenvue shows a diversified approach with three broad health-related segments and strong brand recognition, providing scale advantages. Helen of Troy is more concentrated in consumer and home products, which may limit scale but allows focused market niches. Both face limited technological disruption risks.
Which has the best competitive advantage?
Kenvue exhibits a slightly favorable moat with growing profitability, indicating improving competitive advantage. Helen of Troy’s very unfavorable moat and declining profitability suggest a weaker competitive position and eroding value creation.
Stock Comparison
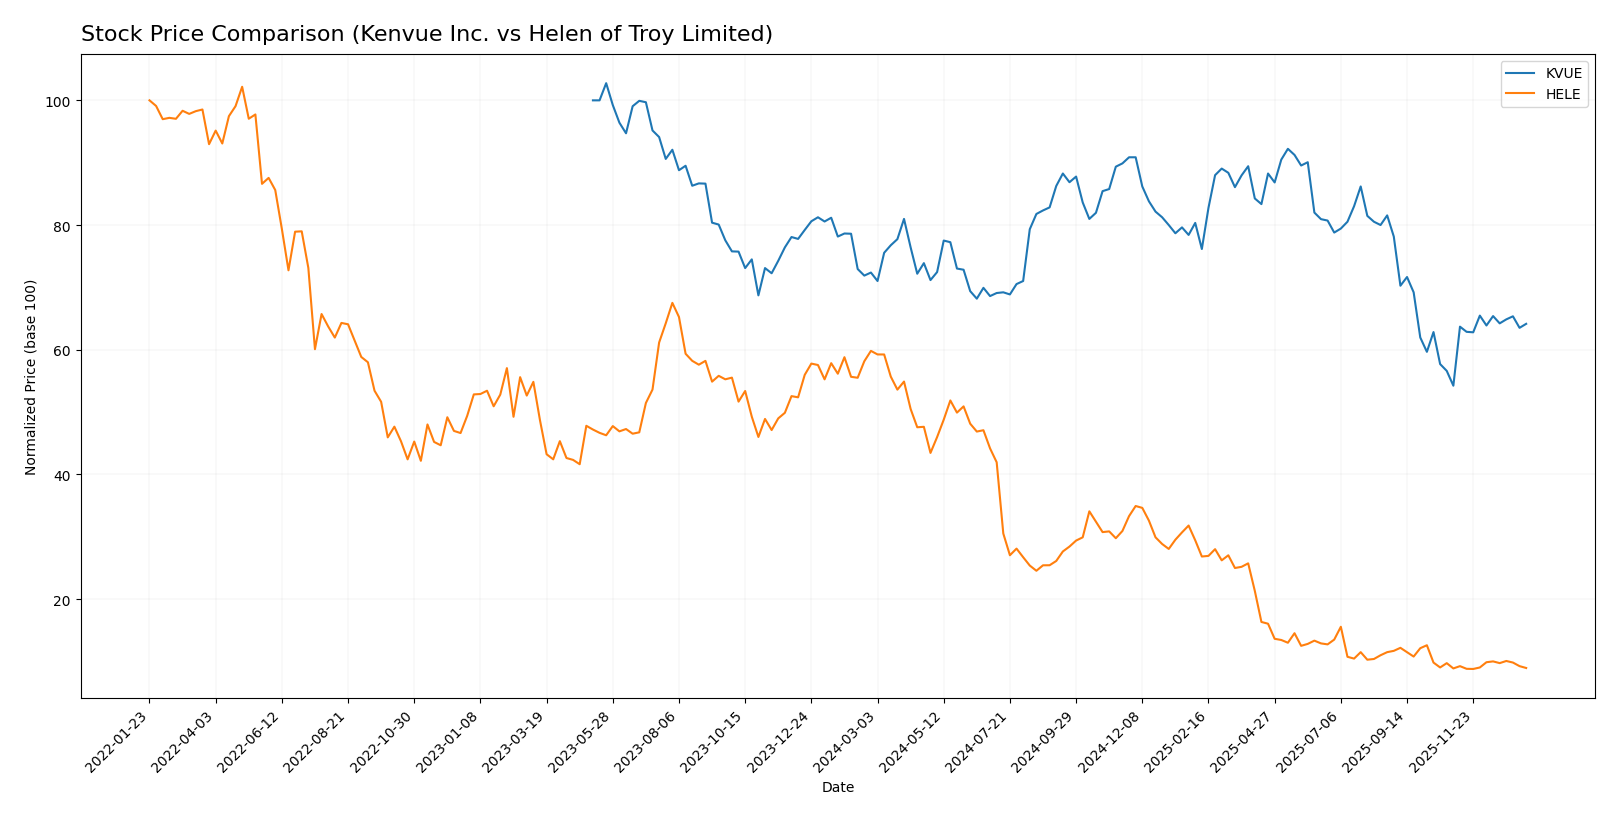
The stock price movements of Kenvue Inc. and Helen of Troy Limited over the past year reveal contrasting bearish trends with differing degrees of decline and recent short-term momentum shifts.
Trend Analysis
Kenvue Inc. experienced an 11.37% price decline over the past year, indicating a bearish trend with accelerating downward momentum and moderate volatility (2.47 std deviation). The recent two-and-a-half-month period shows a bullish reversal with an 18.3% gain.
Helen of Troy Limited faced a steep 85.04% price drop over the past year, reflecting a strong bearish trend with accelerating decline and high volatility (31.1 std deviation). Recent trading shows a near-neutral 0.81% gain with seller dominance.
Comparing both stocks, Kenvue Inc. delivered the highest market performance over the year, with a significantly smaller loss and a more pronounced recent upward trend relative to Helen of Troy Limited.
Target Prices
The current analyst consensus provides clear target price ranges for both Kenvue Inc. and Helen of Troy Limited.
| Company | Target High | Target Low | Consensus |
|---|---|---|---|
| Kenvue Inc. | 23 | 15 | 18.57 |
| Helen of Troy Limited | 22 | 22 | 22 |
Analysts expect Kenvue’s stock to appreciate moderately above its current price of 17 USD, while Helen of Troy’s target suggests a price slightly above its current 18.78 USD, indicating modest upside potential.
Analyst Opinions Comparison
This section compares analysts’ ratings and grades for Kenvue Inc. and Helen of Troy Limited:
Rating Comparison
Kenvue Inc. Rating
- Rating: B+, considered very favorable by analysts.
- Discounted Cash Flow Score: 4, indicating favorable valuation.
- ROE Score: 4, showing favorable efficiency in generating profit.
- ROA Score: 4, reflecting favorable asset utilization.
- Debt To Equity Score: 2, moderate financial risk.
- Overall Score: 3, moderate overall financial standing.
Helen of Troy Limited Rating
- Rating: B, also considered very favorable by analysts.
- Discounted Cash Flow Score: 5, indicating very favorable valuation.
- ROE Score: 1, indicating very unfavorable profit generation.
- ROA Score: 1, reflecting very unfavorable asset utilization.
- Debt To Equity Score: 4, favorable financial stability.
- Overall Score: 3, moderate overall financial standing.
Which one is the best rated?
Based strictly on the provided data, Kenvue holds a higher rating (B+) with stronger ROE and ROA scores, while Helen of Troy scores higher in discounted cash flow and debt-to-equity measures. Overall scores are equal at 3.
Scores Comparison
The following table compares the Altman Z-Score and Piotroski Score for Kenvue Inc. and Helen of Troy Limited:
KVUE Scores
- Altman Z-Score: 1.95, placing KVUE in the grey zone.
- Piotroski Score: 5, indicating average financial strength.
HELE Scores
- Altman Z-Score: 1.10, placing HELE in the distress zone.
- Piotroski Score: 3, indicating very weak financial strength.
Which company has the best scores?
Based on the data, KVUE has a higher Altman Z-Score in the grey zone versus HELE’s distress zone, and a better Piotroski Score indicating stronger financial health. KVUE’s scores are comparatively more favorable.
Grades Comparison
Here is the comparison of recent grades assigned to Kenvue Inc. and Helen of Troy Limited by reputable grading companies:
Kenvue Inc. Grades
The following table shows the recent analyst grades from multiple verified firms for Kenvue Inc.:
| Grading Company | Action | New Grade | Date |
|---|---|---|---|
| Barclays | Maintain | Equal Weight | 2025-11-10 |
| Canaccord Genuity | Downgrade | Hold | 2025-10-29 |
| Jefferies | Maintain | Buy | 2025-10-27 |
| JP Morgan | Maintain | Overweight | 2025-10-10 |
| Citigroup | Maintain | Neutral | 2025-10-09 |
| B of A Securities | Maintain | Buy | 2025-10-08 |
| UBS | Maintain | Neutral | 2025-10-08 |
| Goldman Sachs | Maintain | Neutral | 2025-10-02 |
| Barclays | Maintain | Equal Weight | 2025-10-01 |
| Rothschild & Co | Upgrade | Buy | 2025-09-26 |
Overall, Kenvue’s grades mostly range between Hold/Neutral and Buy, with notable maintenances and a few upgrades, indicating a generally stable to moderately positive outlook.
Helen of Troy Limited Grades
The table below lists recent verified analyst grades for Helen of Troy Limited:
| Grading Company | Action | New Grade | Date |
|---|---|---|---|
| UBS | Maintain | Neutral | 2026-01-09 |
| Canaccord Genuity | Maintain | Hold | 2026-01-09 |
| Canaccord Genuity | Maintain | Hold | 2026-01-06 |
| UBS | Maintain | Neutral | 2025-10-10 |
| Canaccord Genuity | Maintain | Hold | 2025-10-10 |
| UBS | Maintain | Neutral | 2025-10-02 |
| Canaccord Genuity | Downgrade | Hold | 2025-07-11 |
| UBS | Maintain | Neutral | 2025-07-11 |
| Canaccord Genuity | Maintain | Buy | 2025-07-07 |
| Canaccord Genuity | Maintain | Buy | 2025-04-25 |
Helen of Troy’s grades predominantly range between Hold and Neutral, with a few Buy ratings sustained over time, suggesting a generally cautious but stable analyst view.
Which company has the best grades?
Kenvue Inc. has received slightly more Buy and Overweight ratings compared to Helen of Troy Limited’s primarily Hold and Neutral grades. This could reflect a somewhat stronger analyst confidence in Kenvue’s near-term prospects, potentially influencing investor sentiment toward more growth-oriented positioning.
Strengths and Weaknesses
Below is a comparative overview of the key strengths and weaknesses of Kenvue Inc. (KVUE) and Helen of Troy Limited (HELE) based on the most recent data.
| Criterion | Kenvue Inc. (KVUE) | Helen of Troy Limited (HELE) |
|---|---|---|
| Diversification | Broad product segments: Essential Health (4.69B), Self Care (6.53B), Skin Health & Beauty (4.24B) | Concentrated in Beauty & Wellness (1.0B) and Home & Outdoor (0.91B) segments |
| Profitability | Neutral net margin (6.66%), ROIC slightly above WACC (6.25% vs. 5.83%) but shedding value overall; growing ROIC trend | Neutral net margin (6.49%), ROIC at 5.32% below WACC (5.64%), shedding value with declining ROIC |
| Innovation | Moderate innovation indicated by growing ROIC and favorable fixed asset turnover (8.36) | Innovation challenges suggested by declining ROIC and lower fixed asset turnover (5.23) |
| Global presence | Strong global footprint supported by diversified segments and sizable revenues | More niche global presence focused on fewer segments with smaller revenues |
| Market Share | Large market share in self-care and health-related markets | Smaller market share concentrated in beauty and home products |
Key takeaways: Kenvue benefits from strong diversification and improving profitability trends, though it still faces challenges in value creation. Helen of Troy shows stronger financial ratios overall but is suffering from declining profitability and an unfavorable economic moat, signaling caution for investors.
Risk Analysis
Below is a comparison of key risks for Kenvue Inc. (KVUE) and Helen of Troy Limited (HELE) based on the most recent data from 2025-2026.
| Metric | Kenvue Inc. (KVUE) | Helen of Troy Limited (HELE) |
|---|---|---|
| Market Risk | Moderate beta at 0.55, relatively stable market exposure | Slightly higher beta at 0.78, more sensitivity to market fluctuations |
| Debt level | Debt-to-assets 34.1%, moderate leverage, interest coverage 4.28 | Debt-to-assets 30.7%, moderate leverage, interest coverage 4.11 |
| Regulatory Risk | Consumer health products face evolving regulatory scrutiny globally | Diverse consumer products with potential regulatory impact in multiple regions |
| Operational Risk | Large global operations with 22K employees; complexity in product segments | Smaller scale (1.9K employees) but diverse product lines and global footprint |
| Environmental Risk | Industry exposure to sustainability pressures in personal care and health | Exposure to sustainability demands in consumer goods and packaging |
| Geopolitical Risk | US-based but global operations; moderate exposure to geopolitical disruptions | US HQ with broad international sales; moderate geopolitical exposure |
Kenvue’s moderate market risk and solid dividend yield are positives, but its liquidity ratios suggest caution. Helen of Troy shows stronger liquidity and valuation metrics but weaker profitability and financial health scores, including a distress-level Altman Z-score. The most impactful risks for investors include Helen of Troy’s financial distress signals and Kenvue’s slightly unfavorable valuation metrics amid regulatory and sustainability pressures.
Which Stock to Choose?
Kenvue Inc. (KVUE) shows a favorable income statement with strong net margin growth over the period, though recent revenue growth slowed. Its financial ratios are mixed, with some unfavorable liquidity ratios but favorable capital turnover and dividend yield. The company’s debt profile is neutral, and it holds a very favorable B+ rating.
Helen of Troy Limited (HELE) presents an unfavorable income evolution with declining revenue and net income over time. Its financial ratios are slightly favorable overall, supported by strong liquidity and valuation metrics, though profitability ratios are weaker. Debt levels are moderate, and it maintains a very favorable B rating despite some concerns in returns.
For investors prioritizing stability and growing profitability, KVUE might appear more favorable due to its improving income metrics and balanced rating. Conversely, those focused on valuation and liquidity could find HELE’s profile more appealing despite its declining income trend. The choice could therefore depend on whether an investor favors growth or value considerations.
Disclaimer: Investment carries a risk of loss of initial capital. The past performance is not a reliable indicator of future results. Be sure to understand risks before making an investment decision.
Go Further
I encourage you to read the complete analyses of Kenvue Inc. and Helen of Troy Limited to enhance your investment decisions: