In the dynamic world of consumer products, e.l.f. Beauty, Inc. and Helen of Troy Limited stand out as key players in the household and personal products industry. While e.l.f. focuses primarily on cosmetics and skincare with a strong digital presence, Helen of Troy offers a diverse portfolio including beauty, health, and home goods. This article will explore their market strategies and innovations to help you identify which company holds the most promise for your investment portfolio.
Table of contents
Companies Overview
I will begin the comparison between e.l.f. Beauty, Inc. and Helen of Troy Limited by providing an overview of these two companies and their main differences.
e.l.f. Beauty, Inc. Overview
e.l.f. Beauty, Inc. is a cosmetics and skin care company offering products under brands such as e.l.f. Cosmetics and Well People. Founded in 2004 and headquartered in Oakland, California, it operates globally through retailers and direct-to-consumer e-commerce channels. The company focuses on providing affordable beauty products and holds a market cap of approximately 4.9B USD.
Helen of Troy Limited Overview
Helen of Troy Limited, established in 1968 and based in El Paso, Texas, is a diversified consumer products company. It operates across three segments: Home & Outdoor, Health & Wellness, and Beauty, with a broad portfolio including brands like OXO and Hydro Flask. Its products are sold through multiple retail and distribution channels worldwide, with a market cap near 431M USD.
Key similarities and differences
Both companies operate in the consumer defensive sector and target household and personal products markets. e.l.f. focuses exclusively on beauty and skincare products, while Helen of Troy has a more diversified product range spanning home, health, and beauty segments. e.l.f. relies heavily on direct-to-consumer sales and e-commerce, whereas Helen of Troy distributes through various retail and wholesale channels globally.
Income Statement Comparison
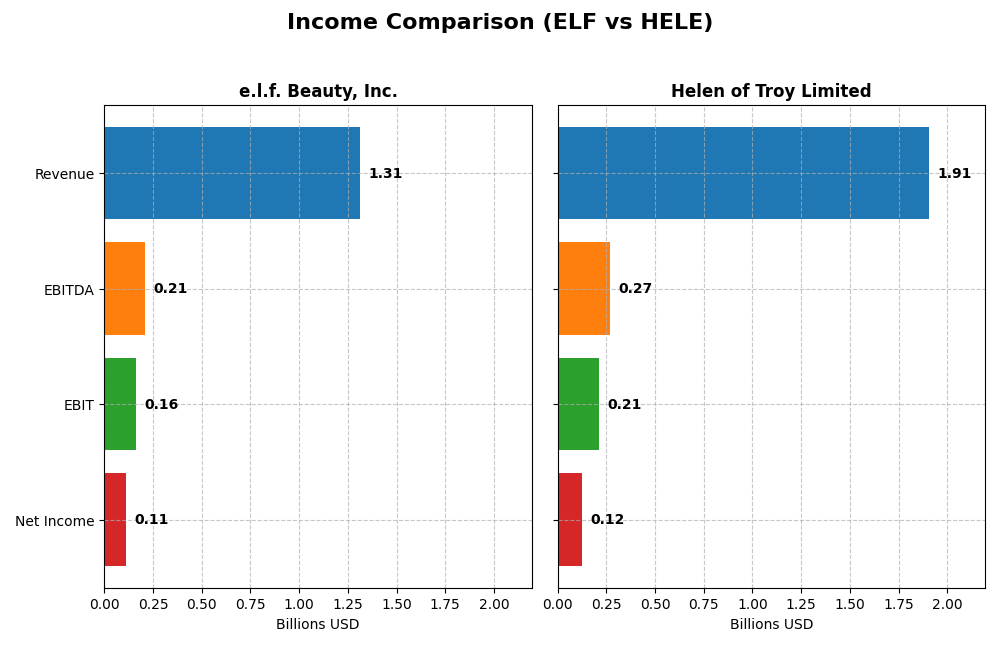
The following table compares the most recent full fiscal year income statement metrics for e.l.f. Beauty, Inc. and Helen of Troy Limited, providing key financial figures for 2025.
| Metric | e.l.f. Beauty, Inc. (ELF) | Helen of Troy Limited (HELE) |
|---|---|---|
| Market Cap | 4.92B | 431M |
| Revenue | 1.31B | 1.91B |
| EBITDA | 206M | 269M |
| EBIT | 162M | 214M |
| Net Income | 112M | 124M |
| EPS | 1.99 | 5.38 |
| Fiscal Year | 2025 | 2025 |
Income Statement Interpretations
e.l.f. Beauty, Inc.
e.l.f. Beauty has shown strong revenue growth from 318M in 2021 to 1.31B in 2025, with net income rising significantly over the period. Margins improved overall, with a gross margin around 71% and a net margin near 8.5% in 2025. The latest year saw robust revenue and gross profit growth, though net margin and EPS declined, reflecting some margin pressure.
Helen of Troy Limited
Helen of Troy’s revenue peaked near 2.22B in 2022 but declined to 1.91B by 2025, with net income also falling from 254M to 124M over the same period. Margins remained stable but lower than e.l.f., with a gross margin near 48% and net margin around 6.5%. The most recent year showed declines in revenue, profitability, and EPS, indicating operational challenges.
Which one has the stronger fundamentals?
e.l.f. Beauty demonstrates stronger fundamentals with favorable trends in revenue, net income growth, and higher margins overall. It maintains good profitability and margin improvements despite some recent EPS softness. Helen of Troy faces headwinds with declining revenues, shrinking net income, and weaker margins, resulting in an unfavorable income statement outlook over the period.
Financial Ratios Comparison
The table below presents the most recent financial ratios for e.l.f. Beauty, Inc. (ELF) and Helen of Troy Limited (HELE) as of fiscal year 2025, facilitating a straightforward comparison of key performance and financial health indicators.
| Ratios | e.l.f. Beauty, Inc. (ELF) | Helen of Troy Limited (HELE) |
|---|---|---|
| ROE | 14.7% | 7.4% |
| ROIC | 11.2% | 5.3% |
| P/E | 31.5 | 10.2 |
| P/B | 4.64 | 0.75 |
| Current Ratio | 3.05 | 2.00 |
| Quick Ratio | 2.00 | 1.03 |
| D/E (Debt to Equity) | 0.41 | 0.57 |
| Debt-to-Assets | 25.1% | 30.7% |
| Interest Coverage | 9.20 | 2.75 |
| Asset Turnover | 1.05 | 0.61 |
| Fixed Asset Turnover | 45.6 | 5.23 |
| Payout Ratio | 0 | 0 |
| Dividend Yield | 0% | 0% |
Interpretation of the Ratios
e.l.f. Beauty, Inc.
e.l.f. Beauty displays a mixed ratio profile with favorable leverage and liquidity ratios such as a debt-to-equity of 0.41 and quick ratio of 2.0, but unfavorable valuation multiples including a PE of 31.49 and PB of 4.64. Return on invested capital at 11.21% is below its weighted average cost of capital at 11.49%, signaling potential efficiency concerns. The company does not pay dividends, likely reflecting reinvestment priorities or growth strategy.
Helen of Troy Limited
Helen of Troy’s ratios show a slightly more favorable stance with attractive valuation multiples (PE 10.25, PB 0.75) and a solid current ratio of 2.0. However, its return on equity at 7.35% is considered unfavorable, and net margin at 6.49% remains neutral. Debt metrics are moderate with neutral debt-to-assets at 30.74%. Like e.l.f. Beauty, Helen of Troy does not pay dividends, suggesting a focus on reinvestment or operational growth.
Which one has the best ratios?
Helen of Troy has a slightly more favorable overall ratio profile due to stronger valuation multiples and liquidity ratios, despite weaker profitability measures. e.l.f. Beauty shows notable strengths in leverage and efficiency but is hindered by higher valuation multiples and a return on capital below cost. Both companies share challenges, resulting in a cautious comparative outlook.
Strategic Positioning
This section compares the strategic positioning of e.l.f. Beauty, Inc. (ELF) and Helen of Troy Limited (HELE), focusing on market position, key segments, and exposure to technological disruption:
e.l.f. Beauty, Inc.
- Medium market cap around 4.9B USD; faces typical competitive pressure in personal products industry.
- Focused on cosmetics and skin care products sold via retailers and direct e-commerce channels.
- No explicit information on technological disruption exposure provided.
Helen of Troy Limited
- Smaller market cap near 431M USD; operates in a competitive consumer products market with diverse brands.
- Operates three segments: Beauty & Wellness, Home & Outdoor, with diverse consumer product brands.
- No explicit information on technological disruption exposure provided.
e.l.f. Beauty, Inc. vs Helen of Troy Limited Positioning
ELF’s strategic approach centers on a concentrated cosmetics and skincare focus, leveraging direct-to-consumer and retail channels. HELE pursues diversification across multiple consumer product segments, offering a broader portfolio but facing complexity in managing varied markets.
Which has the best competitive advantage?
Both companies are currently shedding value relative to their cost of capital. ELF shows growing profitability despite value destruction, rated slightly unfavorable, while HELE faces declining profitability with a very unfavorable moat status.
Stock Comparison
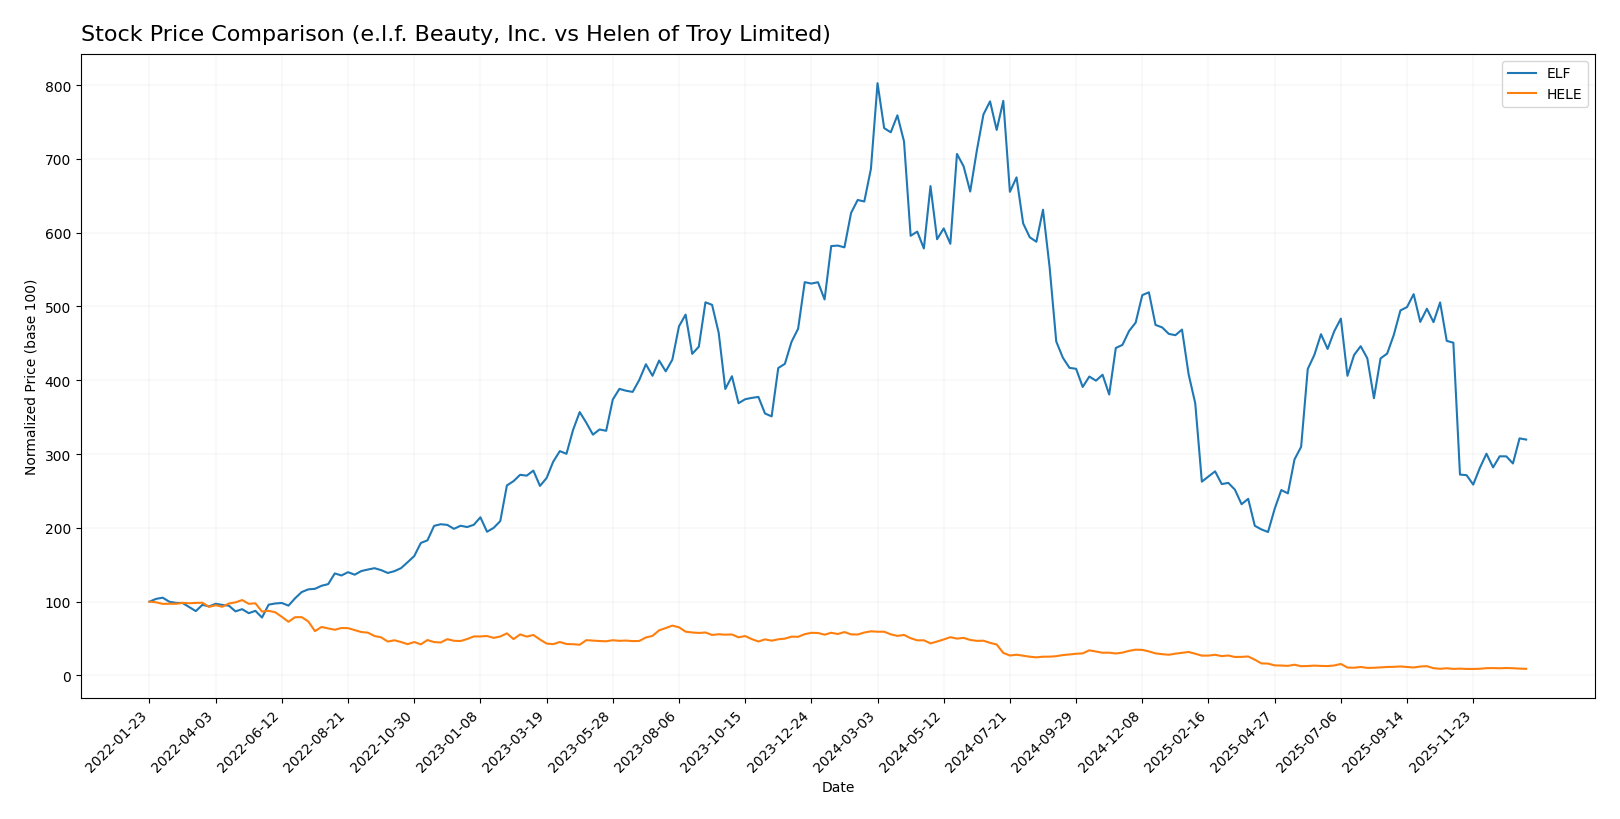
The stock price movements of e.l.f. Beauty, Inc. (ELF) and Helen of Troy Limited (HELE) over the past year reveal significant bearish trends with marked declines and varying recent momentum, reflecting distinct trading dynamics and volatility profiles.
Trend Analysis
e.l.f. Beauty, Inc. (ELF) experienced a pronounced bearish trend with a -53.44% price decline over the past 12 months, accelerating downward with high volatility (43.02 std deviation) and a recent loss of -29.11%.
Helen of Troy Limited (HELE) also faced a steep bearish trend, falling -85.04% over the same period, with accelerating decline and moderate volatility (31.1 std deviation); recently, it showed a slight positive change of +0.81%.
Comparing both, ELF outperformed HELE in market performance despite both showing bearish trends; ELF’s loss was less severe, while HELE posted the larger overall decline.
Target Prices
The current analyst consensus for target prices shows a positive outlook for e.l.f. Beauty, Inc. and a stable view for Helen of Troy Limited.
| Company | Target High | Target Low | Consensus |
|---|---|---|---|
| e.l.f. Beauty, Inc. | 165 | 85 | 128.17 |
| Helen of Troy Limited | 22 | 22 | 22 |
Analysts expect e.l.f. Beauty’s stock to appreciate significantly from its current price of $86.58, while Helen of Troy’s target price of $22 suggests limited upside from its current $18.78.
Analyst Opinions Comparison
This section compares analysts’ ratings and financial scores for e.l.f. Beauty, Inc. and Helen of Troy Limited:
Rating Comparison
ELF Rating
- Rating: C+ reflecting a very favorable overall evaluation.
- Discounted Cash Flow Score: Moderate at 3, indicating average valuation.
- ROE Score: Moderate at 3, indicating average efficiency in equity use.
- ROA Score: Moderate at 3, showing average asset utilization efficiency.
- Debt To Equity Score: Moderate at 2, suggesting average financial risk.
- Overall Score: Moderate at 2, reflecting average financial standing.
HELE Rating
- Rating: B with a very favorable overall evaluation.
- Discounted Cash Flow Score: Very favorable at 5, showing strong valuation.
- ROE Score: Very unfavorable at 1, reflecting weak profit generation from equity.
- ROA Score: Very unfavorable at 1, indicating poor asset usage.
- Debt To Equity Score: Favorable at 4, indicating stronger balance sheet.
- Overall Score: Moderate at 3, indicating slightly better financial standing.
Which one is the best rated?
Helen of Troy Limited holds a higher overall rating (B) and excels in discounted cash flow and debt-to-equity scores, while e.l.f. Beauty shows moderate scores in profitability metrics. Based strictly on provided data, HELE is better rated overall.
Scores Comparison
The comparison of scores between e.l.f. Beauty, Inc. (ELF) and Helen of Troy Limited (HELE) is as follows:
ELF Scores
- Altman Z-Score: 3.44, indicating a safe zone from bankruptcy.
- Piotroski Score: 5, reflecting average financial strength.
HELE Scores
- Altman Z-Score: 1.10, indicating distress zone and high risk.
- Piotroski Score: 3, reflecting very weak financial strength.
Which company has the best scores?
Based strictly on the provided data, ELF shows stronger financial health with a safe zone Altman Z-Score and average Piotroski Score. HELE’s scores indicate higher bankruptcy risk and weaker financial strength.
Grades Comparison
The following presents a detailed comparison of recent grades assigned to e.l.f. Beauty, Inc. and Helen of Troy Limited by established grading companies:
e.l.f. Beauty, Inc. Grades
This table summarizes recent grades from reputable financial institutions for e.l.f. Beauty, Inc.:
| Grading Company | Action | New Grade | Date |
|---|---|---|---|
| Piper Sandler | Maintain | Neutral | 2025-12-22 |
| JP Morgan | Maintain | Overweight | 2025-12-18 |
| Goldman Sachs | Maintain | Buy | 2025-11-07 |
| Baird | Maintain | Outperform | 2025-11-06 |
| Jefferies | Maintain | Buy | 2025-11-06 |
| Piper Sandler | Downgrade | Neutral | 2025-11-06 |
| UBS | Maintain | Neutral | 2025-11-06 |
| Canaccord Genuity | Maintain | Buy | 2025-11-06 |
| JP Morgan | Maintain | Overweight | 2025-11-06 |
| Jefferies | Maintain | Buy | 2025-10-28 |
Overall, e.l.f. Beauty, Inc. demonstrates a predominantly positive grading trend with multiple buy and outperform ratings, alongside a few neutral assessments.
Helen of Troy Limited Grades
Below is a summary of recent grades from credible grading companies for Helen of Troy Limited:
| Grading Company | Action | New Grade | Date |
|---|---|---|---|
| UBS | Maintain | Neutral | 2026-01-09 |
| Canaccord Genuity | Maintain | Hold | 2026-01-09 |
| Canaccord Genuity | Maintain | Hold | 2026-01-06 |
| UBS | Maintain | Neutral | 2025-10-10 |
| Canaccord Genuity | Maintain | Hold | 2025-10-10 |
| UBS | Maintain | Neutral | 2025-10-02 |
| Canaccord Genuity | Downgrade | Hold | 2025-07-11 |
| UBS | Maintain | Neutral | 2025-07-11 |
| Canaccord Genuity | Maintain | Buy | 2025-07-07 |
| Canaccord Genuity | Maintain | Buy | 2025-04-25 |
Helen of Troy Limited shows a consistent neutral to hold rating stance, with fewer buy ratings and no upgrades recently.
Which company has the best grades?
e.l.f. Beauty, Inc. has received more buy and outperform ratings compared to Helen of Troy Limited, whose grades tend to cluster around hold and neutral. This suggests a stronger positive sentiment toward e.l.f. Beauty, potentially influencing investor confidence differently for each company.
Strengths and Weaknesses
Below is a comparative overview of the strengths and weaknesses of e.l.f. Beauty, Inc. (ELF) and Helen of Troy Limited (HELE) based on their recent financial and operational metrics.
| Criterion | e.l.f. Beauty, Inc. (ELF) | Helen of Troy Limited (HELE) |
|---|---|---|
| Diversification | Focused primarily on beauty products, limited product line diversification | Broad product portfolio across Beauty & Wellness and Home & Outdoor segments |
| Profitability | Neutral net margin (8.53%) and ROE (14.73%), but slightly unfavorable ROIC (11.21%) below WACC (11.49%) | Moderate net margin (6.49%) with lower ROE (7.35%) but ROIC (5.32%) slightly below WACC (5.64%) |
| Innovation | Growing ROIC trend indicates improving profitability and potential innovation efforts | Declining ROIC trend suggests challenges in sustaining innovation and profitability |
| Global presence | Limited data suggests less global diversification | Stronger global reach with multiple product categories and steady revenue streams |
| Market Share | Higher valuation multiples (PE 31.49, PB 4.64) may imply market confidence but risk of overvaluation | Lower valuation multiples (PE 10.25, PB 0.75) indicate more conservative market positioning |
Key takeaways: ELF shows improving profitability despite shedding value, signaling potential growth through innovation but with risks due to valuation and capital efficiency. HELE offers broader diversification and a more stable market position but faces declining profitability and value destruction risks. Investors should weigh growth potential against financial stability and risk tolerance.
Risk Analysis
Below is a comparison of key risk factors for e.l.f. Beauty, Inc. (ELF) and Helen of Troy Limited (HELE) based on the most recent data from 2025.
| Metric | e.l.f. Beauty, Inc. (ELF) | Helen of Troy Limited (HELE) |
|---|---|---|
| Market Risk | High beta (1.72) indicates higher volatility and sensitivity to market swings. | Moderate beta (0.78) suggests lower market volatility risk. |
| Debt Level | Moderate debt-to-equity of 0.41, favorable interest coverage (9.44), manageable leverage. | Higher debt-to-equity at 0.57, moderate interest coverage (4.11), slightly higher leverage risk. |
| Regulatory Risk | Standard consumer products regulations; risks tied to ingredient compliance and international distribution. | Similar regulatory environment with additional risks from diverse product lines and global markets. |
| Operational Risk | Relatively small workforce (633 employees), potential scale limitations and supply chain dependencies. | Larger workforce (1883 employees) with diversified product segments, possibly complex operations but greater scale. |
| Environmental Risk | Moderate exposure due to cosmetics packaging and sourcing; increasing consumer focus on sustainability. | Broader product range including home and wellness products increases environmental footprint and scrutiny. |
| Geopolitical Risk | US-based with international distribution; moderate exposure to trade tensions and tariffs. | More global exposure across multiple regions, higher geopolitical risk from international markets. |
In synthesis, e.l.f. Beauty’s most impactful risk is its higher market volatility, while Helen of Troy faces significant financial distress signals, as indicated by its low Altman Z-score and weak Piotroski score, along with elevated leverage and geopolitical exposure. Investors should weigh ELF’s market sensitivity against HELE’s financial stability concerns when managing risk.
Which Stock to Choose?
e.l.f. Beauty, Inc. (ELF) shows a favorable income statement with strong revenue growth at 28.28% over one year and 313% over five years, though recent net margin and EPS growth are negative. Its financial ratios are balanced with a neutral global rating, supported by moderate profitability and manageable debt, but an unfavorable ROIC compared to WACC indicates slight value destruction despite improving returns.
Helen of Troy Limited (HELE) exhibits an unfavorable income trend with declining revenue and net income over the past five years and a negative one-year performance. The company has a slightly favorable financial ratios profile, with strengths in valuation multiples and liquidity, but weaker profitability and a very unfavorable MOAT assessment reflecting value erosion and declining ROIC.
Considering ratings and the overall financial evaluations, ELF might appear more suitable for investors seeking growth potential due to its improving profitability and stronger income trends, while HELE could be interpreted as a more cautious option given its valuation appeal and liquidity despite deteriorating profitability. Risk-tolerant investors focused on growth may find ELF’s profile more compelling, whereas risk-averse investors prioritizing stability might lean toward HELE’s slightly favorable ratios.
Disclaimer: Investment carries a risk of loss of initial capital. The past performance is not a reliable indicator of future results. Be sure to understand risks before making an investment decision.
Go Further
I encourage you to read the complete analyses of e.l.f. Beauty, Inc. and Helen of Troy Limited to enhance your investment decisions: