Home > Comparison > Healthcare > HCA vs UHS
The strategic rivalry between HCA Healthcare, Inc. and Universal Health Services, Inc. shapes the healthcare services landscape. HCA operates a vast network of general and acute care hospitals, emphasizing scale and breadth. In contrast, UHS focuses on a diversified mix of acute and behavioral health facilities, blending specialty care with management services. This analysis will assess which company offers a superior risk-adjusted return, balancing growth potential and operational resilience for a diversified portfolio.

Table of contents
Companies Overview
HCA Healthcare, Inc. and Universal Health Services, Inc. both stand as key players in the US healthcare facilities market.
HCA Healthcare, Inc.: Leading Acute and Outpatient Care Provider
HCA dominates with a vast network including 182 hospitals and 148 outpatient centers. Its core revenue stems from inpatient, outpatient, and specialized psychiatric services. In 2021, the company focused on expanding acute care and outpatient facilities across 20 states and England, reinforcing its presence in general and specialized medical services.
Universal Health Services, Inc.: Diverse Acute and Behavioral Health Operator
Universal Health Services operates 363 inpatient and 40 outpatient facilities across 39 states, the UK, and Puerto Rico. Its revenue engine hinges on acute care hospitals and behavioral health services. As of early 2022, its strategic focus lies in diversifying healthcare delivery through integrated hospital and behavioral health segments, alongside management services.
Strategic Collision: Similarities & Divergences
Both companies prioritize acute care hospital services but diverge in scale and scope. HCA emphasizes a broad acute and outpatient care network, while Universal targets behavioral health integration and geographic expansion. Their primary battleground is hospital service delivery in the US. Investment profiles differ: HCA offers scale-driven dominance; Universal presents a niche blend of acute and behavioral health exposure.
Income Statement Comparison
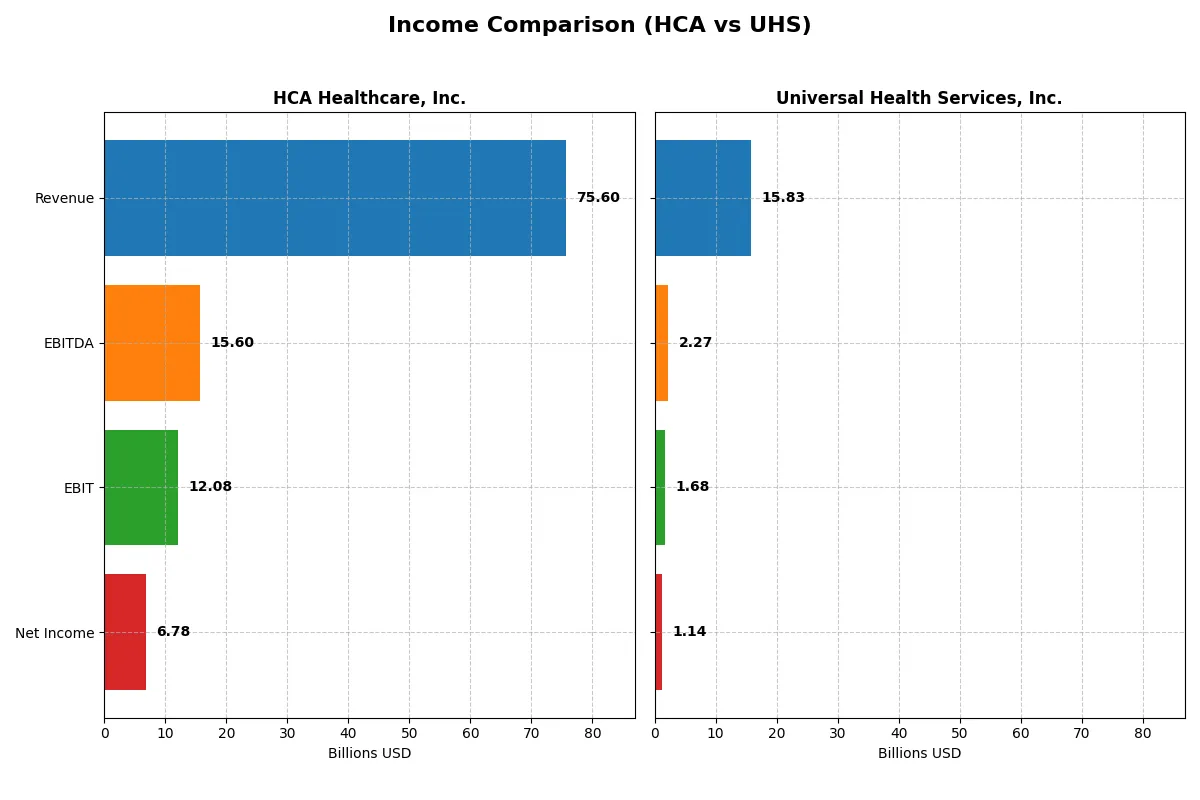
The following data dissects the core profitability and scalability of both corporate engines to reveal who dominates the bottom line:
| Metric | HCA Healthcare, Inc. (HCA) | Universal Health Services, Inc. (UHS) |
|---|---|---|
| Revenue | 75.6B | 15.8B |
| Cost of Revenue | 44.2B | 1.6B |
| Operating Expenses | 19.4B | 12.6B |
| Gross Profit | 31.4B | 14.2B |
| EBITDA | 15.6B | 2.3B |
| EBIT | 12.1B | 1.7B |
| Interest Expense | 2.2B | 187.5M |
| Net Income | 6.8B | 1.1B |
| EPS | 28.62 | 17.16 |
| Fiscal Year | 2025 | 2024 |
Income Statement Analysis: The Bottom-Line Duel
This income statement comparison exposes which company operates its financial engine with superior efficiency and growth momentum.
HCA Healthcare, Inc. Analysis
HCA’s revenue climbed steadily from 59B in 2021 to 75.6B in 2025, showcasing robust top-line expansion. Net income dipped slightly overall but rebounded to 6.78B in 2025. The company sustains healthy gross margins near 41.5% and a net margin approaching 9%, reflecting solid cost control and operational leverage. Recent years reveal accelerating EBIT growth and EPS surging 29%.
Universal Health Services, Inc. Analysis
UHS expanded revenue from 11.6B in 2020 to 15.8B in 2024, with consistent net income growth hitting 1.14B most recently. Its gross margin impressively exceeds 89%, though net margin is lower at 7.2%. UHS’s EBIT and net margin surged sharply last year, with EPS growth above 64%, indicating strong profitability gains despite a somewhat compressed overall net margin trend.
Margin Resilience vs. Growth Velocity
Both companies deliver favorable income statements, yet HCA balances scale and margin strength with steady profit increases. UHS posts faster revenue and EPS growth but at a lower net margin baseline. HCA’s profile suits investors valuing consistent margin health and operating efficiency. UHS appeals to those prioritizing rapid earnings momentum amid margin volatility.
Financial Ratios Comparison
These vital ratios act as a diagnostic tool to expose underlying fiscal health, valuation premiums, and capital efficiency for the companies compared below:
| Ratios | HCA Healthcare, Inc. (HCA) | Universal Health Services, Inc. (UHS) |
|---|---|---|
| ROE | -1.13 | 0.17 |
| ROIC | 18.53% | 10.55% |
| P/E | 15.88 | 10.46 |
| P/B | -17.87 | 1.79 |
| Current Ratio | 0.83 | 1.27 |
| Quick Ratio | 0.73 | 1.17 |
| D/E (Debt-to-Equity) | -8.33 | 0.74 |
| Debt-to-Assets | 82.67% | 34.25% |
| Interest Coverage | 5.32 | 8.97 |
| Asset Turnover | 1.25 | 1.09 |
| Fixed Asset Turnover | 2.43 | 2.26 |
| Payout Ratio | 10.01% | 4.67% |
| Dividend Yield | 0.63% | 0.45% |
| Fiscal Year | 2025 | 2024 |
Efficiency & Valuation Duel: The Vital Signs
Financial ratios serve as a company’s DNA, exposing hidden risks and revealing operational strengths to guide investor decisions.
HCA Healthcare, Inc.
HCA shows a mixed profitability profile with an unfavorable ROE of -112.56% but a favorable ROIC at 18.53%, indicating efficient capital use despite shareholder equity challenges. The stock trades at a neutral P/E of 15.88, suggesting fair valuation. Dividend yield is modest at 0.63%, reflecting limited shareholder returns amid reinvestment needs.
Universal Health Services, Inc.
UHS posts a favorable ROE of 17.13% and decent ROIC of 10.55%, signaling solid profitability and capital efficiency. Its P/E of 10.46 is attractive, marking the stock as reasonably priced. Dividend yield stands at 0.45%, with a focus on steady operational performance rather than aggressive payouts.
Balanced Efficiency vs. Valuation Appeal
UHS offers a better balance of profitability and valuation with fewer red flags and more favorable ratios overall. HCA’s high ROIC is offset by its negative ROE and weaker liquidity, fitting investors who tolerate complexity. UHS suits those seeking steadier returns and valuation safety.
Which one offers the Superior Shareholder Reward?
I compare HCA Healthcare, Inc. (HCA) and Universal Health Services, Inc. (UHS) by their shareholder reward strategies in 2026. HCA yields ~0.63% with a payout ratio near 10%, supported by strong free cash flow coverage (~60%). It maintains a steady dividend and robust buybacks, fueling shareholder value. UHS pays a lower dividend yield (~0.45%) with a modest 4.7% payout ratio but reinvests heavily in growth and buybacks that return ~5x free cash flow coverage. Historically, HCA’s balanced dividend and aggressive buybacks signal disciplined capital allocation, while UHS favors reinvestment over yield. I find HCA’s model more sustainable and attractive for total returns in 2026, given its superior cash flow coverage and consistent shareholder distributions.
Comparative Score Analysis: The Strategic Profile
The radar chart reveals the fundamental DNA and trade-offs of HCA Healthcare, Inc. and Universal Health Services, Inc., highlighting their operational and valuation strengths:
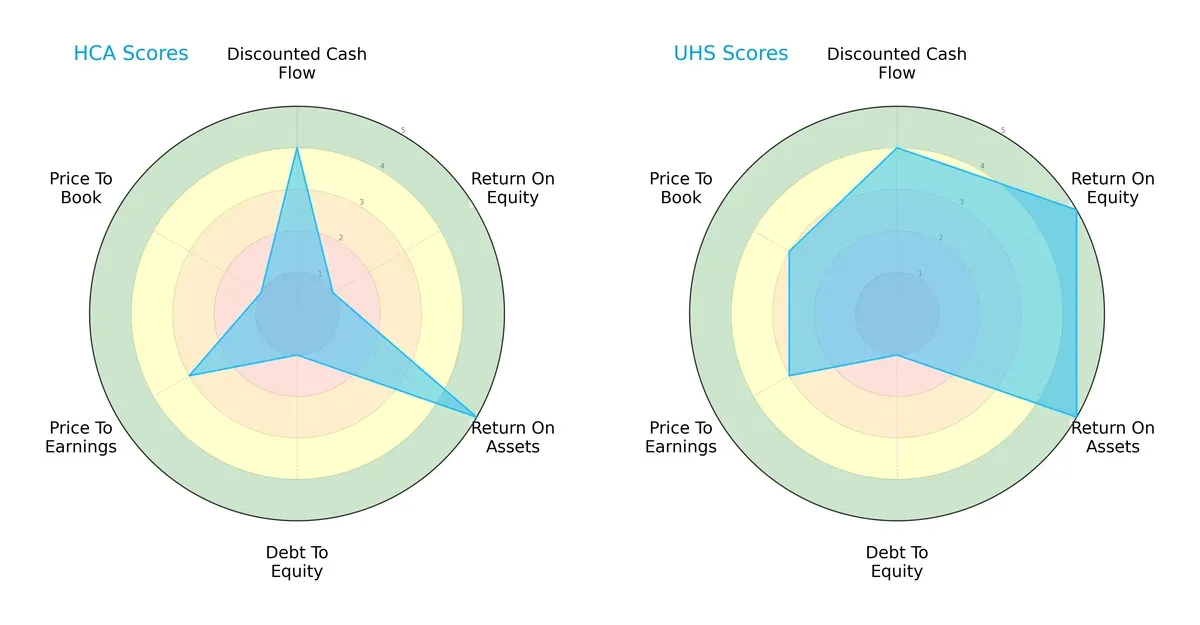
UHS presents a more balanced profile, excelling in return on equity (5 vs. 1) and return on assets (both 5), indicating superior profitability and asset efficiency. Both firms share a favorable discounted cash flow score (4) and moderate price-to-earnings (3), but UHS outperforms on price-to-book (3 vs. 1). HCA’s weakness lies in its debt-to-equity (1) and valuation metrics, suggesting higher financial risk and possible undervaluation. UHS leverages a clear profitability moat, while HCA relies heavily on asset utilization.
Bankruptcy Risk: Solvency Showdown
The Altman Z-Scores place both companies in the grey zone, implying moderate bankruptcy risk in the current cycle:
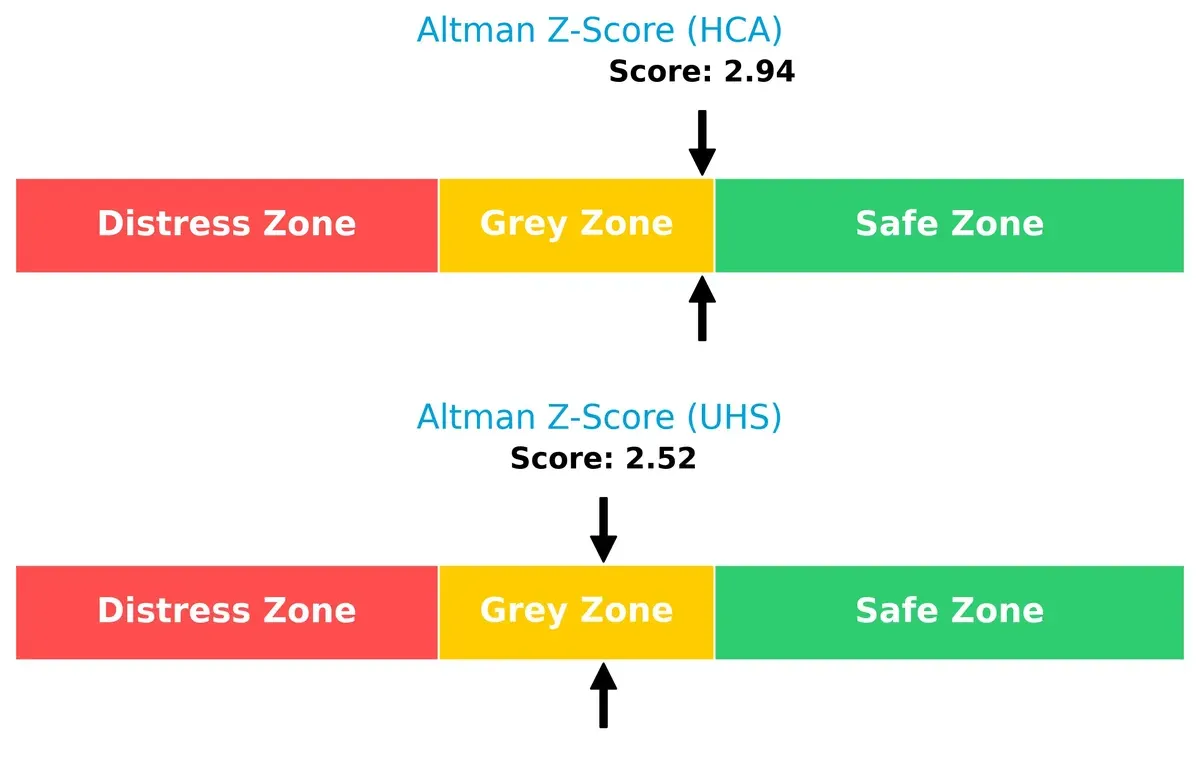
HCA’s Z-Score of 2.94 slightly surpasses UHS’s 2.52, signaling marginally stronger solvency. Neither firm is in the safe zone, so investors should monitor leverage and liquidity closely as economic conditions evolve.
Financial Health: Quality of Operations
Piotroski F-Scores show both companies maintain strong financial health, with UHS slightly ahead:
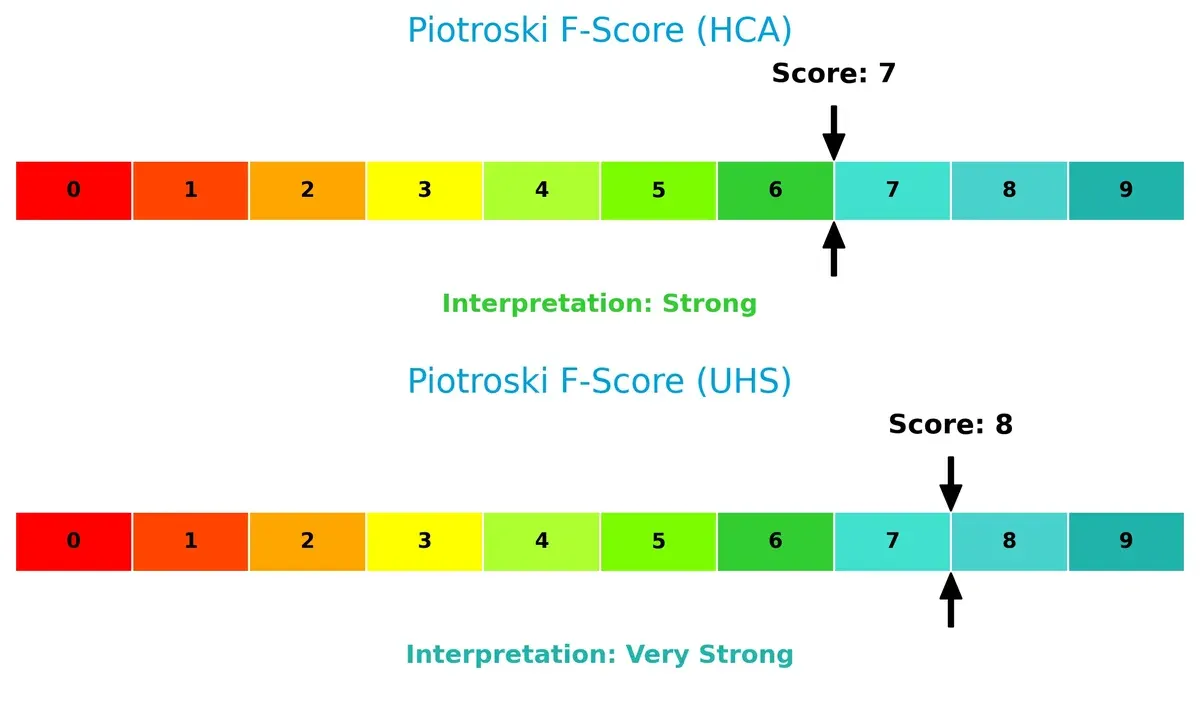
UHS scores an 8, indicating very strong internal metrics across profitability, leverage, and efficiency. HCA’s 7 reflects strong but less robust fundamentals, hinting at minor red flags in operational quality. This difference suggests UHS manages capital allocation and operational risks more effectively.
How are the two companies positioned?
This section dissects the operational DNA of HCA and UHS by comparing revenue distribution and internal dynamics. The goal is to confront their economic moats to identify the more resilient, sustainable competitive advantage.
Revenue Segmentation: The Strategic Mix
This visual comparison dissects how HCA Healthcare and Universal Health Services diversify their income streams and reveals their primary sector bets:
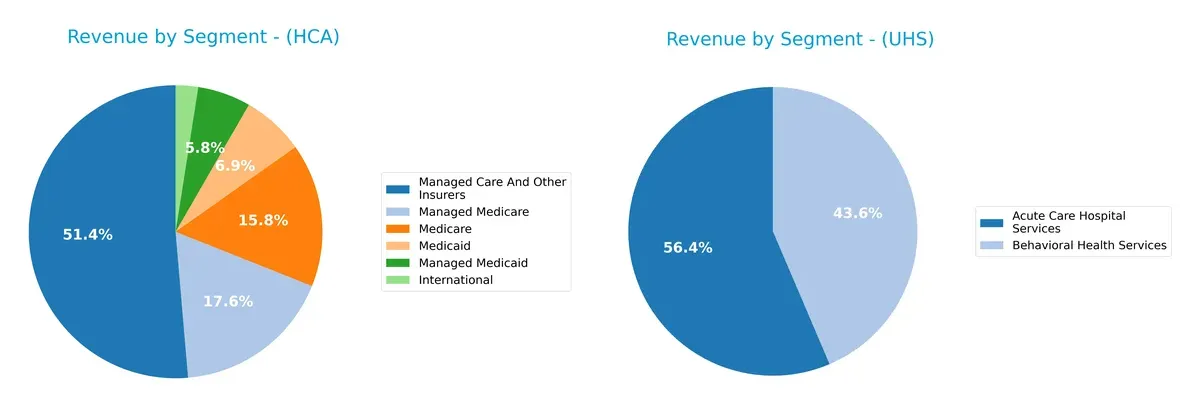
HCA Healthcare anchors its revenue in Managed Care and Other Insurers with $34.95B in 2024, complemented by Medicare and Medicaid segments, showcasing a diversified payer mix. Universal Health Services pivots mainly on Acute Care Hospital Services at $8.92B and Behavioral Health Services at $6.90B, reflecting a more balanced two-segment model. HCA’s broad payer segmentation reduces concentration risk, while UHS’s focus creates operational specialization but exposes it to sector-specific headwinds.
Strengths and Weaknesses Comparison
This table compares the Strengths and Weaknesses of HCA Healthcare, Inc. and Universal Health Services, Inc.:
HCA Strengths
- High ROIC at 18.53% indicating efficient capital use
- Favorable asset turnover at 1.25
- Strong international and diverse revenue streams across multiple payer types
- High interest coverage ratio at 5.37
UHS Strengths
- Positive ROE at 17.13% signaling strong profitability
- Favorable ROIC at 10.55%
- Better liquidity ratios (current 1.27, quick 1.17)
- Higher interest coverage at 8.96
- Solid revenue from both acute care and behavioral health services
HCA Weaknesses
- Negative ROE at -112.56%, signaling shareholder value erosion
- Low current and quick ratios indicating liquidity risks
- High debt-to-assets ratio at 82.67% creating financial leverage concerns
- Unfavorable dividend yield at 0.63%
- Negative PB ratio
UHS Weaknesses
- Lower net margin at 7.22% compared to peers
- Dividend yield slightly unfavorable at 0.45%
- Neutral debt ratios suggest moderate leverage but not a strength
- More concentrated revenue streams mainly in acute care and behavioral health
HCA demonstrates operational efficiency and diverse revenue but faces financial leverage and liquidity risks. UHS shows stronger profitability and liquidity but lacks HCA’s revenue diversification. Each company’s financial profile reflects distinct strategic challenges and focus areas.
The Moat Duel: Analyzing Competitive Defensibility
A structural moat is the only thing protecting long-term profits from the erosion of competition. Let’s compare two healthcare giants’ moats:
HCA Healthcare, Inc.: Scale-Driven Operational Moat
HCA leverages economies of scale in acute care hospitals and outpatient services. Its steady 10.5% ROIC above WACC signals efficient capital use and stable margins. Expansion in outpatient centers in 2026 could deepen its moat but requires vigilance against market saturation.
Universal Health Services, Inc.: Behavioral Health Niche Moat
UHS relies on a focused behavioral health services moat, distinct from HCA’s broader hospital network. Its ROIC growth of 16.3% and strong margin expansion showcase rising capital efficiency. Continued investment in behavioral health facilities promises further moat durability and market penetration.
Scale Efficiency vs. Niche Specialization: The Moat Verdict
UHS exhibits a deeper moat with a sharply growing ROIC trend, reflecting a durable competitive edge in behavioral health. HCA’s broad scale grants solid defensibility but less dynamic capital returns. UHS is better positioned to defend and expand its specialized market share in 2026.
Which stock offers better returns?
Both HCA Healthcare, Inc. and Universal Health Services, Inc. exhibited significant price movements and shifting trading dynamics over the last year, revealing contrasting momentum and market sentiment.
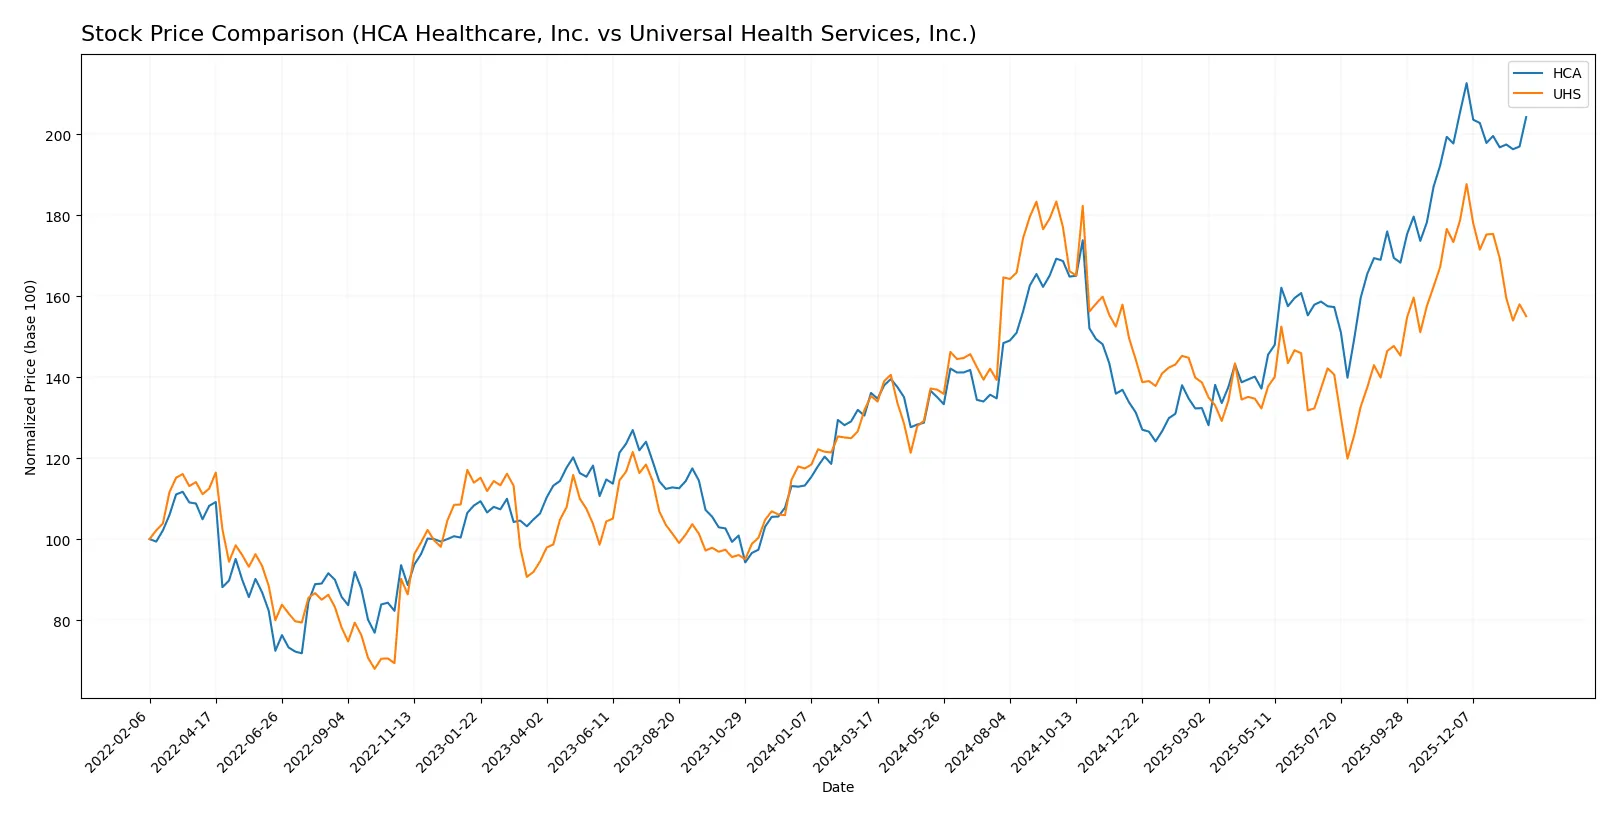
Trend Comparison
HCA Healthcare’s stock rose 50.07% over the past 12 months, showing a bullish trend with decelerating acceleration. The price ranged between 297 and 508, with high volatility (55.59 std dev).
Universal Health Services gained 14.55% over the same period, also bullish but with decelerating momentum. The stock fluctuated between 156 and 244, with moderate volatility (21.24 std dev).
HCA Healthcare outperformed Universal Health Services in market returns, delivering more than three times the price appreciation over the past year.
Target Prices
Analysts present a bullish consensus for both HCA Healthcare, Inc. and Universal Health Services, Inc.
| Company | Target Low | Target High | Consensus |
|---|---|---|---|
| HCA Healthcare, Inc. | 425 | 598 | 516.62 |
| Universal Health Services, Inc. | 203 | 274 | 241.4 |
The target consensus for HCA sits roughly 6% above its current price of 488.27, suggesting moderate upside potential. Universal Health Services’ consensus target exceeds its current 201.26 price by nearly 20%, indicating stronger expected growth.

Don’t Let Luck Decide Your Entry Point
Optimize your entry points with our advanced ProRealTime indicators. You’ll get efficient buy signals with precise price targets for maximum performance. Start outperforming now!
How do institutions grade them?
Here is a comparison of recent institutional grades for HCA Healthcare, Inc. and Universal Health Services, Inc.:
HCA Healthcare, Inc. Grades
The following table summarizes recent grades from reputable financial institutions for HCA Healthcare, Inc.
| Grading Company | Action | New Grade | Date |
|---|---|---|---|
| Wells Fargo | Maintain | Equal Weight | 2026-01-30 |
| Deutsche Bank | Maintain | Buy | 2026-01-28 |
| Keybanc | Maintain | Overweight | 2026-01-28 |
| Oppenheimer | Maintain | Outperform | 2026-01-28 |
| Jefferies | Maintain | Buy | 2026-01-28 |
| Cantor Fitzgerald | Maintain | Overweight | 2026-01-28 |
| Truist Securities | Maintain | Buy | 2026-01-28 |
| RBC Capital | Maintain | Outperform | 2026-01-28 |
| Barclays | Maintain | Overweight | 2026-01-28 |
| UBS | Maintain | Buy | 2026-01-28 |
Universal Health Services, Inc. Grades
The table below presents recent institutional grades for Universal Health Services, Inc. from verified sources.
| Grading Company | Action | New Grade | Date |
|---|---|---|---|
| Barclays | Maintain | Overweight | 2026-01-22 |
| TD Cowen | Maintain | Buy | 2026-01-07 |
| Wells Fargo | Downgrade | Equal Weight | 2026-01-07 |
| Guggenheim | Maintain | Buy | 2025-12-02 |
| Wells Fargo | Maintain | Overweight | 2025-11-13 |
| RBC Capital | Maintain | Sector Perform | 2025-10-30 |
| UBS | Maintain | Buy | 2025-10-29 |
| Cantor Fitzgerald | Maintain | Neutral | 2025-10-29 |
| Guggenheim | Maintain | Buy | 2025-10-29 |
| Barclays | Maintain | Overweight | 2025-10-28 |
Which company has the best grades?
HCA Healthcare, Inc. holds generally stronger and more consistent buy and outperform ratings compared to Universal Health Services, Inc., which includes some downgrades and neutral ratings. This suggests HCA may be viewed as having a more favorable outlook by institutions, potentially influencing investor confidence accordingly.
Risks specific to each company
The following categories identify the critical pressure points and systemic threats facing both firms in the 2026 market environment:
1. Market & Competition
HCA Healthcare, Inc.
- Faces intense competition with a large market cap of $111B but needs to maintain margin amid sector pressure.
Universal Health Services, Inc.
- Smaller market cap of $13B but benefits from diversified behavioral health services in 39 states and abroad.
2. Capital Structure & Debt
HCA Healthcare, Inc.
- High debt-to-assets at 83%, signaling leverage risk despite favorable interest coverage of 5.37x.
Universal Health Services, Inc.
- More conservative leverage with 34% debt-to-assets and stronger interest coverage of 8.96x.
3. Stock Volatility
HCA Healthcare, Inc.
- Beta of 1.37 indicates higher volatility relative to the market, raising risk in turbulent times.
Universal Health Services, Inc.
- Beta of 1.28 suggests slightly lower volatility, offering more stability for investors.
4. Regulatory & Legal
HCA Healthcare, Inc.
- Operates in 20 states plus England, exposing it to diverse and complex healthcare regulations.
Universal Health Services, Inc.
- Broader geographic exposure including UK and Puerto Rico increases regulatory complexity and compliance costs.
5. Supply Chain & Operations
HCA Healthcare, Inc.
- Operates 182 hospitals and multiple outpatient centers, requiring robust supply chain management.
Universal Health Services, Inc.
- Manages 363 inpatient facilities and 40 outpatient centers, which poses operational scale challenges.
6. ESG & Climate Transition
HCA Healthcare, Inc.
- ESG initiatives are critical given large US footprint; risks from climate policies can impact operations.
Universal Health Services, Inc.
- Also faces significant ESG risks, especially in behavioral health, with growing stakeholder scrutiny.
7. Geopolitical Exposure
HCA Healthcare, Inc.
- Limited international exposure reduces geopolitical risk but limits growth avenues.
Universal Health Services, Inc.
- Exposure to UK and Puerto Rico markets adds geopolitical risk but diversifies revenue sources.
Which company shows a better risk-adjusted profile?
UHS presents a better risk-adjusted profile. Its moderate leverage and strong profitability metrics reduce financial risk. HCA’s heavy debt load and high volatility increase vulnerability despite its larger scale. UHS’s diversified geographic presence balances operational risks with regulatory complexity.
Final Verdict: Which stock to choose?
HCA Healthcare’s superpower lies in its ability to generate strong returns on invested capital, signaling efficient capital use and value creation. However, its liquidity constraints pose a point of vigilance. It fits well in an aggressive growth portfolio willing to weather short-term balance sheet risks for long-term gains.
Universal Health Services boasts a durable moat with growing ROIC, reflecting increasing profitability and operational resilience. It offers a safer financial profile with a healthier current ratio and steadier earnings growth, making it suitable for a GARP (Growth at a Reasonable Price) investor seeking stability with upside.
If you prioritize high capital efficiency and are comfortable with balance sheet leverage, HCA outshines with superior ROIC and growth potential. However, if you seek better financial stability and a durable competitive advantage, UHS offers a more balanced risk-reward profile with consistent earnings improvements.
Disclaimer: Investment carries a risk of loss of initial capital. The past performance is not a reliable indicator of future results. Be sure to understand risks before making an investment decision.
Go Further
I encourage you to read the complete analyses of HCA Healthcare, Inc. and Universal Health Services, Inc. to enhance your investment decisions: