Home > Comparison > Energy > HAL vs FTI
The strategic rivalry between Halliburton Company and TechnipFMC plc shapes the landscape of the Energy sector’s Oil & Gas Equipment & Services industry. Halliburton operates as a diversified, capital-intensive services provider with broad global reach, while TechnipFMC focuses on subsea systems and surface technologies with a strong engineering emphasis. This analysis pits their distinct operational models against each other to determine which offers superior risk-adjusted returns for a diversified portfolio seeking exposure to energy infrastructure.
Table of contents
Companies Overview
Halliburton and TechnipFMC stand as pivotal players in the global oil and gas equipment and services industry.
Halliburton Company: Global Energy Services Powerhouse
Halliburton dominates as a provider of oilfield services including drilling, evaluation, and production enhancement. Its revenue flows mainly from Completion and Production and Drilling and Evaluation segments. In 2026, Halliburton sharpened its focus on digital solutions, integrating cloud-based AI to optimize well construction and reservoir management.
TechnipFMC plc: Subsea and Surface Technologies Leader
TechnipFMC specializes in subsea systems and surface technologies for oil and gas production and transportation worldwide. Its core revenue derives from subsea engineering and surface drilling products and services. The company intensified strategic alliances in 2026, advancing Carbon Capture and Storage projects, signaling a pivot toward sustainable energy solutions.
Strategic Collision: Similarities & Divergences
Both companies target the energy sector’s complex equipment and services niche but differ in approach. Halliburton leans on an open digital architecture and broad service portfolio, while TechnipFMC emphasizes integrated subsea systems and surface technology innovation. Their primary battleground is offshore production efficiency. This contrast crafts distinct investment profiles: Halliburton as a broad-service innovator, TechnipFMC as a specialized subsea and sustainable tech player.
Income Statement Comparison
The following data dissects the core profitability and scalability of both corporate engines to reveal who dominates the bottom line:
| Metric | Halliburton Company (HAL) | TechnipFMC plc (FTI) |
|---|---|---|
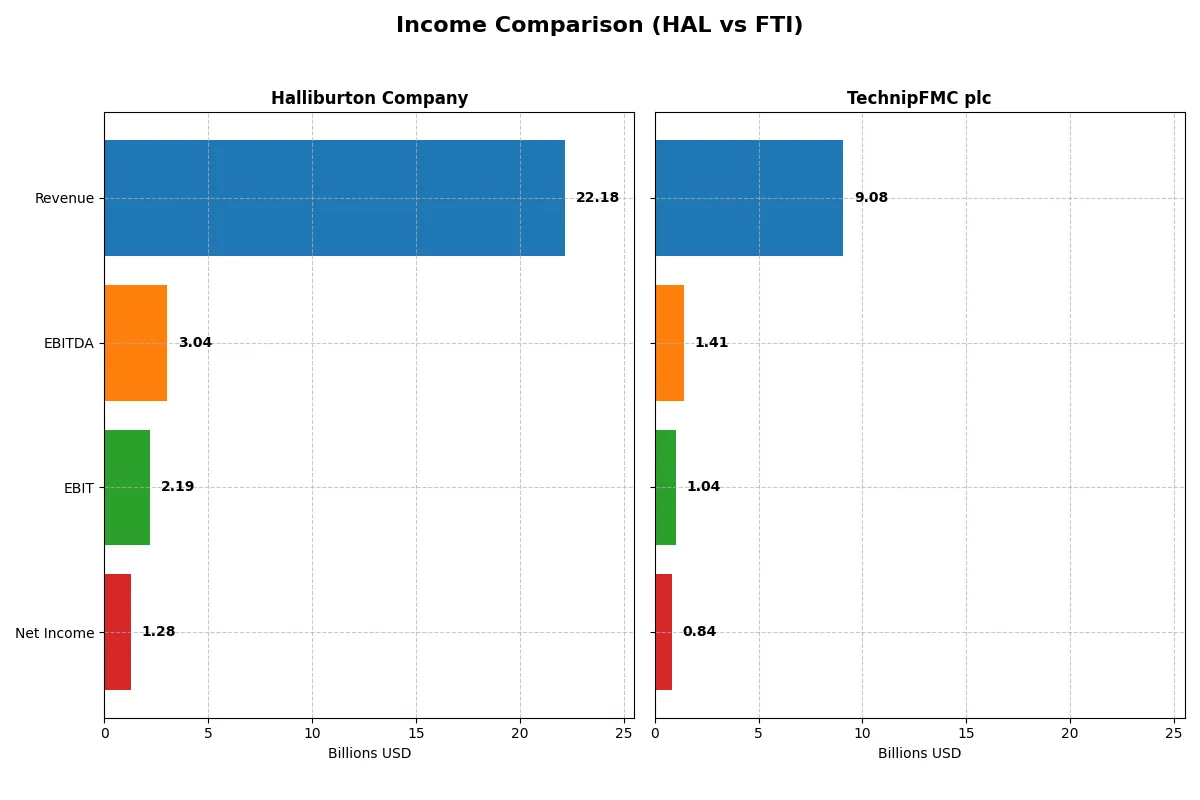
| Revenue | 22.2B | 9.1B |
| Cost of Revenue | 18.7B | 7.4B |
| Operating Expenses | 845M | 741M |
| Gross Profit | 3.5B | 1.7B |
| EBITDA | 3.0B | 1.4B |
| EBIT | 2.2B | 1.0B |
| Interest Expense | 418M | 97M |
| Net Income | 1.3B | 843M |
| EPS | 1.51 | 1.96 |
| Fiscal Year | 2025 | 2024 |
Income Statement Analysis: The Bottom-Line Duel
This income statement comparison reveals which company converts revenue into profit most efficiently, highlighting operational strength and fiscal momentum.
Halliburton Company Analysis
Halliburton’s revenue peaked near 23B in 2023 but declined to 22.2B in 2025. Net income followed suit, sliding from 2.6B to 1.3B, reflecting squeezed profitability. Gross margin weakened to 15.8%, and net margin fell to 5.8%, signaling margin pressure. The latest year shows declining efficiency and shrinking earnings, a red flag amid rising costs.
TechnipFMC plc Analysis
TechnipFMC grew revenue steadily, reaching 9.1B in 2024, a 16% rise year-over-year. Net income surged dramatically to 843M from just 23M the prior year, lifting net margin to 9.3%. Gross margin improved to 18.8%, and EBIT margin expanded to 11.4%, indicating enhanced operational leverage. Momentum is strong, with robust margin recovery and profit growth.
Margin Resilience vs. Earnings Revival
Halliburton generates scale but faces margin contraction and declining profits, undermining its recent efficiency. TechnipFMC, though smaller, delivers superior margin expansion and explosive net income growth. From a fundamental perspective, TechnipFMC’s profile offers a more compelling earnings trajectory, appealing to investors prioritizing profit momentum over size.
Financial Ratios Comparison
These vital ratios act as a diagnostic tool to expose the underlying fiscal health, valuation premiums, and capital efficiency of the companies compared below:
| Ratios | Halliburton Company (HAL) | TechnipFMC plc (FTI) |
|---|---|---|
| ROE | 12.21% | 27.24% |
| ROIC | 9.70% | 16.09% |
| P/E | 18.48 | 14.73 |
| P/B | 2.26 | 4.01 |
| Current Ratio | 2.04 | 1.12 |
| Quick Ratio | 1.51 | 0.88 |
| D/E | 0.84 | 0.58 |
| Debt-to-Assets | 35.37% | 18.15% |
| Interest Coverage | 6.34 | 9.94 |
| Asset Turnover | 0.89 | 0.92 |
| Fixed Asset Turnover | 3.58 | 3.07 |
| Payout ratio | 45.13% | 10.19% |
| Dividend yield | 2.44% | 0.69% |
| Fiscal Year | 2025 | 2024 |
Efficiency & Valuation Duel: The Vital Signs
Financial ratios serve as a company’s DNA, unveiling hidden risks and operational strengths that raw data alone cannot expose.
Halliburton Company
Halliburton exhibits neutral profitability with a 12.21% ROE and a modest 5.78% net margin. Its valuation sits at a neutral 18.48 P/E, reflecting a fairly priced stock. The firm delivers a 2.44% dividend yield, signaling steady shareholder returns, supported by a favorable current ratio and interest coverage, indicating solid liquidity and debt management.
TechnipFMC plc
TechnipFMC outperforms on profitability, boasting a strong 27.24% ROE and 9.28% net margin, while trading at a favorable 14.73 P/E. However, a high 4.01 P/B ratio and low 0.69% dividend yield highlight valuation stretch and limited income returns. The company’s reinvestment appears growth-focused, with favorable ROIC and interest coverage metrics supporting operational efficiency.
Operational Solidity vs. Growth Potential
Halliburton offers balanced risk with steady profitability, reasonable valuation, and consistent dividends. TechnipFMC presents higher returns but carries valuation and dividend yield concerns. Investors seeking stability may prefer Halliburton, while those favoring growth might lean toward TechnipFMC’s aggressive profile.
Which one offers the Superior Shareholder Reward?
I observe that Halliburton (HAL) delivers a more balanced distribution model than TechnipFMC (FTI). HAL pays a consistent dividend yield around 2.4–2.5% with payout ratios near 24–45%, supported by free cash flow coverage above 57%. Its buyback programs complement dividends, enhancing total returns sustainably. FTI’s dividend yield lags at roughly 0.7%, with a low payout ratio near 10%, reflecting a cautious distribution stance. However, FTI’s smaller buyback activity limits shareholder reward intensity. HAL’s robust free cash flow and prudent capital allocation make its shareholder return model more sustainable and attractive in 2026. I favor HAL for superior total return potential.
Comparative Score Analysis: The Strategic Profile
The radar chart reveals the core financial DNA and trade-offs shaping Halliburton and TechnipFMC’s strategies:
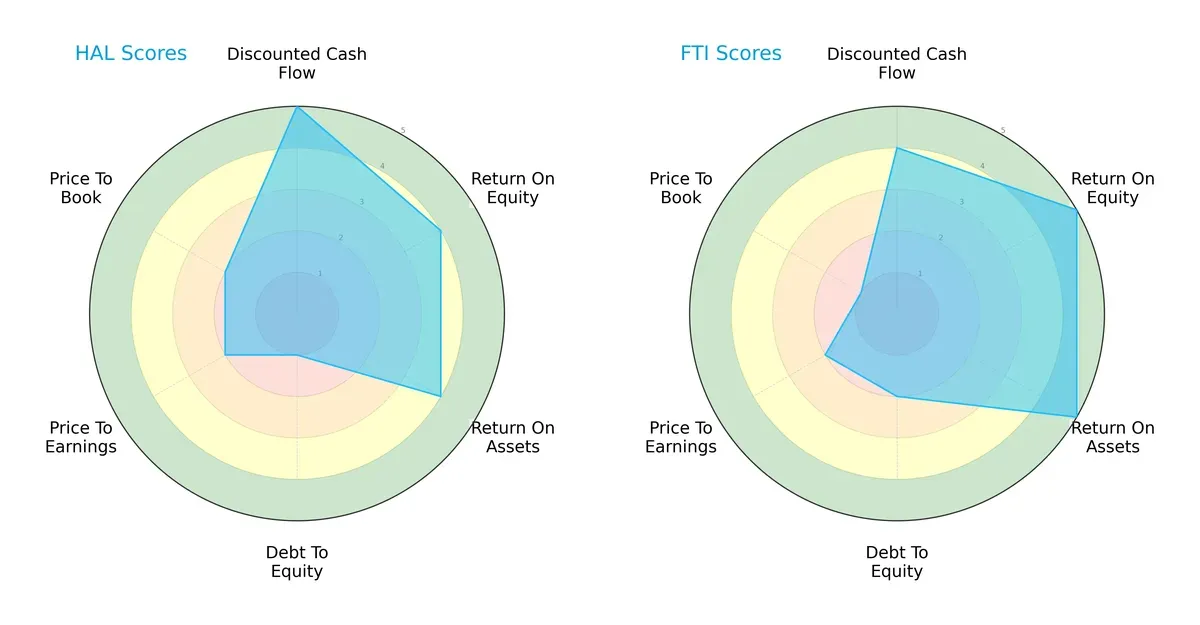
Halliburton leads in discounted cash flow (5 vs. 4), highlighting stronger future cash generation. TechnipFMC excels in return on equity (5 vs. 4) and assets (5 vs. 4), showing operational efficiency. Halliburton’s balance sheet is weaker with a very unfavorable debt-to-equity score (1 vs. 2). Valuation metrics favor neither, both scoring low on P/E and P/B. Overall, TechnipFMC presents a more balanced profile, while Halliburton relies heavily on cash flow strength.
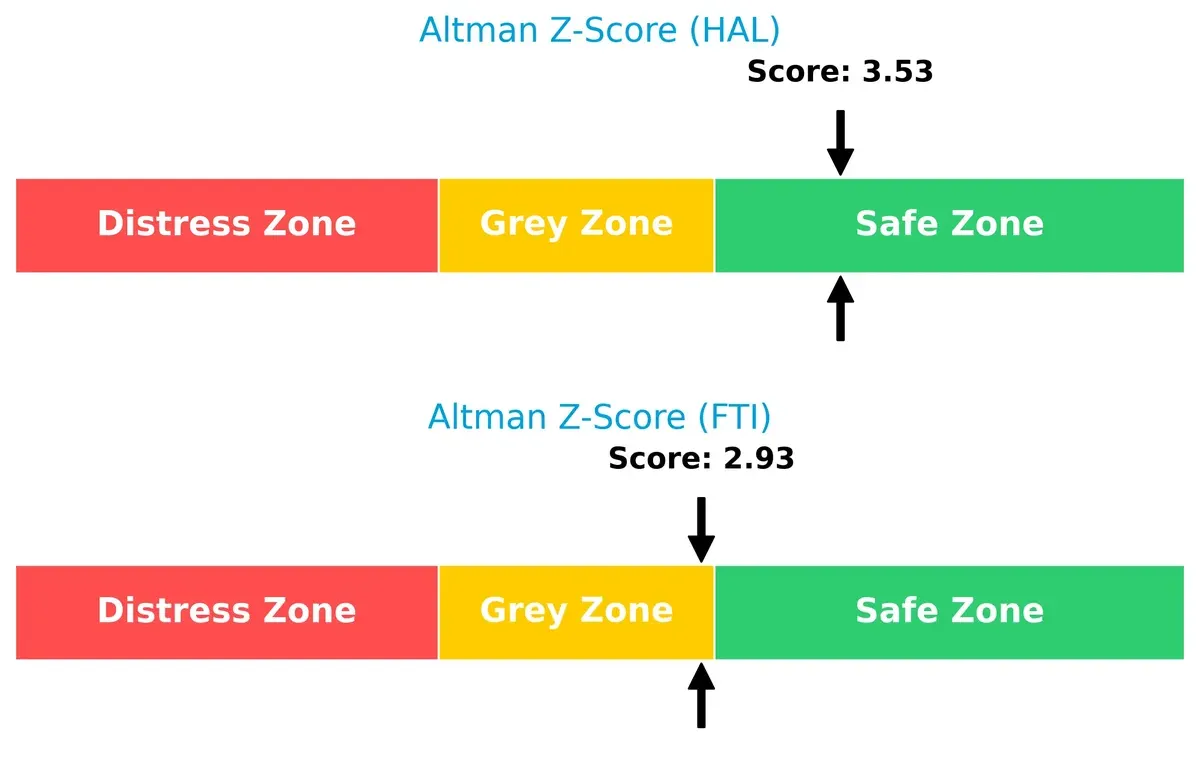
Bankruptcy Risk: Solvency Showdown
Halliburton’s Altman Z-Score of 3.53 places it safely above distress risk, while TechnipFMC’s 2.93 signals moderate caution in this cycle:
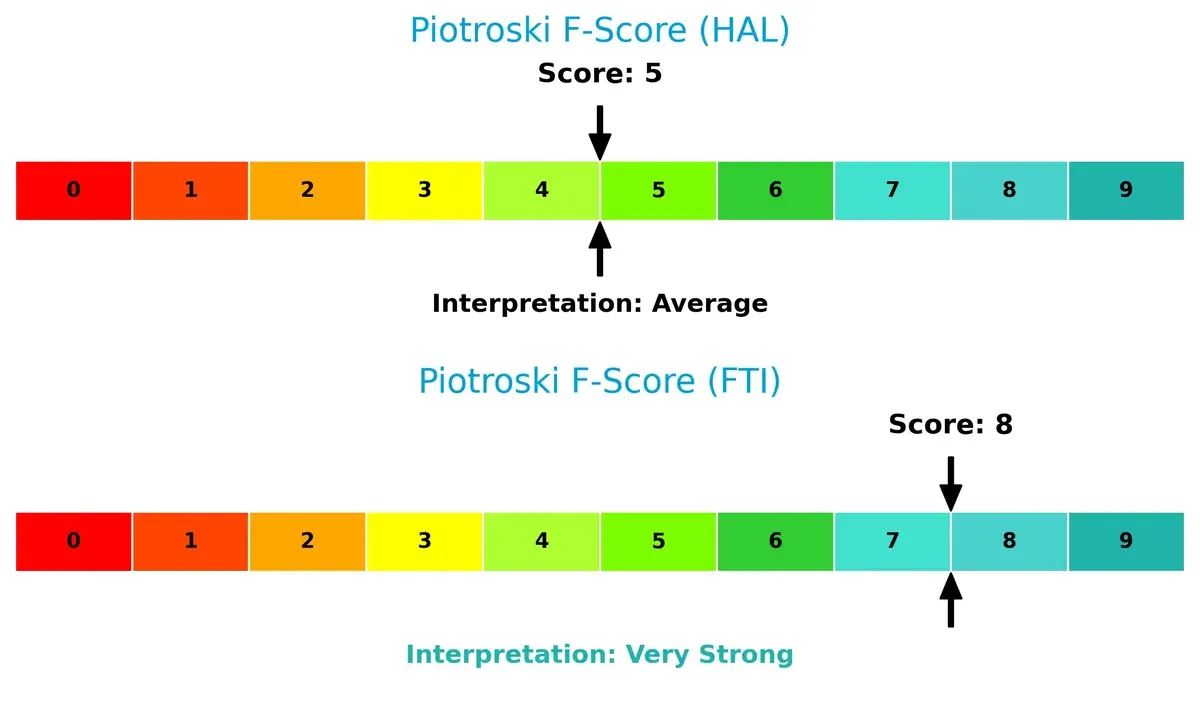
Financial Health: Quality of Operations
TechnipFMC scores an impressive 8 on the Piotroski scale, indicating robust financial health. Halliburton’s 5 flags moderate internal issues compared to its peer:
How are the two companies positioned?
This section dissects Halliburton’s and TechnipFMC’s operational DNA by comparing revenue distribution and internal strengths and weaknesses. The goal is to confront their economic moats to reveal which model offers a more resilient, sustainable competitive edge today.
Revenue Segmentation: The Strategic Mix
This visual comparison dissects how Halliburton Company and TechnipFMC plc diversify their income streams and reveals where their primary sector bets lie:
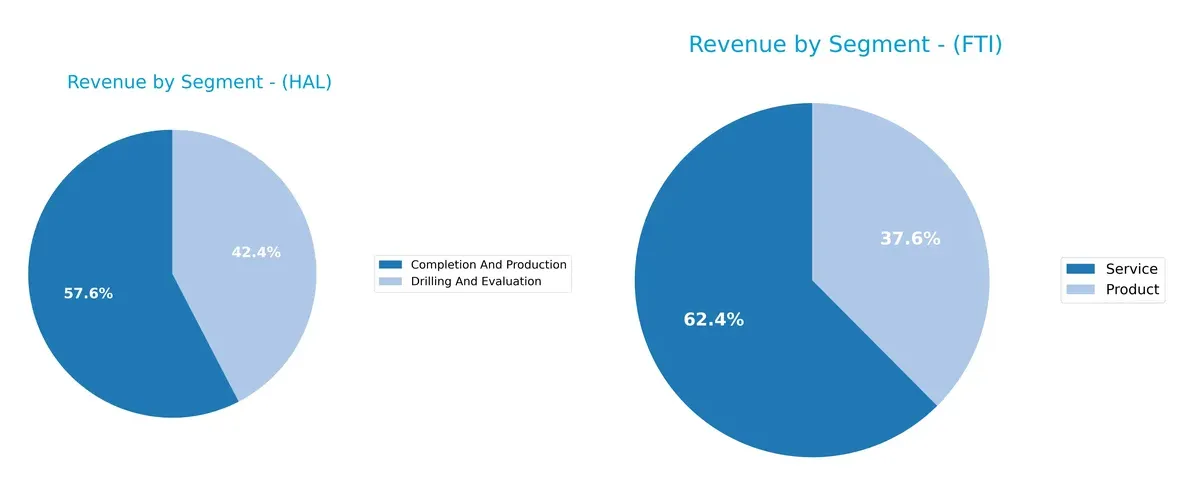
Halliburton anchors its revenue in two dominant segments: Completion And Production at $12.8B and Drilling And Evaluation at $9.4B, showing moderate diversification but heavy reliance on oilfield services. TechnipFMC offers a more diversified mix across Product ($3.3B) and Service ($5.5B) categories, spreading risk across multiple technologies. Halliburton’s concentration suggests ecosystem lock-in, while TechnipFMC’s broader base supports resilience amid shifting energy infrastructure demands.
Strengths and Weaknesses Comparison
This table compares the Strengths and Weaknesses of Halliburton Company and TechnipFMC plc:
Halliburton Company Strengths
- Diversified revenue from Completion, Production, Drilling, and Evaluation segments
- Strong global presence across North America, Middle East/Asia, Europe/Africa/CIS
- Favorable liquidity ratios with current ratio at 2.04 and quick ratio at 1.51
- Favorable WACC at 6.49% supporting capital efficiency
- Dividend yield at 2.44% indicating shareholder returns
- Favorable interest coverage at 5.24 times
TechnipFMC plc Strengths
- Favorable profitability with ROE of 27.24% and ROIC of 16.09%
- Favorable WACC at 6.87% and PE ratio at 14.73 enhancing valuation
- Diversified product and service offerings including Subsea and Surface Technologies
- Global footprint with significant revenue in the United States, Brazil, Norway, and Angola
- Favorable debt to assets ratio at 18.15% indicating lower leverage
- Strong interest coverage at 10.66 times
Halliburton Company Weaknesses
- Neutral profitability metrics with net margin at 5.78% and ROE at 12.21%
- Moderate debt to assets at 35.37% may constrain financial flexibility
- Neutral asset turnover at 0.89, limiting operational efficiency
- Neutral market valuation metrics with PE at 18.48 and PB at 2.26
- Relatively lower ROIC at 9.7% compared to WACC
- Neutral leverage with debt to equity at 0.84
TechnipFMC plc Weaknesses
- Unfavorable PB ratio at 4.01 indicates possible overvaluation
- Dividend yield low at 0.69%, less attractive for income investors
- Neutral liquidity ratios, current ratio only 1.12 and quick ratio 0.88
- Some reliance on fluctuating geographic markets with revenue concentration
- Slight unfavorable global ratios with 14.29% unfavorable metrics
- Moderate asset turnover at 0.92, similar to Halliburton
Halliburton’s strengths lie in diversified segments and solid liquidity, but profitability remains moderate. TechnipFMC boasts superior profitability and lower leverage but faces valuation and dividend yield challenges. Each company’s financial profile suggests different strategic priorities moving forward.
The Moat Duel: Analyzing Competitive Defensibility
A structural moat shields long-term profits from relentless competition and market pressures. Here’s how Halliburton and TechnipFMC compare:
Halliburton Company: Legacy Efficiency with Slight Margin Pressure
Halliburton’s moat stems from its cost advantage and vast global footprint, delivering a positive ROIC vs. WACC by 3.2%. However, declining ROIC signals margin pressure, with recent revenue dips threatening its edge in 2026.
TechnipFMC plc: Innovation-Driven Growth with Expanding Profitability
TechnipFMC leverages intangible assets and digital services, posting a robust 9.2% ROIC premium over WACC. Its rapidly growing ROIC reflects sustainable value creation and strong expansion potential into subsea and carbon capture markets.
Cost Leadership vs. Innovation Powerhouse: Which Moat Holds Stronger?
TechnipFMC’s growing profitability and innovation moat outshine Halliburton’s legacy cost advantages and shrinking returns. I see TechnipFMC as better equipped to defend and expand its market share through technology and service differentiation.
Which stock offers better returns?
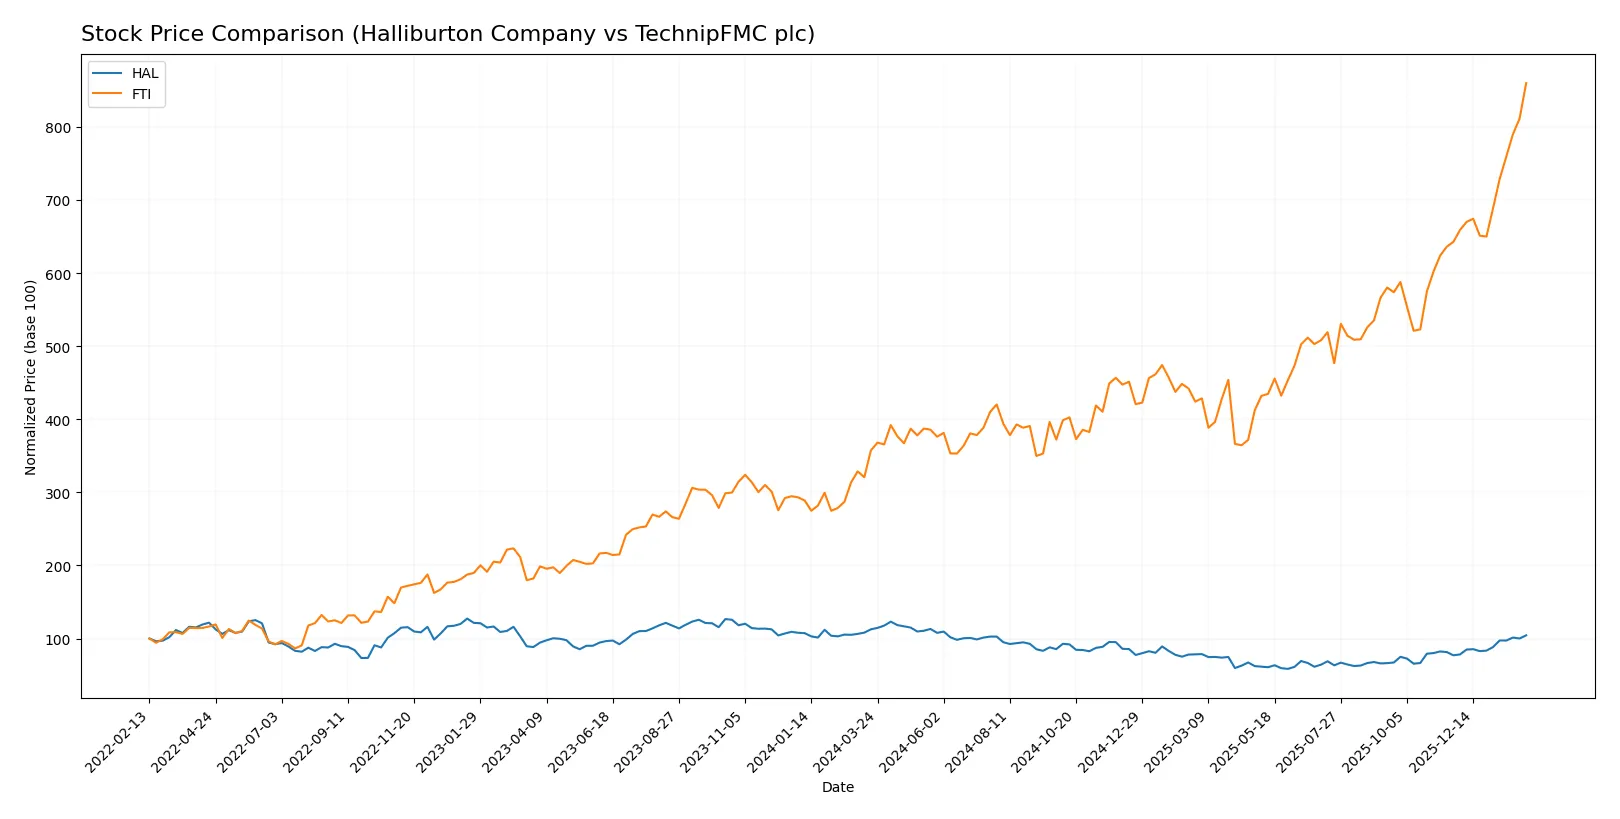
The past year shows stark contrasts: Halliburton’s stock declined steadily while TechnipFMC surged sharply, reflecting divergent investor sentiment and trading dynamics.
Trend Comparison
Halliburton’s stock fell 7.29% over the past year, marking a bearish trend with accelerating decline. It recorded a high of 41.24 and a low of 19.59, with moderate volatility (5.55 std deviation).
TechnipFMC’s stock rose 140.57% over the past year, signaling a bullish trend with accelerating momentum. It hit a high of 59.06 and a low of 24.02, showing higher volatility (7.83 std deviation).
TechnipFMC outperformed Halliburton significantly, delivering the highest market returns and stronger upward momentum throughout the analyzed period.
Target Prices
Analysts show a positive outlook for Halliburton Company and TechnipFMC plc with solid target price ranges.
| Company | Target Low | Target High | Consensus |
|---|---|---|---|
| Halliburton Company | 25 | 40 | 35.23 |
| TechnipFMC plc | 47 | 56 | 49.83 |
Halliburton’s consensus price slightly exceeds its current $34.98 stock price, signaling moderate upside. TechnipFMC’s target consensus at $49.83 contrasts with its $59.06 market price, indicating potential overvaluation or market premium.

Don’t Let Luck Decide Your Entry Point
Optimize your entry points with our advanced ProRealTime indicators. You’ll get efficient buy signals with precise price targets for maximum performance. Start outperforming now!
How do institutions grade them?
Halliburton Company Grades
The following table summarizes the most recent grades from reputable institutions for Halliburton Company.
| Grading Company | Action | New Grade | Date |
|---|---|---|---|
| Citigroup | Maintain | Buy | 2026-01-23 |
| UBS | Maintain | Neutral | 2026-01-23 |
| Goldman Sachs | Maintain | Buy | 2026-01-22 |
| RBC Capital | Maintain | Outperform | 2026-01-22 |
| Stifel | Maintain | Buy | 2026-01-22 |
| Susquehanna | Maintain | Positive | 2026-01-22 |
| Evercore ISI Group | Maintain | In Line | 2026-01-22 |
| JP Morgan | Maintain | Overweight | 2026-01-22 |
| Stifel | Maintain | Buy | 2026-01-21 |
| Piper Sandler | Maintain | Neutral | 2026-01-14 |
TechnipFMC plc Grades
The table below shows recent institutional grades for TechnipFMC plc from verified grading firms.
| Grading Company | Action | New Grade | Date |
|---|---|---|---|
| Susquehanna | Maintain | Positive | 2026-01-07 |
| TD Cowen | Maintain | Buy | 2026-01-07 |
| Piper Sandler | Maintain | Overweight | 2025-12-18 |
| Jefferies | Maintain | Buy | 2025-11-03 |
| Citigroup | Maintain | Buy | 2025-10-29 |
| RBC Capital | Maintain | Outperform | 2025-10-28 |
| Barclays | Maintain | Overweight | 2025-10-27 |
| Piper Sandler | Maintain | Overweight | 2025-10-24 |
| JP Morgan | Maintain | Overweight | 2025-10-02 |
| Barclays | Maintain | Overweight | 2025-07-25 |
Which company has the best grades?
Halliburton receives consistently strong Buy and Outperform ratings, with a few Neutral grades. TechnipFMC holds mostly Buy and Overweight ratings with no Neutrals. Halliburton’s broader mix includes more top-tier scores, potentially signaling stronger institutional confidence.
Risks specific to each company
The following categories identify the critical pressure points and systemic threats facing both firms in the 2026 market environment:
1. Market & Competition
Halliburton Company
- Faces intense rivalry in oilfield services with pressure on margins; mature US market limits growth.
TechnipFMC plc
- Competes globally with advanced subsea and surface tech; higher innovation but exposed to diverse regional demand swings.
2. Capital Structure & Debt
Halliburton Company
- Moderate leverage with debt-to-assets at 35.4%; interest coverage solid at 5.24x, but debt-to-equity score very unfavorable.
TechnipFMC plc
- Lower leverage, debt-to-assets 18.2%; excellent interest coverage 10.66x; better capital structure but price-to-book ratio signals overvaluation risk.
3. Stock Volatility
Halliburton Company
- Beta at 0.75 indicates moderate volatility, relatively stable compared to energy sector.
TechnipFMC plc
- Slightly lower beta 0.73, suggesting marginally less price fluctuation and risk than Halliburton.
4. Regulatory & Legal
Halliburton Company
- US-centric operations face tightening environmental and safety regulations, increasing compliance costs.
TechnipFMC plc
- Global footprint heightens exposure to varied regulatory regimes, including EU climate policies and Middle East operational restrictions.
5. Supply Chain & Operations
Halliburton Company
- Large workforce and complex global operations risk disruption; supply chain complexity managed but vulnerable to raw material price swings.
TechnipFMC plc
- Smaller employee base and focus on subsea tech reduce operational complexity; supply chain risks concentrated in specialized equipment manufacturing.
6. ESG & Climate Transition
Halliburton Company
- Increasing pressure to reduce carbon footprint; transitioning legacy oil services amid rising green energy scrutiny.
TechnipFMC plc
- Active in CCS projects with Talos Energy alliance; better positioned in climate tech but must manage ESG demands across multiple jurisdictions.
7. Geopolitical Exposure
Halliburton Company
- Primarily US-focused, less exposed to geopolitical risk but sensitive to domestic policy shifts.
TechnipFMC plc
- Diverse geographic exposure includes volatile regions (Middle East, Africa), increasing geopolitical and operational risk.
Which company shows a better risk-adjusted profile?
Halliburton’s primary risk is its leveraged US-centric exposure amidst tightening regulations and moderate debt concerns. TechnipFMC faces geopolitical risks and valuation pressures but benefits from stronger capital metrics and climate-tech positioning. I see TechnipFMC as having a slightly better risk-adjusted profile due to its lower leverage, higher ROE, and strategic ESG initiatives, despite its geopolitical complexity. Halliburton’s higher debt-to-equity risk and regulatory challenges justify cautious monitoring.
Final Verdict: Which stock to choose?
Halliburton’s superpower lies in its robust capital efficiency and strong liquidity, making it a reliable value creator despite recently declining profitability. Its point of vigilance is the weakening income growth, which could pressure margins. Halliburton fits portfolios seeking steady cash flow with moderate growth exposure.
TechnipFMC’s strategic moat is its rapidly improving return on invested capital, signaling a sustainable competitive advantage fueled by operational momentum. It offers better earnings growth and a cleaner balance sheet, making it comparatively safer than Halliburton. It suits investors targeting growth at a reasonable price with an appetite for improving fundamentals.
If you prioritize stable cash generation with a margin of safety, Halliburton is the compelling choice due to its solid liquidity and value creation. However, if you seek accelerated growth backed by expanding profitability and a strong moat, TechnipFMC offers better stability and upside potential, though with a higher valuation premium. Both present valid analytical scenarios depending on your risk tolerance and growth horizon.
Disclaimer: Investment carries a risk of loss of initial capital. The past performance is not a reliable indicator of future results. Be sure to understand risks before making an investment decision.
Go Further
I encourage you to read the complete analyses of Halliburton Company and TechnipFMC plc to enhance your investment decisions: