Home > Comparison > Energy > SLB vs HAL
The strategic rivalry between SLB N.V. and Halliburton Company shapes the Energy sector’s future. SLB dominates as a technology-driven giant with a comprehensive global footprint, while Halliburton operates a leaner, service-focused model emphasizing completion and production efficiency. This head-to-head contrasts scale and innovation against agility and specialization. This analysis aims to identify which company offers a superior risk-adjusted profile for a diversified portfolio amid evolving energy demands.
Table of contents
Companies Overview
SLB N.V. and Halliburton Company are pivotal players in the global oilfield services market, shaping energy sector dynamics.
SLB N.V.: Global Energy Technology Leader
SLB dominates the Oil & Gas Equipment & Services sector by providing advanced technology across four divisions: Digital & Integration, Reservoir Performance, Well Construction, and Production Systems. Its core revenue derives from integrated solutions like reservoir interpretation, well construction, and subsea systems. In 2025, SLB sharpened its strategic focus on carbon management and adjacent energy system integration to future-proof its portfolio.
Halliburton Company: Integrated Energy Services Provider
Halliburton operates primarily through Completion and Production, and Drilling and Evaluation segments. It generates revenue via production enhancement services, drilling systems, and cloud-based digital solutions on an open architecture. In 2025, Halliburton emphasized digital transformation and artificial intelligence to optimize well construction and reservoir management, aiming to enhance operational efficiency.
Strategic Collision: Similarities & Divergences
Both companies compete fiercely in oilfield services but diverge in ecosystem approaches—SLB favors a closed, integrated technology stack, while Halliburton pursues open architecture digital services. Their primary battleground lies in advanced drilling and production technologies. SLB offers a broader global footprint and deeper tech integration, whereas Halliburton’s agility in digital innovation defines its distinct investment profile.
Income Statement Comparison
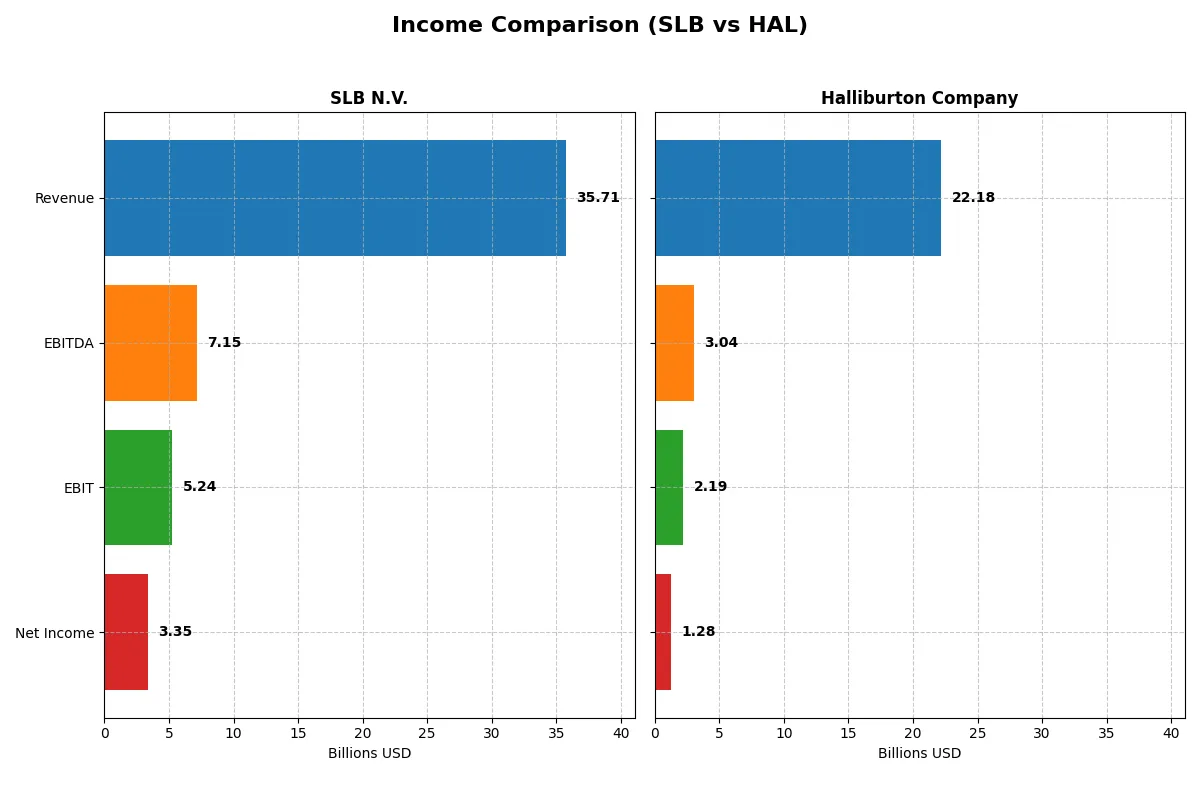
The following data dissects the core profitability and scalability of both corporate engines to reveal who dominates the bottom line:
| Metric | SLB N.V. (SLB) | Halliburton Company (HAL) |
|---|---|---|
| Revenue | 35.7B | 22.2B |
| Cost of Revenue | 29.2B | 18.7B |
| Operating Expenses | 1.05B | 845M |
| Gross Profit | 6.5B | 3.5B |
| EBITDA | 7.15B | 3.04B |
| EBIT | 5.24B | 2.19B |
| Interest Expense | 557M | 418M |
| Net Income | 3.35B | 1.28B |
| EPS | 2.38 | 1.51 |
| Fiscal Year | 2025 | 2025 |
Income Statement Analysis: The Bottom-Line Duel
This income statement comparison reveals which company operates with greater financial efficiency and sustainable profitability.
SLB N.V. Analysis
SLB’s revenue rose from $23B in 2021 to $36B in 2024 before a slight dip to $35.7B in 2025. Net income grew impressively from $1.9B in 2021 to $4.5B in 2024, then retreated to $3.35B in 2025. Its gross margin hovers around 18%, with a healthy net margin near 9.4%, signaling solid profitability despite recent margin contraction.
Halliburton Company Analysis
Halliburton’s revenue expanded from $15.3B in 2021 to $23B in 2023 but declined to $22.2B by 2025. Net income increased from $1.46B in 2021 to $2.64B in 2023, then dropped sharply to $1.28B in 2025. Gross margin averaged roughly 16%, with a net margin at 5.8% in 2025, reflecting weaker margin control and profitability deterioration over time.
Margin Strength vs. Earnings Resilience
SLB outperforms Halliburton on both absolute earnings and margin quality, boasting superior net income growth and higher profitability ratios. Halliburton’s declining earnings and thinner margins highlight operational challenges. For investors prioritizing sustained earnings power, SLB’s profile offers a more attractive blend of scale and margin efficiency.
Financial Ratios Comparison
These vital ratios act as a diagnostic tool to expose underlying fiscal health, valuation premiums, and capital efficiency for the companies compared below:
| Ratios | SLB N.V. (SLB) | Halliburton Company (HAL) |
|---|---|---|
| ROE | 12.83% | 12.21% |
| ROIC | 10.34% | 9.83% |
| P/E | 16.85 | 18.48 |
| P/B | 2.16 | 2.26 |
| Current Ratio | 1.33 | 2.04 |
| Quick Ratio | 0.98 | 1.51 |
| D/E (Debt-to-Equity) | 0.47 | 0.84 |
| Debt-to-Assets | 22.43% | 35.37% |
| Interest Coverage | 9.80 | 6.34 |
| Asset Turnover | 0.65 | 0.89 |
| Fixed Asset Turnover | 4.07 | 3.58 |
| Payout ratio | 47.82% | 45.13% |
| Dividend yield | 2.84% | 2.44% |
| Fiscal Year | 2025 | 2025 |
Efficiency & Valuation Duel: The Vital Signs
Financial ratios act as the DNA of a company, exposing hidden risks and operational strengths vital for investment decisions.
SLB N.V.
SLB shows solid profitability with a 12.8% ROE and a favorable 10.3% ROIC above its 6.7% WACC, signaling efficient capital use. The stock trades at a reasonable 16.9 P/E and 2.16 P/B, reflecting balanced valuation. A 2.84% dividend yield rewards shareholders while maintaining growth investments.
Halliburton Company
Halliburton posts a neutral 12.2% ROE and a slightly lower 9.8% ROIC relative to WACC at 6.6%, indicating moderate efficiency. Its P/E of 18.5 and P/B of 2.26 suggest a modest premium. The 2.44% dividend yield supports income, complemented by strong liquidity ratios that enhance financial stability.
Balanced Efficiency Meets Valuation Discipline
SLB offers a better blend of profitability and valuation with a higher ROIC and dividend yield, indicating efficient capital allocation and shareholder returns. Halliburton’s stronger liquidity suits investors prioritizing financial safety. The choice depends on whether one favors operational efficiency or conservative balance sheet strength.
Which one offers the Superior Shareholder Reward?
I compare SLB N.V. and Halliburton Company focusing on dividend yield, payout ratio, and buyback intensity. SLB yields 2.84% with a 48% payout, supported by strong free cash flow of 3.26/share. Halliburton offers 2.44% yield with a 45% payout but lower free cash flow at 1.99/share. SLB’s free cash flow coverage of dividends plus capex stands at 1.97x, slightly above Halliburton’s 1.60x, signaling more sustainable distributions. Both companies repurchase shares, but SLB’s higher cash flow and payout control suggest superior total return potential. I conclude SLB offers a more attractive and sustainable shareholder reward in 2026.
Comparative Score Analysis: The Strategic Profile
The radar chart reveals the fundamental DNA and trade-offs of SLB N.V. and Halliburton Company’s financial profiles, highlighting core strengths and vulnerabilities:
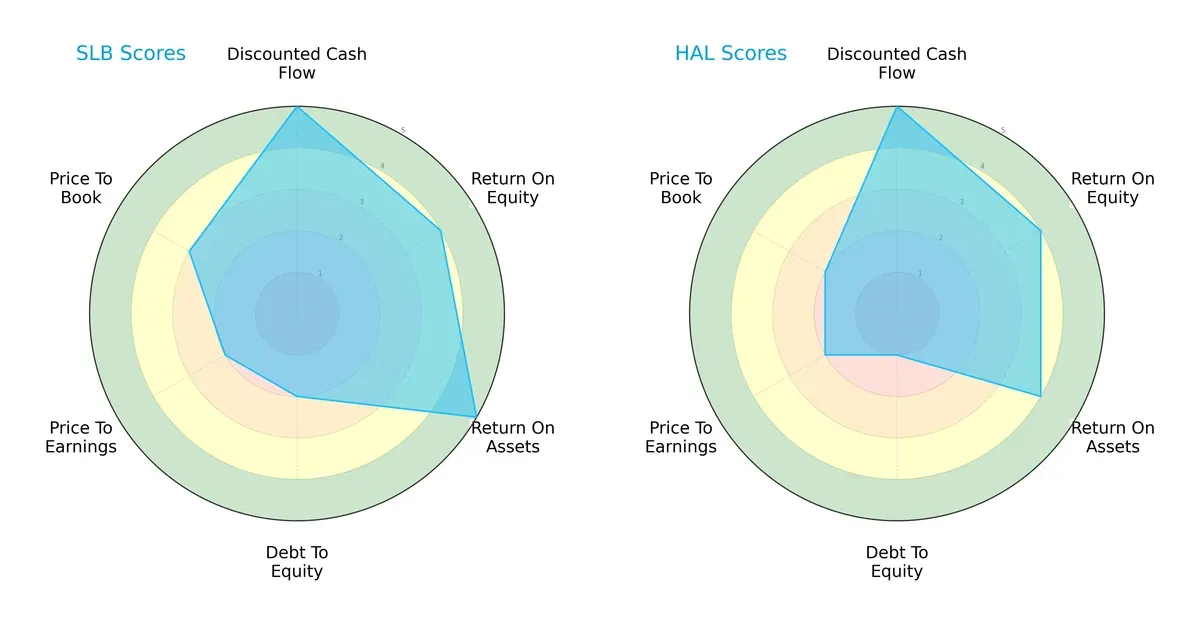
SLB displays a more balanced profile, excelling in ROA (5) and DCF (5), while maintaining moderate debt and valuation scores. Halliburton matches SLB in DCF (5) and ROE (4) but lags with a very unfavorable debt-to-equity score (1), signaling higher leverage risk. SLB’s diversification across metrics contrasts with Halliburton’s reliance on cash flow strength and profitability.
Bankruptcy Risk: Solvency Showdown
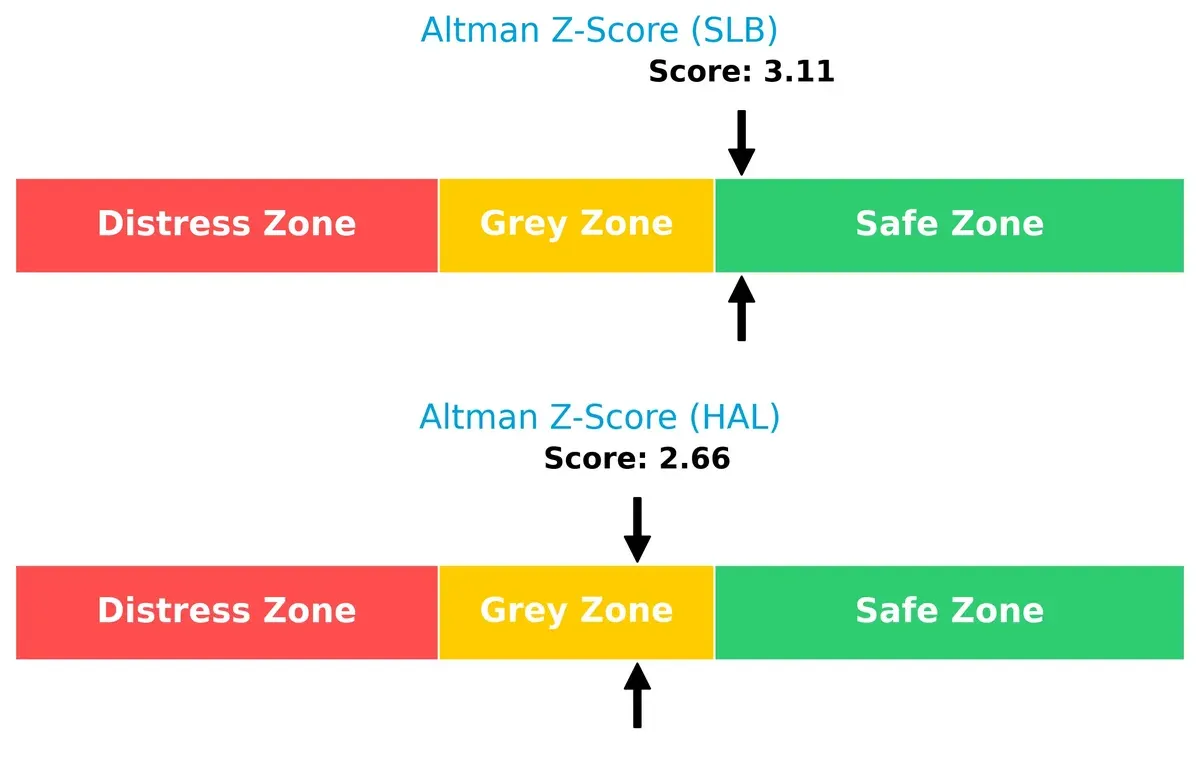
SLB’s Altman Z-Score of 3.11 places it securely in the safe zone, while Halliburton’s 2.66 suggests moderate bankruptcy risk in the grey zone. This gap indicates SLB’s stronger long-term solvency resilience in the current economic cycle:
Financial Health: Quality of Operations
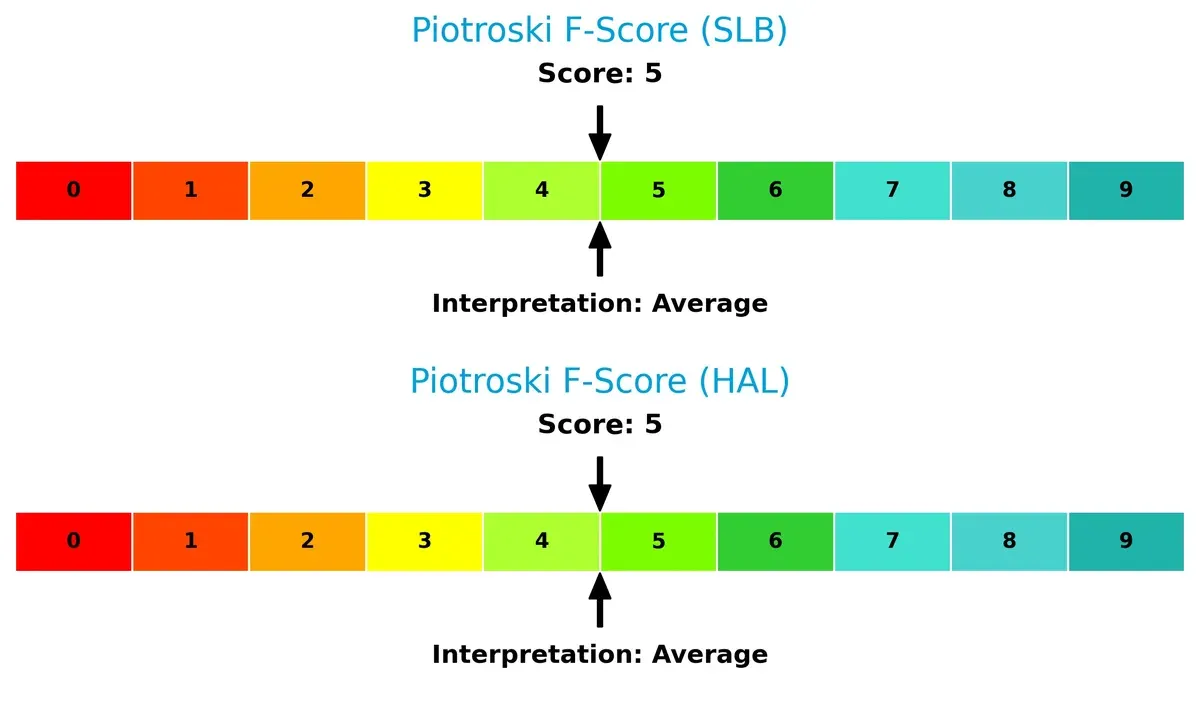
Both companies score an average 5 on the Piotroski F-Score, reflecting stable but not peak financial health. Neither exhibits immediate red flags, but neither stands out as exceptionally robust either:
How are the two companies positioned?
This section dissects SLB and HAL’s operational DNA by comparing revenue distribution and internal dynamics. The goal is to confront their economic moats to reveal which model offers the most resilient competitive advantage today.
Revenue Segmentation: The Strategic Mix
This visual comparison dissects how SLB N.V. and Halliburton Company diversify their income streams and where their primary sector bets lie:
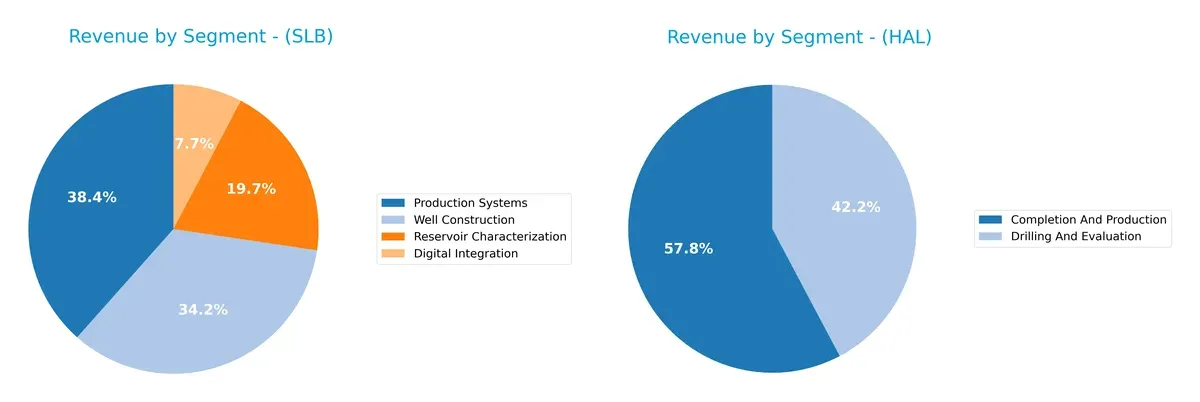
SLB N.V. anchors its revenue largely in Production Systems ($13.3B) and Well Construction ($11.9B), with solid contributions from Reservoir Characterization ($6.8B) and Digital Integration ($2.7B). Halliburton leans heavily on Completion And Production ($13.3B) and Drilling And Evaluation ($9.7B). SLB’s four-segment mix shows more diversification, reducing concentration risk. Halliburton’s two-segment focus signals strategic depth but exposes it to sector cyclicality. SLB pivots on technological breadth; Halliburton on core services dominance.
Strengths and Weaknesses Comparison
This table compares the Strengths and Weaknesses of SLB and Halliburton Company:
SLB Strengths
- Favorable ROIC above WACC supports value creation
- Strong debt management with low debt-to-assets
- High interest coverage indicates financial stability
- Diverse revenue streams across four product segments
- Balanced global presence with strong Middle East revenues
- Attractive dividend yield at 2.84%
Halliburton Strengths
- Strong liquidity ratios with current ratio above 2
- Favorable interest coverage despite higher debt
- Solid dividend yield at 2.44%
- Broad North American revenue base over 9.6B
- Balanced product portfolio in Completion and Drilling
- Favorable fixed asset turnover supports asset efficiency
SLB Weaknesses
- Neutral net margin and ROE indicate moderate profitability
- Quick ratio below 1 may signal liquidity risk
- Neutral asset turnover suggests room for operational improvement
- PB ratio slightly above 2 signals moderate market valuation
- Lower North America revenue compared to competitors
- Digital Integration revenue declined in 2025
Halliburton Weaknesses
- Lower net margin compared to SLB signals weaker profitability
- Higher debt-to-assets ratio reflects increased leverage risk
- Moderate ROIC below SLB may limit capital efficiency
- Narrower geographic revenue diversification
- Product segmentation concentrates on two main areas
- PE ratio above 18 indicates relatively higher valuation
SLB shows a well-balanced financial profile with strong capital efficiency and debt control but moderate liquidity and profitability. Halliburton offers superior liquidity and asset turnover but carries higher leverage and lower net margin, suggesting a different risk-return profile that affects strategic priorities.
The Moat Duel: Analyzing Competitive Defensibility
A structural moat is the only reliable shield preserving long-term profits from relentless competition erosion. Let’s dissect the core moats of SLB N.V. and Halliburton Company:
SLB N.V.: Tech-Driven Integration Moat
SLB commands a moat through advanced technology integration and a broad service portfolio. Its consistently rising ROIC by 48% since 2021 confirms efficient capital use and margin stability. New energy systems and carbon management solutions could deepen this moat in 2026.
Halliburton Company: Service Breadth with Margin Pressure
Halliburton relies on broad service offerings but faces a declining ROIC trend, signaling weakening competitive leverage. Unlike SLB’s tech edge, HAL struggles with margin compression. Expansion in AI-driven well management presents growth opportunities but with execution risks.
Verdict: Tech Integration vs. Service Breadth in a Margin Squeeze
SLB’s wider and deepening moat, evidenced by a very favorable ROIC trend and margin resilience, outmatches Halliburton’s slightly favorable but deteriorating profitability. SLB stands better equipped to defend and grow its market share through innovation.
Which stock offers better returns?
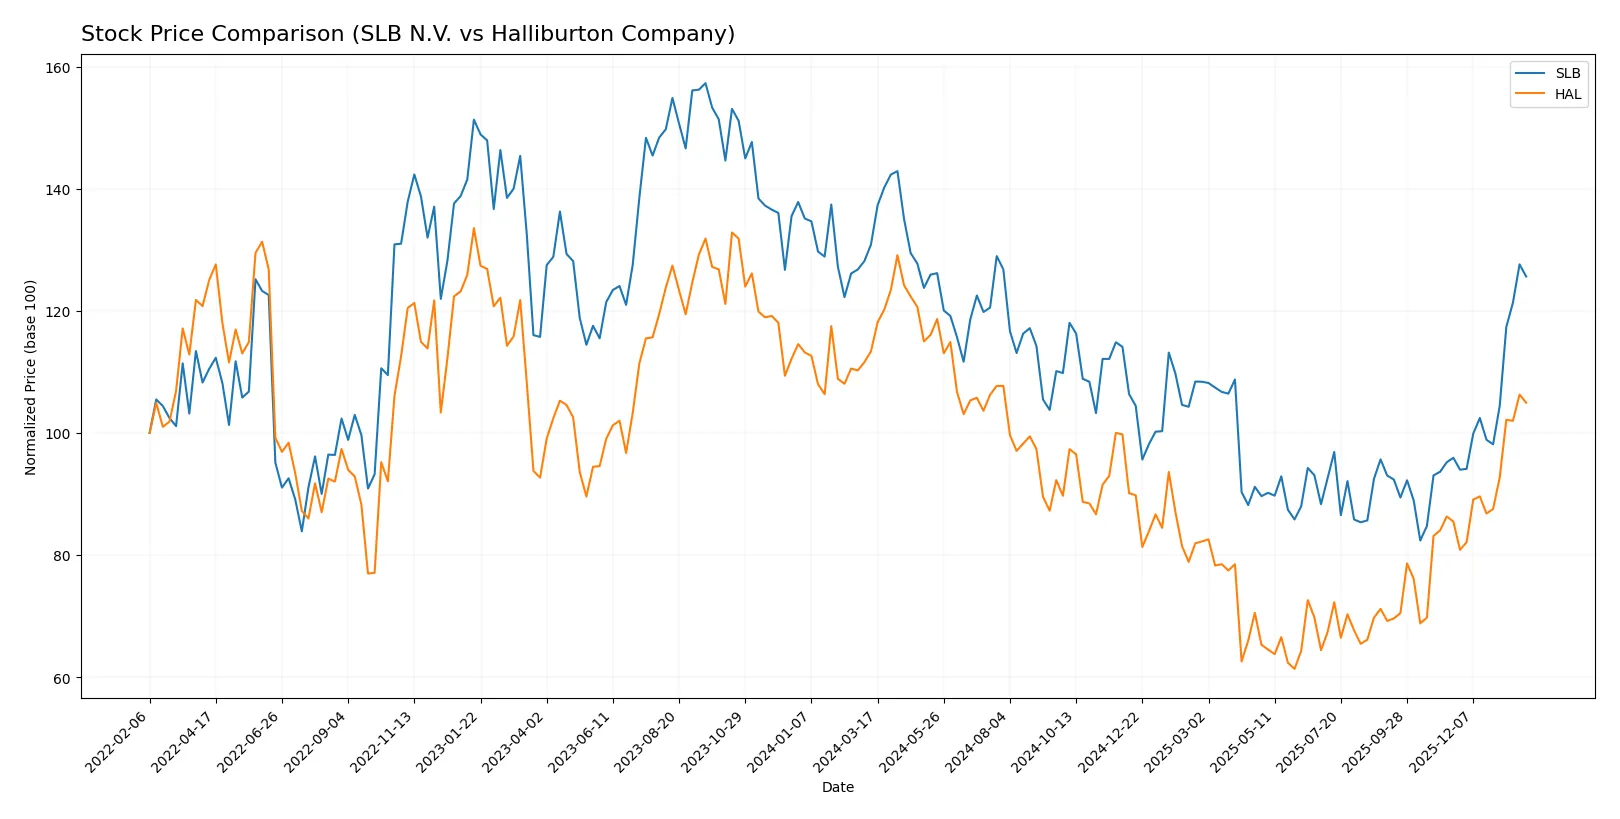
Stock prices for SLB N.V. and Halliburton Company have shown notable fluctuations over the past year, with both experiencing overall declines but recent strong upward momentum.
Trend Comparison
SLB’s stock declined 4.01% over the past 12 months, marking a bearish trend with accelerating downward momentum. Its price ranged between 31.72 and 55.03, showing volatility with a 5.73 standard deviation.
Halliburton’s stock fell 7.43% over the same period, also bearish with accelerating losses. The price fluctuated from 19.59 to 41.24, reflecting similar volatility at a 5.57 standard deviation.
Recently, SLB outperformed Halliburton with a 30.97% gain versus 22.78% over about two and a half months, indicating stronger short-term recovery momentum.
Target Prices
Analysts show a cautiously optimistic consensus for SLB N.V. and Halliburton Company.
| Company | Target Low | Target High | Consensus |
|---|---|---|---|
| SLB N.V. | 45 | 61 | 52.95 |
| Halliburton Company | 25 | 40 | 34.92 |
The SLB consensus target of $52.95 sits modestly above the current $48.38 price, signaling expected growth. Halliburton’s $34.92 target is just above its $33.52 market price, reflecting moderate upside potential.

Don’t Let Luck Decide Your Entry Point
Optimize your entry points with our advanced ProRealTime indicators. You’ll get efficient buy signals with precise price targets for maximum performance. Start outperforming now!
How do institutions grade them?
The following tables summarize recent institutional grades for SLB N.V. and Halliburton Company:
SLB N.V. Grades
This table lists recent grades assigned to SLB N.V. by reputable institutions.
| Grading Company | Action | New Grade | Date |
|---|---|---|---|
| JP Morgan | maintain | Overweight | 2026-01-26 |
| Citigroup | maintain | Buy | 2026-01-26 |
| Barclays | maintain | Overweight | 2026-01-26 |
| RBC Capital | maintain | Outperform | 2026-01-26 |
| B of A Securities | maintain | Buy | 2026-01-26 |
| Susquehanna | maintain | Positive | 2026-01-26 |
| BMO Capital | maintain | Outperform | 2026-01-26 |
| Stifel | maintain | Buy | 2026-01-21 |
| Susquehanna | maintain | Positive | 2026-01-07 |
| Freedom Capital Markets | downgrade | Hold | 2026-01-06 |
Halliburton Company Grades
This table shows recent institutional grades for Halliburton Company.
| Grading Company | Action | New Grade | Date |
|---|---|---|---|
| UBS | maintain | Neutral | 2026-01-23 |
| Citigroup | maintain | Buy | 2026-01-23 |
| Susquehanna | maintain | Positive | 2026-01-22 |
| JP Morgan | maintain | Overweight | 2026-01-22 |
| Goldman Sachs | maintain | Buy | 2026-01-22 |
| RBC Capital | maintain | Outperform | 2026-01-22 |
| Stifel | maintain | Buy | 2026-01-22 |
| Evercore ISI Group | maintain | In Line | 2026-01-22 |
| Stifel | maintain | Buy | 2026-01-21 |
| Piper Sandler | maintain | Neutral | 2026-01-14 |
Which company has the best grades?
SLB N.V. holds a strong consensus with mostly “Buy,” “Overweight,” and “Outperform” ratings. Halliburton also shows solid grades but includes more “Neutral” and “In Line” opinions. Investors might interpret SLB’s higher concentration of bullish grades as stronger institutional confidence.
Risks specific to each company
The following categories identify the critical pressure points and systemic threats facing both firms in the 2026 market environment:
1. Market & Competition
SLB N.V.
- SLB benefits from broader market cap and diverse technology offerings but faces intense competition from HAL and others.
Halliburton Company
- HAL operates with a smaller market cap, focusing on completion and drilling segments, competing fiercely with SLB’s integrated solutions.
2. Capital Structure & Debt
SLB N.V.
- SLB shows a conservative debt-to-equity ratio of 0.47, reflecting strong balance sheet discipline.
Halliburton Company
- HAL’s higher debt-to-equity ratio of 0.84 increases financial risk and reduces flexibility.
3. Stock Volatility
SLB N.V.
- SLB has lower beta (0.723), indicating less stock price volatility relative to the market.
Halliburton Company
- HAL’s beta is slightly higher at 0.787, suggesting more sensitivity to market swings.
4. Regulatory & Legal
SLB N.V.
- SLB faces global regulatory scrutiny but leverages strong compliance frameworks.
Halliburton Company
- HAL contends with regulatory challenges in multiple jurisdictions, with potential legal exposures in service operations.
5. Supply Chain & Operations
SLB N.V.
- SLB’s global operational scale offers resilience but exposes it to complex supply chain risks.
Halliburton Company
- HAL’s smaller scale allows more agility but may suffer from operational bottlenecks and supplier dependency.
6. ESG & Climate Transition
SLB N.V.
- SLB actively integrates carbon management and digital energy solutions, aligning with climate transition goals.
Halliburton Company
- HAL is developing ESG initiatives but lags SLB in comprehensive climate strategy and technology integration.
7. Geopolitical Exposure
SLB N.V.
- SLB’s global footprint exposes it to geopolitical risks but diversifies country-specific shocks.
Halliburton Company
- HAL’s operations are also global but concentrated exposure in riskier regions increases vulnerability.
Which company shows a better risk-adjusted profile?
SLB’s most impactful risk is its complex global supply chain, which may be disrupted by geopolitical tensions. HAL’s greatest risk lies in its elevated leverage, heightening financial strain under market stress. SLB exhibits a stronger risk-adjusted profile, supported by a safer Altman Z-Score above 3 and more balanced capital structure. The contrast in debt ratios and financial stability underscores my concern about HAL’s vulnerability despite its operational agility.
Final Verdict: Which stock to choose?
SLB N.V. stands out with its durable competitive advantage fueled by a growing ROIC well above its cost of capital. It operates as a robust value creator, efficiently allocating capital to sustain profitability. A point of vigilance remains its recent slowdown in revenue growth, suggesting caution for more cyclical exposures. SLB suits investors seeking aggressive growth combined with solid fundamentals.
Halliburton Company’s strategic moat lies in its strong liquidity and operational efficiency, offering a safer balance sheet relative to SLB. Despite a declining ROIC trend, it maintains value creation and benefits from consistent cash flow generation. Halliburton fits well within a GARP (Growth at a Reasonable Price) portfolio, appealing to those prioritizing stability alongside moderate growth.
If you prioritize durable competitive advantages and value creation, SLB outshines due to its expanding profitability and efficient capital use. However, if you seek better financial stability and a more conservative risk profile, Halliburton offers superior liquidity and steadier cash flows despite a less favorable growth trajectory. Each company aligns with distinct investor profiles navigating the volatile energy sector.
Disclaimer: Investment carries a risk of loss of initial capital. The past performance is not a reliable indicator of future results. Be sure to understand risks before making an investment decision.
Go Further
I encourage you to read the complete analyses of SLB N.V. and Halliburton Company to enhance your investment decisions: