In today’s fast-evolving tech landscape, GoDaddy Inc. and Okta, Inc. stand out as leaders in the software infrastructure sector. Both companies serve a broad range of clients, from small businesses to large enterprises, with overlapping focuses on cloud-based solutions and digital security. Their innovation strategies target simplifying online presence and identity management, making them worthy contenders for investor consideration. Let’s explore which company offers the most compelling opportunity for your portfolio.

Table of contents
Companies Overview
I will begin the comparison between GoDaddy Inc. and Okta, Inc. by providing an overview of these two companies and their main differences.
GoDaddy Overview
GoDaddy Inc. focuses on designing and developing cloud-based technology products with a strong emphasis on domain name registration and website hosting services. Serving small businesses, individuals, and developers, GoDaddy offers a range of tools including marketing, security, and business applications. Headquartered in Tempe, Arizona, it is a prominent player in the software infrastructure industry with a market cap of approximately 14.5B USD.
Okta Overview
Okta, Inc. specializes in identity solutions for enterprises and organizations worldwide, providing a cloud-based platform that includes services such as single sign-on, multi-factor authentication, and API access management. Okta targets a diverse customer base including businesses, universities, and government entities. Based in San Francisco, California, Okta operates in the same software infrastructure sector and has a market capitalization near 15.2B USD.
Key similarities and differences
Both GoDaddy and Okta operate within the software infrastructure industry and serve a broad range of customers globally. While GoDaddy’s business centers on enabling digital presence through domain and hosting services, Okta focuses on secure identity management solutions. Their business models differ primarily in product focus: GoDaddy emphasizes online presence and e-commerce tools, whereas Okta delivers cybersecurity and access management platforms. Both companies trade actively on major U.S. stock exchanges.
Income Statement Comparison
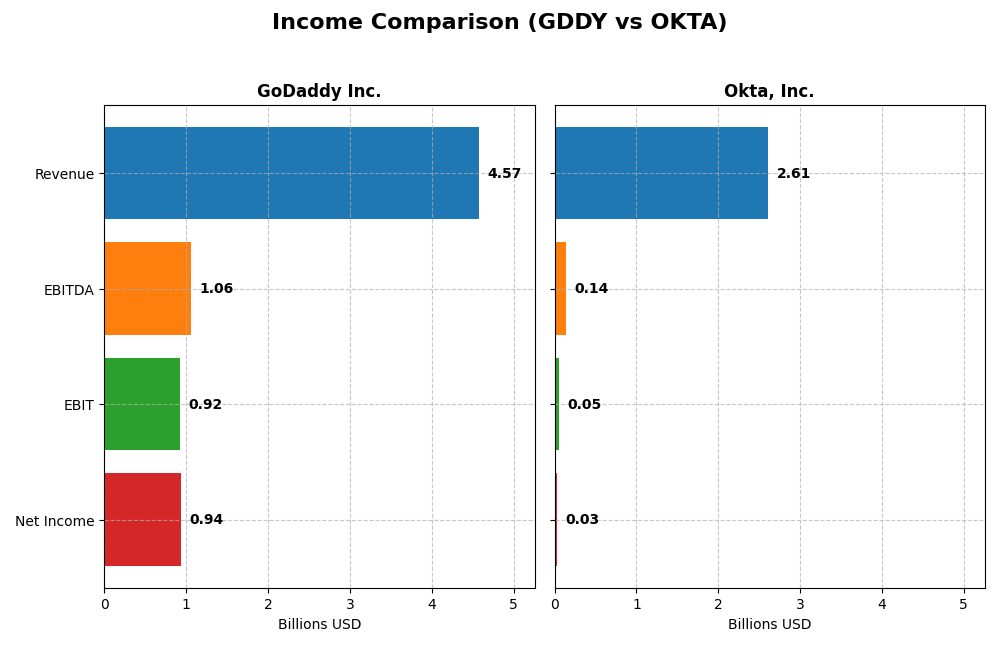
The following table compares key income statement metrics for GoDaddy Inc. and Okta, Inc. based on their most recent fiscal year reports.
| Metric | GoDaddy Inc. (GDDY) | Okta, Inc. (OKTA) |
|---|---|---|
| Market Cap | 14.5B | 15.2B |
| Revenue | 4.57B | 2.61B |
| EBITDA | 1.06B | 139M |
| EBIT | 924M | 51M |
| Net Income | 937M | 28M |
| EPS | 6.63 | 0.17 |
| Fiscal Year | 2024 | 2025 |
Income Statement Interpretations
GoDaddy Inc.
GoDaddy’s revenue showed a steady increase from $3.3B in 2020 to $4.57B in 2024, with net income rising significantly from a loss of $495M in 2020 to $937M in 2024. Margins improved, highlighted by a favorable gross margin of 63.9% and EBIT margin of 20.2%. However, net margin declined by 36.6% in 2024, despite overall positive growth trends.
Okta, Inc.
Okta’s revenue grew robustly from $835M in 2021 to $2.61B in 2025, with net income shifting from a $266M loss in 2021 to a $28M profit in 2025. The company maintains a strong gross margin at 76.3%, though EBIT margin remains low at 1.95%. Recent growth is favorable across revenue, net margin, and EPS, with net margin rising over 100% year-over-year.
Which one has the stronger fundamentals?
Both companies show favorable income statement trends, but GoDaddy demonstrates higher margins and stronger absolute net income growth over five years. Okta exhibits more rapid revenue growth and margin improvements from losses to profitability, though at lower margin levels overall. The stronger fundamentals depend on the investor’s focus on margin stability versus growth trajectory.
Financial Ratios Comparison
The table below presents a side-by-side comparison of key financial ratios for GoDaddy Inc. and Okta, Inc. based on the most recent fiscal year data available.
| Ratios | GoDaddy Inc. (2024) | Okta, Inc. (2025) |
|---|---|---|
| ROE | 1.35 | 0.44 |
| ROIC | 0.16 | -0.006 |
| P/E | 29.76 | 570.60 |
| P/B | 40.28 | 2.49 |
| Current Ratio | 0.72 | 1.35 |
| Quick Ratio | 0.72 | 1.35 |
| D/E | 5.63 | 0.15 |
| Debt-to-Assets | 0.47 | 0.10 |
| Interest Coverage | 5.64 | -14.8 |
| Asset Turnover | 0.56 | 0.28 |
| Fixed Asset Turnover | 22.22 | 22.31 |
| Payout ratio | 0 | 0 |
| Dividend yield | 0 | 0 |
Interpretation of the Ratios
GoDaddy Inc.
GoDaddy shows strong profitability with a net margin of 20.49%, an exceptionally high ROE of 135.37%, and a robust ROIC of 16.02%, all favorable indicators. However, liquidity ratios like the current and quick ratio are weak at 0.72, and leverage is high with a debt-to-equity of 5.63. The company does not pay dividends, reflecting a reinvestment strategy or growth focus.
Okta, Inc.
Okta’s profitability ratios are weak, with a net margin of 1.07%, ROE at 0.44%, and a negative ROIC of -0.61%, signaling operational challenges. Liquidity is healthier with a current ratio of 1.35 and a quick ratio of 1.35, while leverage is low at 0.15 debt-to-equity. Okta also pays no dividends, likely prioritizing reinvestment and R&D.
Which one has the best ratios?
Both companies have an equal proportion of favorable and unfavorable ratios, resulting in a neutral overall assessment. GoDaddy excels in profitability but struggles with liquidity and leverage, whereas Okta maintains better liquidity and lower debt but faces profitability and operational efficiency challenges. Neither stands out clearly as superior based solely on these ratios.
Strategic Positioning
This section compares the strategic positioning of GoDaddy Inc. and Okta, Inc. in terms of Market position, Key segments, and Exposure to technological disruption:
GoDaddy Inc.
- Large market cap with moderate beta, facing competition in cloud-based infrastructure software.
- Focuses on domain registration, website hosting, marketing tools, and business applications driving revenue growth.
- Exposure to evolving cloud technology with diversified product offerings including security and hosting.
Okta, Inc.
- Similar market cap with lower beta, competing in identity management software and security services.
- Concentrates on identity cloud solutions including authentication, lifecycle management, and API security subscription services.
- High exposure to cutting-edge identity and access management technology with continuous innovation in authentication methods.
GoDaddy Inc. vs Okta, Inc. Positioning
GoDaddy presents a diversified strategy spanning domains, hosting, marketing, and business apps, leveraging multiple revenue streams. Okta focuses on a concentrated identity solutions niche, emphasizing enterprise security and cloud authentication, with a specialized product portfolio.
Which has the best competitive advantage?
GoDaddy demonstrates a very favorable moat with growing ROIC above WACC, indicating durable competitive advantage. Okta shows slightly unfavorable moat status with negative ROIC compared to WACC, despite improving profitability, suggesting weaker value creation.
Stock Comparison
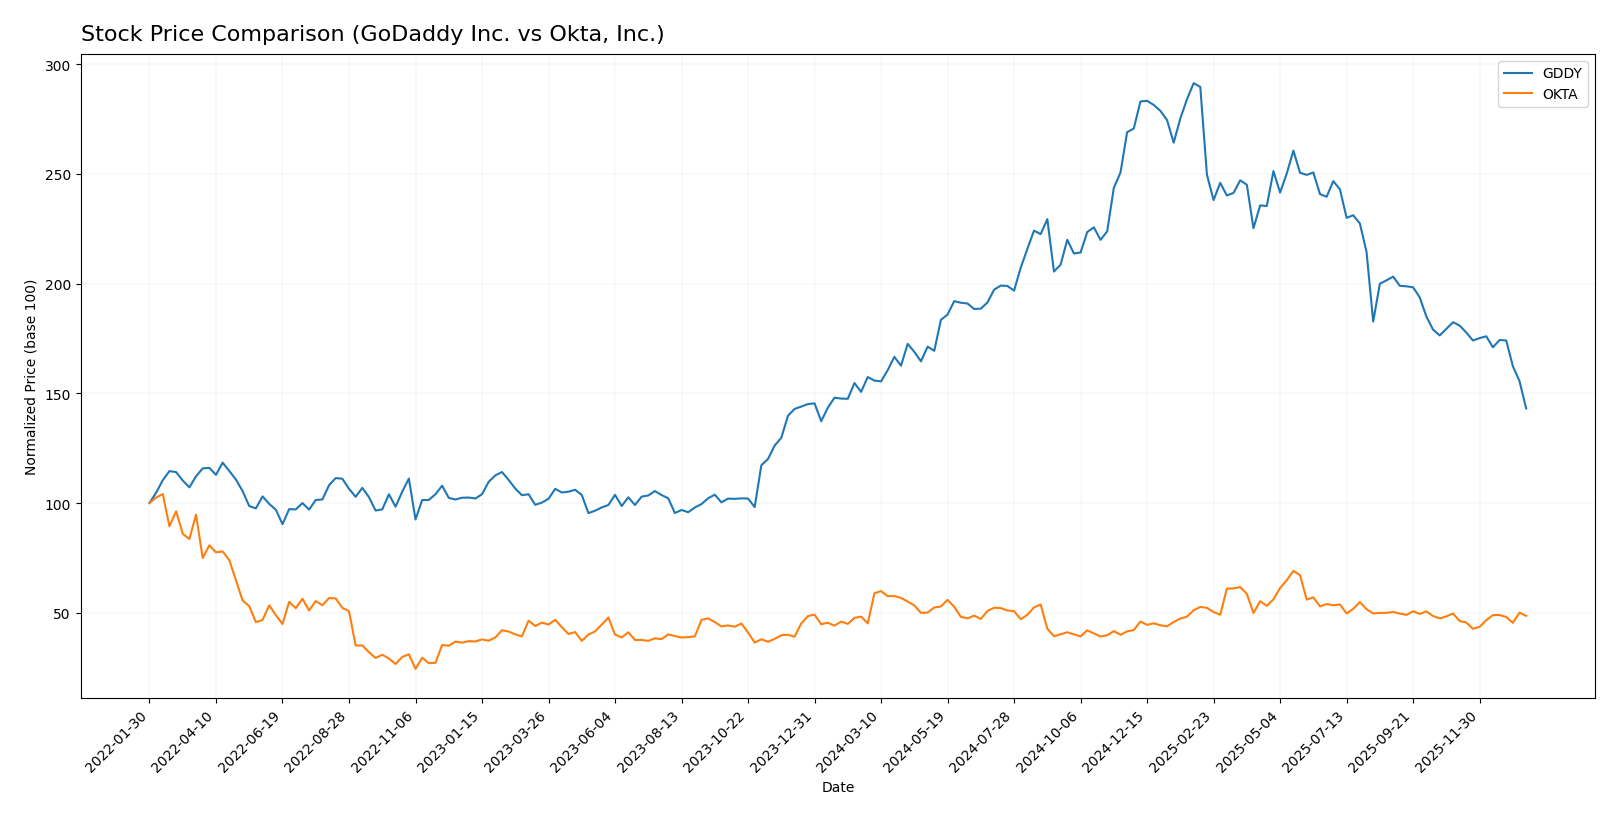
The stock price movements of GoDaddy Inc. and Okta, Inc. over the past year reveal contrasting trends, with GoDaddy experiencing a notable decline while Okta shows overall growth amid varying recent momentum.
Trend Analysis
GoDaddy Inc. has shown a bearish trend over the past 12 months with a -9.09% price change and deceleration in trend strength, ranging between a high of 212.65 and a low of 104.46, accompanied by high volatility (std deviation 27.35). Recently, GoDaddy’s trend worsened with a -21.54% decline and a slightly negative slope.
Okta, Inc. displayed a bullish trend over the same 12-month period, with a 7.58% price increase and accelerating momentum, fluctuating from 72.24 to 127.3, and moderate volatility (std deviation 11.38). However, its recent trend slightly declined by -2.16%, though the slope indicates mild recovery.
Comparing both, Okta delivered the highest market performance over the past year with positive growth, while GoDaddy’s stock declined significantly, reflecting divergent investor sentiment and trading behavior.
Target Prices
Here is the current target price consensus from reputable analysts for GoDaddy Inc. and Okta, Inc.:
| Company | Target High | Target Low | Consensus |
|---|---|---|---|
| GoDaddy Inc. | 182 | 70 | 143.33 |
| Okta, Inc. | 140 | 60 | 110.67 |
Analysts expect GoDaddy’s stock to appreciate significantly from its current price of $104.46, with a consensus target around $143.33. Okta’s target consensus of $110.67 also suggests upside from its current price of $89.55.
Analyst Opinions Comparison
This section compares the analysts’ ratings and financial scores for GoDaddy Inc. and Okta, Inc.:
Rating Comparison
GoDaddy Inc. Rating
- Rating: B+, considered very favorable by analysts.
- Discounted Cash Flow Score: 5, very favorable valuation.
- ROE Score: 5, very favorable efficiency in equity use.
- ROA Score: 4, favorable asset utilization.
- Debt To Equity Score: 1, very unfavorable financial risk.
- Overall Score: 3, moderate overall financial standing.
Okta, Inc. Rating
- Rating: B, also considered very favorable by analysts.
- Discounted Cash Flow Score: 4, favorable valuation.
- ROE Score: 2, moderate efficiency in equity use.
- ROA Score: 3, moderate asset utilization.
- Debt To Equity Score: 4, favorable financial risk profile.
- Overall Score: 3, moderate overall financial standing.
Which one is the best rated?
Based strictly on provided data, GoDaddy holds a higher rating (B+) and stronger scores in discounted cash flow, ROE, and ROA. However, Okta shows a better debt-to-equity score, indicating less financial risk. Overall scores are equal.
Scores Comparison
Here is a comparison of the Altman Z-Score and Piotroski Score for GoDaddy Inc. and Okta, Inc.:
GoDaddy Scores
- Altman Z-Score: 1.53, in distress zone indicating high bankruptcy risk.
- Piotroski Score: 8, very strong financial health rating.
Okta Scores
- Altman Z-Score: 4.15, in safe zone indicating low bankruptcy risk.
- Piotroski Score: 8, very strong financial health rating.
Which company has the best scores?
Okta has a significantly better Altman Z-Score at 4.15, placing it in the safe zone, while GoDaddy is in distress with 1.53. Both share an equally strong Piotroski Score of 8.
Grades Comparison
The following is a detailed comparison of the recent grades assigned to GoDaddy Inc. and Okta, Inc.:
GoDaddy Inc. Grades
This table summarizes the latest grades and actions from established financial institutions for GoDaddy Inc.:
| Grading Company | Action | New Grade | Date |
|---|---|---|---|
| Morgan Stanley | maintain | Equal Weight | 2026-01-15 |
| Cantor Fitzgerald | maintain | Neutral | 2026-01-08 |
| Jefferies | maintain | Hold | 2026-01-05 |
| B. Riley Securities | maintain | Buy | 2025-10-31 |
| Evercore ISI Group | maintain | In Line | 2025-10-31 |
| Benchmark | maintain | Buy | 2025-10-31 |
| JP Morgan | maintain | Overweight | 2025-10-31 |
| Citigroup | maintain | Buy | 2025-10-31 |
| UBS | maintain | Neutral | 2025-10-31 |
| Wells Fargo | maintain | Equal Weight | 2025-10-06 |
Overall, GoDaddy’s grades show a mix of Buy and Neutral/Hold ratings with no recent upgrades or downgrades.
Okta, Inc. Grades
The following table details recent grades and actions for Okta, Inc. from recognized grading firms:
| Grading Company | Action | New Grade | Date |
|---|---|---|---|
| Stephens & Co. | upgrade | Overweight | 2026-01-14 |
| Piper Sandler | maintain | Neutral | 2026-01-05 |
| RBC Capital | maintain | Outperform | 2026-01-05 |
| Jefferies | upgrade | Buy | 2025-12-16 |
| Needham | maintain | Buy | 2025-12-12 |
| BTIG | maintain | Buy | 2025-12-04 |
| Susquehanna | maintain | Neutral | 2025-12-03 |
| Cantor Fitzgerald | maintain | Overweight | 2025-12-03 |
| Canaccord Genuity | maintain | Buy | 2025-12-03 |
| Scotiabank | maintain | Sector Perform | 2025-12-03 |
The grade trend for Okta indicates several recent upgrades and a generally bullish consensus, with multiple Buy and Overweight ratings.
Which company has the best grades?
Okta, Inc. has received relatively more upgrades and a stronger bias toward Buy and Overweight ratings compared to GoDaddy Inc., which shows a more balanced mix of Buy, Hold, and Neutral grades. This suggests Okta may currently be viewed more favorably by analysts, potentially influencing investor sentiment and portfolio allocation decisions.
Strengths and Weaknesses
Below is a comparative table highlighting the key strengths and weaknesses of GoDaddy Inc. (GDDY) and Okta, Inc. (OKTA) based on the most recent financial and operational data available.
| Criterion | GoDaddy Inc. (GDDY) | Okta, Inc. (OKTA) |
|---|---|---|
| Diversification | Strong diversification with Core Platform ($2.92B) and Applications & Commerce ($1.65B) segments | Limited diversification, primarily Subscription and Circulation ($2.56B) with small Technology Service segment |
| Profitability | High profitability with 20.49% net margin and ROIC at 16.02%, creating strong value | Low profitability; net margin at 1.07% and negative ROIC (-0.61%), indicating value erosion |
| Innovation | Moderate innovation with steady revenue growth in applications | High innovation focus but not yet translating into profitability |
| Global presence | Established global presence with a durable competitive advantage | Growing global presence but still developing competitive moat |
| Market Share | Significant market share in domain registration and hosting | Increasing market share in identity management but faces intense competition |
Key takeaways: GoDaddy demonstrates strong value creation, diversification, and profitability, making it a stable investment option. Okta, while innovative with growing revenues, currently struggles with profitability and value creation, presenting higher investment risk.
Risk Analysis
The following table summarizes key risks for GoDaddy Inc. (GDDY) and Okta, Inc. (OKTA) based on the most recent data available in 2026:
| Metric | GoDaddy Inc. (GDDY) | Okta, Inc. (OKTA) |
|---|---|---|
| Market Risk | Moderate beta at 0.95, indicating typical tech sector volatility | Lower beta at 0.76 suggests slightly less volatility |
| Debt Level | High debt-to-equity ratio (5.63), indicating significant leverage | Low debt-to-equity ratio (0.15), signaling low financial risk |
| Regulatory Risk | Moderate; operates globally with some exposure to data privacy laws | High; identity management sector faces strict compliance demands |
| Operational Risk | Moderate; reliance on cloud infrastructure and hosting services | Moderate; dependency on platform stability and security |
| Environmental Risk | Low; primarily software-based with minimal direct environmental impact | Low; software services with limited environmental footprint |
| Geopolitical Risk | Moderate; global operations expose it to international regulatory shifts | Moderate; similar exposure due to international clientele |
GoDaddy’s most impactful risk is its high leverage, raising financial risk despite strong profitability. Okta faces high regulatory risk due to the sensitive nature of identity management, though its low debt and strong financial health mitigate bankruptcy risk. Investors should weigh leverage against growth prospects and compliance challenges in these tech infrastructure firms.
Which Stock to Choose?
GoDaddy Inc. (GDDY) shows a generally favorable income evolution with strong profitability metrics, including a 20.49% net margin and a 135.37% return on equity. Despite unfavorable liquidity and leverage ratios, the company maintains a very favorable rating and demonstrates a very favorable moat with ROIC significantly above WACC.
Okta, Inc. (OKTA) displays a favorable income statement growth and maintains a neutral to favorable profitability profile, with a 1.07% net margin and low but improving returns. The company has more favorable liquidity and debt ratios, a slightly unfavorable moat due to ROIC below WACC, but holds a very favorable overall rating.
Investors focused on strong profitability and durable competitive advantage may find GoDaddy’s profile more appealing, while those valuing balance sheet strength and growth potential might lean toward Okta. The choice could depend on tolerance for leverage and preference between value creation versus improvement trajectories.
Disclaimer: Investment carries a risk of loss of initial capital. The past performance is not a reliable indicator of future results. Be sure to understand risks before making an investment decision.
Go Further
I encourage you to read the complete analyses of GoDaddy Inc. and Okta, Inc. to enhance your investment decisions: