In today’s dynamic tech landscape, GoDaddy Inc. and Nutanix, Inc. stand out as key players in the software infrastructure sector. GoDaddy focuses on cloud-based digital identity and web presence solutions, while Nutanix specializes in enterprise cloud platforms and hybrid cloud orchestration. Despite targeting different customer needs, both companies drive innovation in cloud technology. This article will help you decide which company offers the most compelling investment opportunity in 2026.
Table of contents
Companies Overview
I will begin the comparison between GoDaddy and Nutanix by providing an overview of these two companies and their main differences.
GoDaddy Overview
GoDaddy Inc. focuses on cloud-based technology products, primarily targeting small businesses, individuals, and domain investors. The company offers domain registration, website hosting, security, marketing tools, and business applications to help customers establish and grow their online presence. Headquartered in Tempe, Arizona, GoDaddy operates globally and is known for its comprehensive digital identity solutions.
Nutanix Overview
Nutanix, Inc. delivers an enterprise cloud platform designed to simplify IT infrastructure management across various regions including North America, Europe, and Asia Pacific. Its offerings include virtualization, storage, security services, and cloud automation tools aimed at hybrid and multi-cloud environments. Based in San Jose, California, Nutanix serves diverse industries such as healthcare, finance, and telecommunications with a focus on enterprise-grade cloud solutions.
Key similarities and differences
Both GoDaddy and Nutanix operate within the Software – Infrastructure industry and provide cloud-related services, but their market focus differs significantly. GoDaddy targets smaller businesses and individual users with domain and hosting solutions, while Nutanix focuses on enterprise customers seeking advanced cloud infrastructure and hybrid cloud management. The companies also differ in scale, with GoDaddy having about 5.5K employees versus Nutanix’s 7.1K, reflecting their distinct market positions and product specializations.
Income Statement Comparison
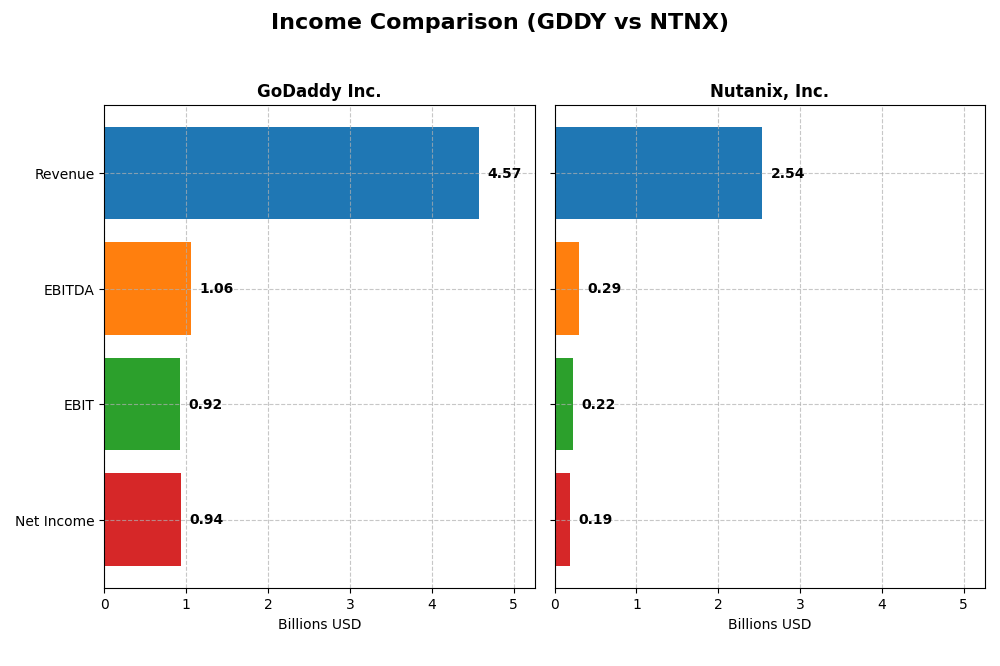
This table presents a side-by-side comparison of key income statement metrics for GoDaddy Inc. and Nutanix, Inc. for their most recent fiscal years, offering a clear view of their financial performance.
| Metric | GoDaddy Inc. (GDDY) | Nutanix, Inc. (NTNX) |
|---|---|---|
| Market Cap | 14.5B | 12.4B |
| Revenue | 4.57B (2024) | 2.54B (2025) |
| EBITDA | 1.06B (2024) | 293M (2025) |
| EBIT | 924M (2024) | 220M (2025) |
| Net Income | 937M (2024) | 188M (2025) |
| EPS | 6.63 (2024) | 0.70 (2025) |
| Fiscal Year | 2024 | 2025 |
Income Statement Interpretations
GoDaddy Inc.
From 2020 to 2024, GoDaddy’s revenue grew steadily by 37.9%, with net income surging 289.2%, reflecting strong profitability improvements. Gross and EBIT margins remained favorable, around 63.9% and 20.2%, respectively. In 2024, revenue growth slowed to 7.5%, EBIT jumped 58.5%, but net margin and EPS declined, signaling some margin pressure despite solid operational gains.
Nutanix, Inc.
Nutanix exhibited robust revenue growth of 82.0% from 2021 to 2025, accompanied by a favorable net income increase of 118.2%. Gross margin was very high at 86.8%, while EBIT margin was moderate at 8.7%. The 2025 fiscal year saw strong growth acceleration with revenue up 18.1%, EBIT soaring 223.3%, and net margin improving by 227.8%, highlighting operational leverage and improving profitability.
Which one has the stronger fundamentals?
Both companies show favorable income statement trends, but Nutanix stands out with higher gross margin and stronger recent growth rates across revenue, EBIT, and net margin. GoDaddy maintains higher absolute profitability and margin stability but faced some net margin and EPS declines in the latest year. Nutanix’s consistent margin expansion and growth acceleration suggest relatively stronger fundamentals over the period analyzed.
Financial Ratios Comparison
The table below presents the most recent key financial ratios for GoDaddy Inc. and Nutanix, Inc., reflecting their fiscal year 2024 and 2025 results respectively.
| Ratios | GoDaddy Inc. (2024) | Nutanix, Inc. (2025) |
|---|---|---|
| ROE | 135.4% | -27.1% |
| ROIC | 16.0% | 8.1% |
| P/E | 29.8 | 106.7 |
| P/B | 40.3 | -29.0 |
| Current Ratio | 0.72 | 1.72 |
| Quick Ratio | 0.72 | 1.72 |
| D/E (Debt-to-Equity) | 5.63 | -2.14 |
| Debt-to-Assets | 47.3% | 45.2% |
| Interest Coverage | 5.64 | 8.75 |
| Asset Turnover | 0.56 | 0.77 |
| Fixed Asset Turnover | 22.2 | 9.15 |
| Payout Ratio | 0 | 0 |
| Dividend Yield | 0% | 0% |
Interpretation of the Ratios
GoDaddy Inc.
GoDaddy shows a mix of strong and weak financial ratios. Its net margin (20.49%) and return on equity (135.37%) are notably favorable, indicating strong profitability and shareholder value creation. However, the company’s valuation metrics like PE (29.76) and PB (40.28) ratios are unfavorable, suggesting a possibly high market price relative to earnings and book value. The liquidity ratios are weak, with a current ratio of 0.72, raising concerns about short-term financial stability. GoDaddy does not pay dividends, reflecting a reinvestment strategy to fuel growth or operational needs without distributing cash to shareholders.
Nutanix, Inc.
Nutanix presents mostly favorable liquidity and solvency ratios, with a current ratio of 1.72 and a negative debt-to-equity ratio, indicating low leverage and good short-term financial health. Its net margin (7.42%) and return on invested capital (8.11%) are neutral, while return on equity is unfavorable at -27.12%, highlighting profitability challenges. The PE ratio is high at 106.74, suggesting elevated market expectations. Nutanix does not pay dividends, consistent with a growth-focused approach prioritizing R&D and expansion over shareholder payouts.
Which one has the best ratios?
Nutanix’s ratios lean more toward favorable, especially in liquidity and leverage, while GoDaddy excels in profitability but struggles with liquidity and valuation metrics. Both companies do not pay dividends, indicating reinvestment priorities. Overall, Nutanix’s slightly favorable global ratio opinion contrasts with GoDaddy’s neutral rating, suggesting Nutanix currently holds a marginally better ratio profile.
Strategic Positioning
This section compares the strategic positioning of GoDaddy Inc. and Nutanix, Inc., focusing on Market position, Key segments, and Exposure to technological disruption:
GoDaddy Inc.
- Leading domain registration and cloud-based infrastructure provider with competitive pressure in hosting and online presence markets.
- Key segments include Core Platform and Applications & Commerce, focusing on domains, hosting, and business applications.
- Exposure to technological disruption through cloud hosting advances, security tools, and evolving digital marketing platforms.
Nutanix, Inc.
- Enterprise cloud platform provider with broad global presence facing competition in hybrid cloud and virtualization markets.
- Focused on subscription cloud services, professional services, and software for enterprise cloud and hybrid environments.
- Faces technological disruption from evolving cloud-native environments, Kubernetes, and hybrid cloud orchestration technologies.
GoDaddy Inc. vs Nutanix, Inc. Positioning
GoDaddy maintains a diversified portfolio across domains, hosting, and marketing tools, leveraging digital identity services. Nutanix concentrates on enterprise cloud and hybrid cloud software, emphasizing automation and virtualization. GoDaddy’s broad customer base contrasts with Nutanix’s industry-specific enterprise focus.
Which has the best competitive advantage?
Both companies demonstrate very favorable moats with growing ROIC above WACC, indicating durable competitive advantages. GoDaddy shows a stronger ROIC margin and faster growth, suggesting a slightly more robust economic moat.
Stock Comparison
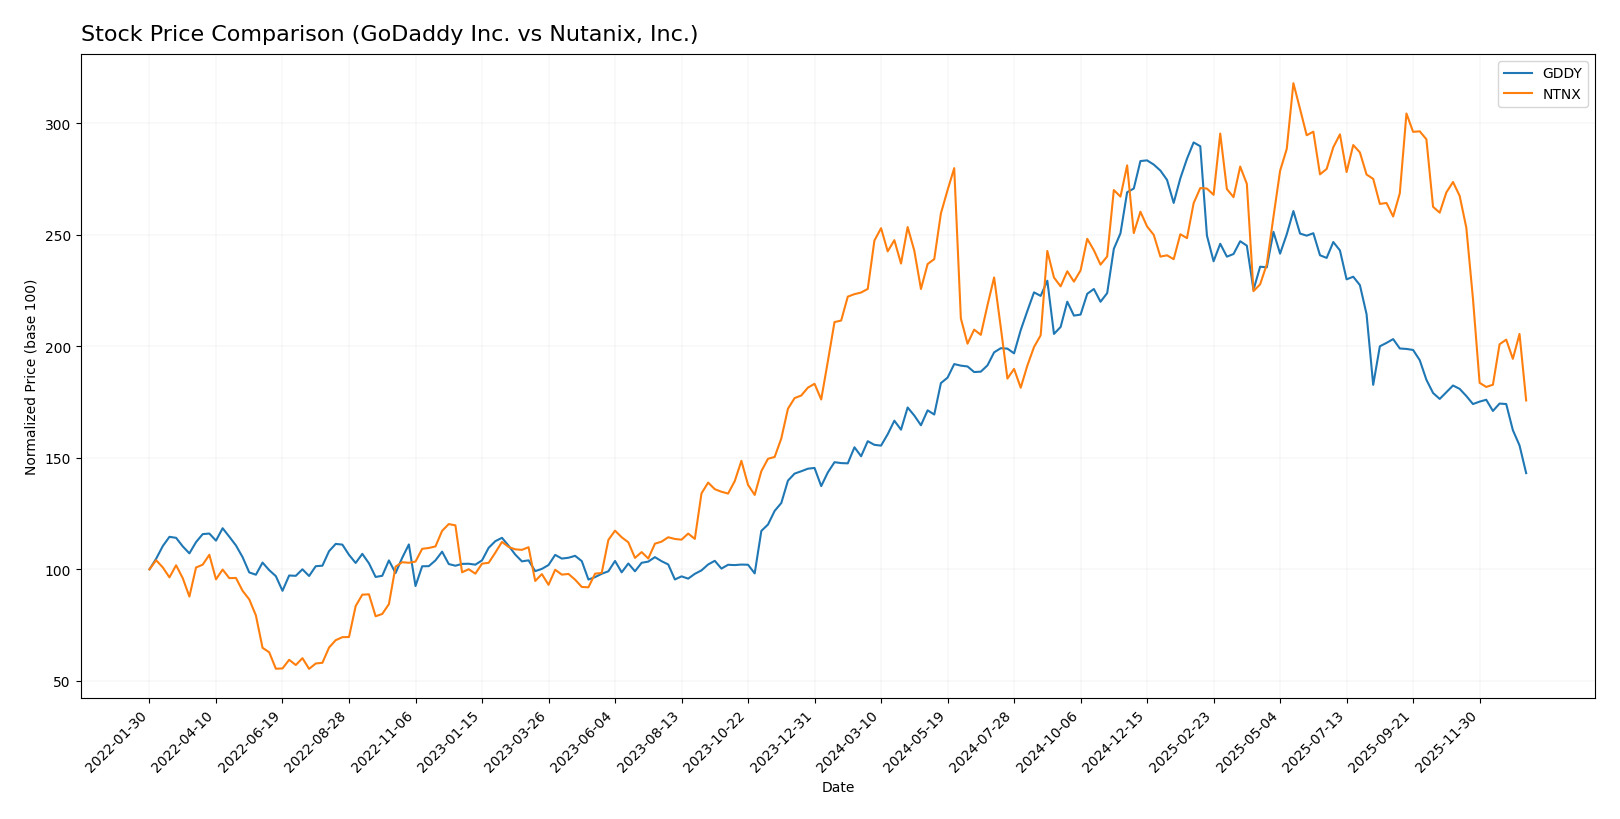
The stock prices of GoDaddy Inc. (GDDY) and Nutanix, Inc. (NTNX) have both trended downward over the past year, with notable deceleration and periods of seller dominance affecting trading dynamics.
Trend Analysis
GoDaddy Inc. experienced a bearish trend over the past 12 months, with a price decline of 9.09%, decelerating from a high of 212.65 to a low of 104.46, and exhibiting high volatility with a 27.35 standard deviation.
Nutanix, Inc. showed a stronger bearish trend over the same period, with a 22.16% price decrease, deceleration in trend, and lower volatility than GoDaddy at 8.67 standard deviation, moving between 82.77 and 45.74.
Comparing the two, GoDaddy’s stock outperformed Nutanix, delivering a smaller price decline and higher volatility, indicating relatively better market performance over the past year.
Target Prices
The current analyst consensus provides a clear outlook on target prices for GoDaddy Inc. and Nutanix, Inc.
| Company | Target High | Target Low | Consensus |
|---|---|---|---|
| GoDaddy Inc. | 182 | 70 | 143.33 |
| Nutanix, Inc. | 90 | 53 | 64.67 |
Analysts expect GoDaddy’s stock to rise significantly above its current price of 104.46 USD, while Nutanix shares show moderate upside potential from the present 45.74 USD price point.
Analyst Opinions Comparison
This section compares analysts’ ratings and grades for GoDaddy Inc. and Nutanix, Inc.:
Rating Comparison
GoDaddy Inc. Rating
- Rating: B+, indicating a very favorable overall evaluation of the company’s financials.
- Discounted Cash Flow Score: 5, showing very favorable future cash flow projections.
- ROE Score: 5, reflecting very efficient profit generation from shareholders’ equity.
- ROA Score: 4, demonstrating favorable asset utilization to generate earnings.
- Debt To Equity Score: 1, representing very unfavorable financial risk due to high debt.
- Overall Score: 3, a moderate summary measure of financial standing.
Nutanix, Inc. Rating
- Rating: C+, also marked as very favorable, but with a lower overall score than GoDaddy.
- Discounted Cash Flow Score: 4, indicating favorable valuation based on cash flow.
- ROE Score: 1, signaling very unfavorable efficiency in generating shareholder returns.
- ROA Score: 4, similarly favorable asset utilization performance.
- Debt To Equity Score: 1, also very unfavorable, indicating similar financial risk.
- Overall Score: 2, a moderate but lower overall financial assessment than GoDaddy.
Which one is the best rated?
Based strictly on the provided data, GoDaddy holds a higher rating (B+ vs. C+) and superior scores in discounted cash flow and return on equity, while both face very unfavorable debt-to-equity scores. Overall, GoDaddy is better rated.
Scores Comparison
Here is a comparison of the Altman Z-Score and Piotroski Score for GoDaddy Inc. and Nutanix, Inc.:
GoDaddy Inc. Scores
- Altman Z-Score: 1.53, indicates financial distress.
- Piotroski Score: 8, classified as very strong.
Nutanix, Inc. Scores
- Altman Z-Score: 1.48, indicates financial distress.
- Piotroski Score: 6, classified as average.
Which company has the best scores?
GoDaddy has a slightly higher Altman Z-Score but both are in distress. GoDaddy’s Piotroski Score is stronger at 8 versus Nutanix’s 6, indicating better financial health for GoDaddy based on these metrics.
Grades Comparison
Here is a detailed comparison of the grades assigned to GoDaddy Inc. and Nutanix, Inc.:
GoDaddy Inc. Grades
The table below shows recent reliable grades from established financial institutions for GoDaddy Inc.:
| Grading Company | Action | New Grade | Date |
|---|---|---|---|
| Morgan Stanley | Maintain | Equal Weight | 2026-01-15 |
| Cantor Fitzgerald | Maintain | Neutral | 2026-01-08 |
| Jefferies | Maintain | Hold | 2026-01-05 |
| B. Riley Securities | Maintain | Buy | 2025-10-31 |
| Evercore ISI Group | Maintain | In Line | 2025-10-31 |
| Benchmark | Maintain | Buy | 2025-10-31 |
| JP Morgan | Maintain | Overweight | 2025-10-31 |
| Citigroup | Maintain | Buy | 2025-10-31 |
| UBS | Maintain | Neutral | 2025-10-31 |
| Wells Fargo | Maintain | Equal Weight | 2025-10-06 |
The grades for GoDaddy Inc. show a mixed but generally positive trend with multiple buy and overweight ratings alongside hold and neutral grades.
Nutanix, Inc. Grades
The table below shows recent reliable grades from established financial institutions for Nutanix, Inc.:
| Grading Company | Action | New Grade | Date |
|---|---|---|---|
| Barclays | Downgrade | Equal Weight | 2026-01-15 |
| Morgan Stanley | Downgrade | Equal Weight | 2026-01-12 |
| RBC Capital | Maintain | Outperform | 2026-01-05 |
| Goldman Sachs | Maintain | Buy | 2025-11-28 |
| JP Morgan | Maintain | Overweight | 2025-11-26 |
| Needham | Maintain | Buy | 2025-11-26 |
| Wells Fargo | Maintain | Equal Weight | 2025-11-26 |
| Morgan Stanley | Maintain | Overweight | 2025-11-26 |
| Keybanc | Maintain | Overweight | 2025-11-26 |
| Piper Sandler | Maintain | Overweight | 2025-11-26 |
Nutanix, Inc. shows a slight recent downgrade trend with latest ratings moving to equal weight, despite several buy and overweight ratings maintained in late 2025.
Which company has the best grades?
Both companies hold a “Buy” consensus rating, but GoDaddy Inc. has a broader range of buy and overweight grades consistently maintained recently. Nutanix, Inc. has experienced some recent downgrades to equal weight, which may indicate a more cautious outlook from rating firms. Investors should note these trends as part of their overall risk assessment.
Strengths and Weaknesses
Below is a comparison of key strengths and weaknesses for GoDaddy Inc. (GDDY) and Nutanix, Inc. (NTNX) based on the most recent data.
| Criterion | GoDaddy Inc. (GDDY) | Nutanix, Inc. (NTNX) |
|---|---|---|
| Diversification | Strong diversification with Core Platform ($2.92B) and Applications & Commerce ($1.65B) segments | Revenue mainly from Subscription ($2.02B) and Professional Services ($0.10B) |
| Profitability | High net margin 20.5%, ROIC 16.0%, and strong ROE 135.4% | Moderate net margin 7.4%, ROIC 8.1%, but negative ROE -27.1% |
| Innovation | Consistent growth in ROIC (+147%), showing efficient capital use and innovation | Growing ROIC (+117%), signaling improving innovation and capital efficiency |
| Global presence | Established global platform for online presence and commerce | Growing international cloud infrastructure presence but less diversified |
| Market Share | Strong market share in domain registration and hosting markets | Niche market leader in hybrid cloud software with growing share |
Key takeaways: GoDaddy leads with strong profitability, diversification, and a durable competitive moat, making it a value creator with efficient capital use. Nutanix shows promising growth and innovation but faces challenges in profitability and market breadth. Investors should weigh GoDaddy’s stability against Nutanix’s growth potential and risks.
Risk Analysis
Below is a comparison table outlining the key risks for GoDaddy Inc. and Nutanix, Inc. based on the most recent data available in 2026.
| Metric | GoDaddy Inc. (GDDY) | Nutanix, Inc. (NTNX) |
|---|---|---|
| Market Risk | Moderate; beta 0.95 suggests near-market volatility sensitivity | Lower; beta 0.49 indicates less sensitivity to market swings |
| Debt level | High leverage; debt-to-equity ratio 5.63 (unfavorable) with 47% debt-to-assets | Moderate; negative debt-to-equity (-2.14) due to accounting, 45% debt-to-assets (neutral) |
| Regulatory Risk | Moderate; operates globally in cloud services with evolving data/privacy laws | Moderate; cloud infrastructure subject to global regulations and compliance risks |
| Operational Risk | Medium; reliance on cloud infrastructure and security services | Medium-high; complex enterprise cloud products and virtualization services |
| Environmental Risk | Low; primarily software-based with limited direct environmental impact | Low; software and cloud platform business model minimizes environmental footprint |
| Geopolitical Risk | Moderate; international presence exposes to trade and policy risks | Moderate; global operations in multiple regions with geopolitical exposure |
In synthesis, the most impactful risks are GoDaddy’s high leverage and Nutanix’s operational complexity. Both face moderate regulatory and geopolitical risks given their global technology footprints. GoDaddy’s financial distress signals warrant caution despite strong profitability, while Nutanix’s lower market beta and moderate debt profile indicate relatively lower market risk but operational challenges.
Which Stock to Choose?
GoDaddy Inc. (GDDY) shows a favorable income evolution with strong profitability and a very favorable moat due to growing ROIC above WACC. Despite favorable returns on equity and assets, its financial ratios reveal mixed signals with significant debt and low liquidity, leading to a neutral global ratios opinion. The company holds a very favorable B+ rating but faces distress signals in its Altman Z-score.
Nutanix, Inc. (NTNX) displays a favorable income statement with solid revenue and net income growth, supported by a slightly favorable global ratios evaluation and a very favorable moat status. However, profitability is weaker, reflected in a negative ROE and moderate returns on invested capital. NTNX has a moderate rating C+ and also shows financial distress per its Altman Z-score, albeit with better liquidity and lower leverage metrics than GDDY.
Investors focused on sustainable profitability and value creation may find GoDaddy’s durable competitive advantage and strong income growth appealing, while those prioritizing liquidity and growth dynamics might consider Nutanix’s improving financials and slightly favorable ratios. Both stocks present risks, as suggested by their distress zone Altman scores, indicating a need for cautious evaluation aligned with individual risk tolerance and investment strategy.
Disclaimer: Investment carries a risk of loss of initial capital. The past performance is not a reliable indicator of future results. Be sure to understand risks before making an investment decision.
Go Further
I encourage you to read the complete analyses of GoDaddy Inc. and Nutanix, Inc. to enhance your investment decisions: