Home > Comparison > Financial Services > PRU vs GL
The strategic rivalry between Prudential Financial, Inc. and Globe Life Inc. shapes the competitive landscape of the life insurance industry. Prudential operates as a diversified financial services powerhouse with global reach and multiple business segments. Globe Life focuses on targeted life and supplemental health insurance for middle-income households. This analysis will assess which company’s operational model offers superior risk-adjusted returns for a diversified portfolio in today’s evolving market environment.

Table of contents
Companies Overview
Prudential Financial and Globe Life hold pivotal roles in the U.S. life insurance market, serving diverse customer segments with tailored financial products.
Prudential Financial, Inc.: Diversified Global Financial Services Leader
Prudential Financial commands a broad market presence through insurance, investment management, and retirement services. Its core revenue stems from eight business segments, including PGIM and Group Insurance. In 2026, Prudential focuses on expanding institutional asset management and enhancing digital distribution channels to capture affluent and mass affluent clients internationally.
Globe Life Inc.: Focused Provider of Life and Supplemental Insurance
Globe Life targets the lower middle to middle income U.S. households with life, health, and annuity products. Its revenue relies heavily on whole and term life insurance sales supported by supplemental health and Medicare products. Its 2026 strategy emphasizes growing its core life insurance base and diversifying through annuities and supplemental health offerings.
Strategic Collision: Similarities & Divergences
Prudential and Globe Life both operate in life insurance but diverge sharply in scope and clientele. Prudential pursues a diversified, global, and affluent-focused model, while Globe Life emphasizes a concentrated, U.S.-centric approach serving middle-income consumers. Their primary battleground is customer segmentation, where Prudential leverages scale and digital innovation, and Globe Life relies on niche market penetration. These differences shape their distinct risk-return profiles and competitive moats.
Income Statement Comparison
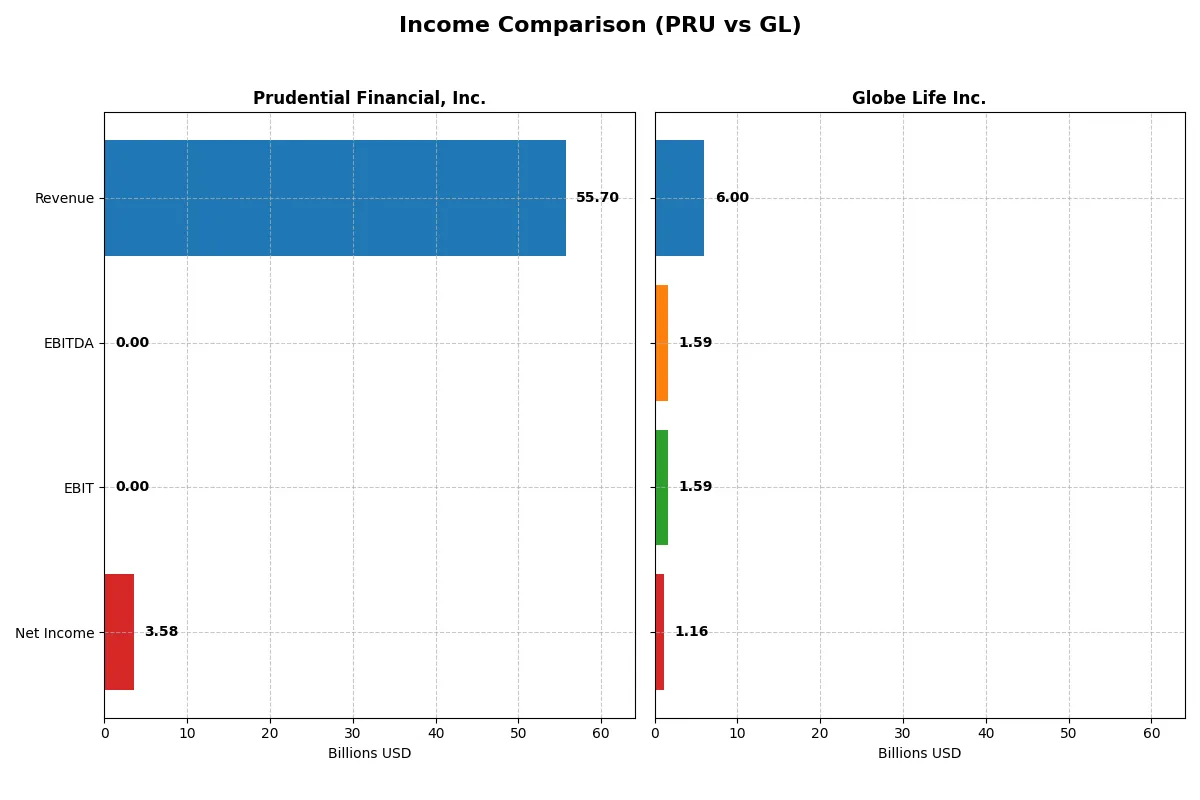
This data dissects the core profitability and scalability of both corporate engines to reveal who dominates the bottom line:
| Metric | Prudential Financial, Inc. (PRU) | Globe Life Inc. (GL) |
|---|---|---|
| Revenue | 55.7B | 6.0B |
| Cost of Revenue | 0 | 4.0B |
| Operating Expenses | 6.8B | 541M |
| Gross Profit | 55.7B | 2.0B |
| EBITDA | 0 | 1.6B |
| EBIT | 0 | 1.6B |
| Interest Expense | 2.1B | 141M |
| Net Income | 3.6B | 1.2B |
| EPS | 10.16 | 14.3 |
| Fiscal Year | 2025 | 2025 |
Income Statement Analysis: The Bottom-Line Duel
This income statement comparison reveals which company runs the most efficient and profitable corporate engine through recent market cycles.
Prudential Financial, Inc. Analysis
Prudential’s revenue fell sharply by 21% from 2024 to 2025, yet net income rebounded 32% to $3.6B, reflecting improved net margin at 6.4%. Despite a volatile top line, gross margin stayed at a perfect 100%, signaling strong cost control. However, operating income dropped to zero, indicating pressure on core earnings.
Globe Life Inc. Analysis
Globe Life shows steady revenue growth of nearly 4% in 2025, reaching $6B, with net income rising 8% to $1.16B. Its gross margin at 33.4% and net margin at 19.4% demonstrate consistent profitability and operational leverage. EBIT margin improved to 26.5%, highlighting efficient expense management and growing earnings momentum.
Margin Resilience vs. Growth Stability
Prudential exhibits a strong gross margin but struggles with operating earnings and revenue contraction, undermining its bottom-line growth. Globe Life presents balanced top-line expansion with solid net and EBIT margins. For investors prioritizing sustained profitability and steady earnings growth, Globe Life’s profile currently appears more attractive.
Financial Ratios Comparison
These vital ratios act as a diagnostic tool to expose the underlying fiscal health, valuation premiums, and capital efficiency of the companies compared:
| Ratios | Prudential Financial, Inc. (PRU) | Globe Life Inc. (GL) |
|---|---|---|
| ROE | 11.02% | 20.18% |
| ROIC | 0.66% | 14.35% |
| P/E | 11.10 | 9.74 |
| P/B | 1.22 | 0 (not reported) |
| Current Ratio | 0 (not reported) | 0.80 |
| Quick Ratio | 0 (not reported) | 0.80 |
| D/E (Debt-to-Equity) | 0.63 | 0 (not reported) |
| Debt-to-Assets | 2.62% | 0 (not reported) |
| Interest Coverage | 3.15 | 10.36 |
| Asset Turnover | 0.07 | 0 (not reported) |
| Fixed Asset Turnover | 0 (not reported) | 0 (not reported) |
| Payout Ratio | 53.12% | 7.31% |
| Dividend Yield | 4.78% | 0.75% |
| Fiscal Year | 2025 | 2025 |
Efficiency & Valuation Duel: The Vital Signs
Financial ratios serve as a company’s DNA, uncovering hidden risks and pinpointing operational strengths essential for investment decisions.
Prudential Financial, Inc.
Prudential shows a moderate ROE of 11.02% and a net margin of 6.42%, reflecting steady profitability. Its P/E ratio of 11.1 and P/B of 1.22 indicate a fairly valued stock. The company delivers a solid 4.78% dividend yield, rewarding shareholders amid reinvestment challenges signaled by a low ROIC of 0.66%.
Globe Life Inc.
Globe Life posts a strong net margin at 19.36%, but reports no ROE or ROIC values, clouding profitability assessment. Its P/E of 9.74 suggests an attractive valuation. Despite a low 0.75% dividend yield, low debt levels and high interest coverage of 11.27 signal financial stability. The absence of liquidity ratios requires caution.
Valuation and Profitability: Balanced Yield vs. High Margin with Caveats
Prudential offers balanced profitability and a rewarding dividend but struggles with capital efficiency. Globe Life boasts higher margins and better interest coverage but lacks clarity on returns and liquidity. Prudential fits income-focused investors, while Globe Life suits those prioritizing margin strength and financial safety.
Which one offers the Superior Shareholder Reward?
I compare Prudential Financial, Inc. (PRU) and Globe Life Inc. (GL) on dividend yield, payout ratios, and buybacks to assess shareholder reward. PRU yields ~4.8% with a 53% payout ratio, supporting a robust dividend well-covered by free cash flow. It also maintains moderate buybacks, enhancing returns sustainably. GL yields under 1%, with a low 7–9% payout ratio, prioritizing growth and acquisitions over dividends. Its buybacks are minimal, limiting immediate shareholder returns. Historically, I observe that PRU’s balanced dividend and buyback approach offers steadier long-term total return than GL’s growth-heavy model. In 2026, I favor PRU for superior shareholder reward given its sustainable distributions and capital allocation discipline.
Comparative Score Analysis: The Strategic Profile
The radar chart reveals the fundamental DNA and trade-offs of Prudential Financial, Inc. and Globe Life Inc., highlighting their financial strengths and vulnerabilities:
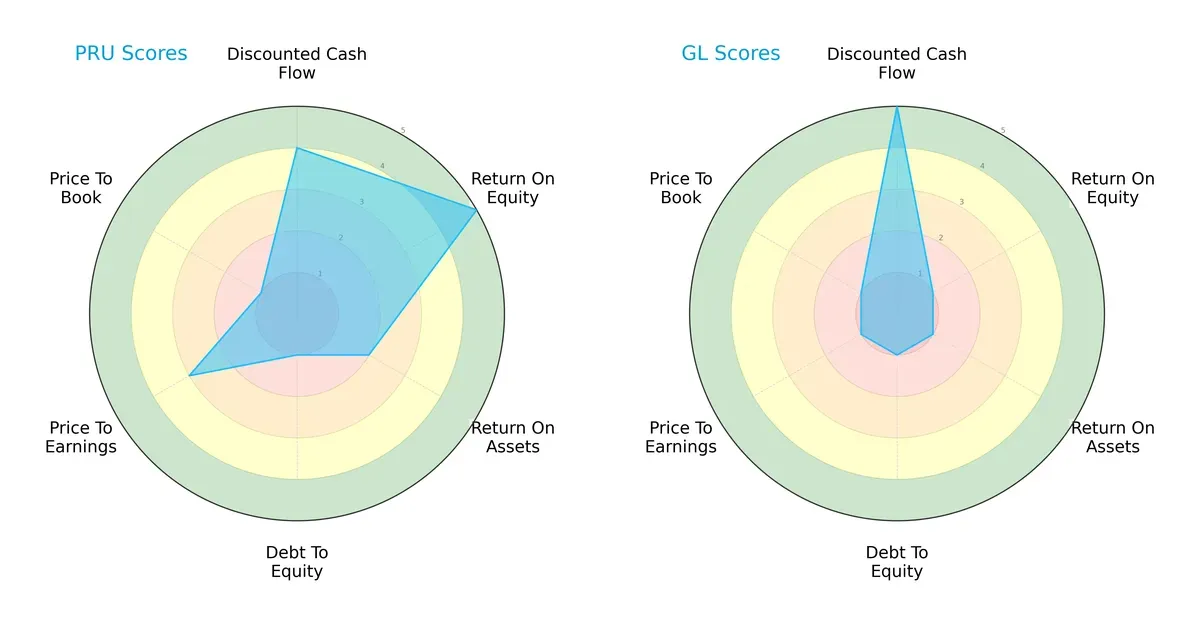
Prudential shows a more balanced profile with strong ROE (5) and moderate DCF (4) scores, but suffers from weak debt management and valuation metrics. Globe Life excels in DCF (5) but lags significantly in profitability and valuation, relying heavily on cash flow strength. Prudential’s diversified strengths contrast with Globe Life’s dependence on discounted cash flow.
Bankruptcy Risk: Solvency Showdown
Both companies fall in the distress zone per Altman Z-Scores, signaling elevated bankruptcy risk in this cycle:
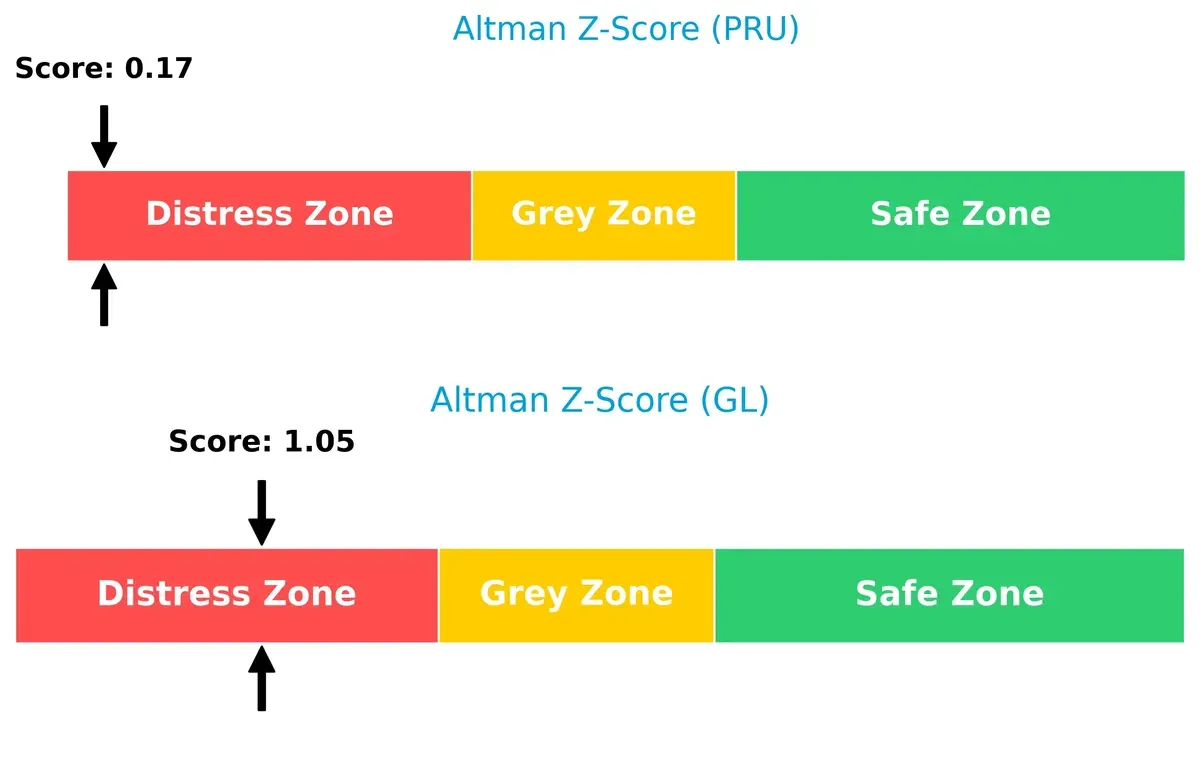
Prudential’s score (0.17) is lower than Globe Life’s (1.05), indicating a more precarious solvency position. Historically, such low Z-scores warn investors to monitor liquidity and leverage closely.
Financial Health: Quality of Operations
Prudential leads with a strong Piotroski F-Score of 7, while Globe Life’s average score of 5 raises caution:
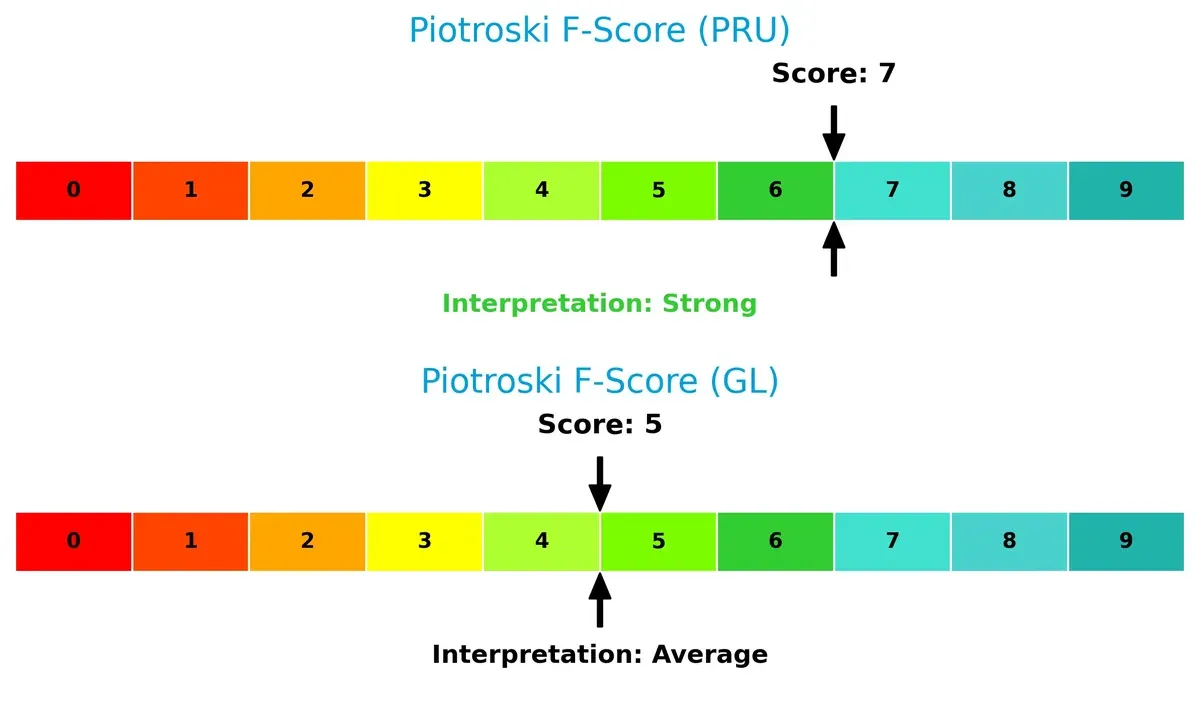
Prudential’s higher score reflects better profitability, liquidity, and operational efficiency, suggesting fewer internal red flags. Globe Life’s middling score implies moderate financial health but exposes potential weaknesses in internal metrics.
How are the two companies positioned?
This section dissects the operational DNA of PRU and GL by comparing their revenue distribution by segment and internal dynamics. The goal is to confront their economic moats to identify which model offers the most resilient and sustainable competitive advantage today.
Revenue Segmentation: The Strategic Mix
This visual comparison dissects how Prudential Financial, Inc. and Globe Life Inc. diversify their income streams and where their primary sector bets lie:
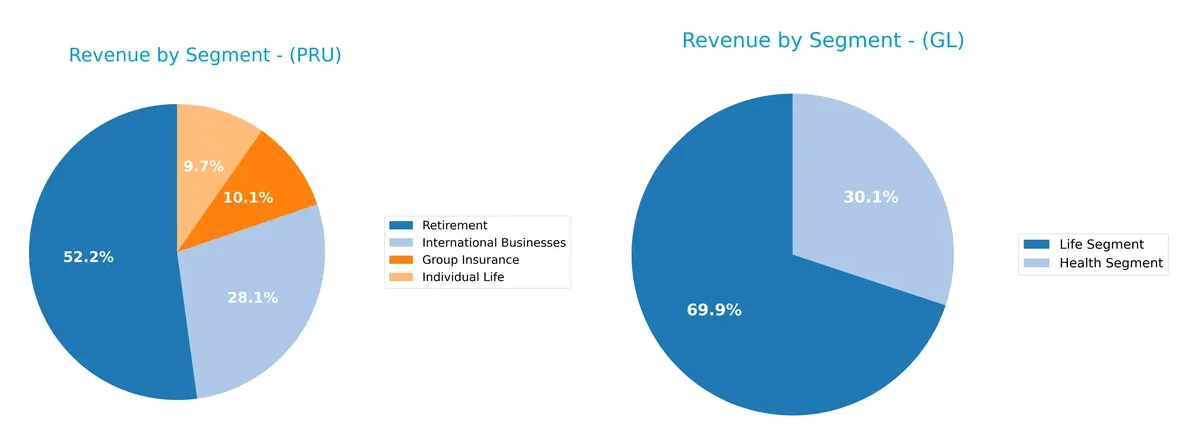
Prudential Financial leans on a broad portfolio, with Retirement at $33.3B and International Businesses at $17.9B anchoring its diverse mix. Globe Life relies heavily on Life Segment revenue, $3.3B, which dwarfs its Health Segment at $1.4B. Prudential’s diversified approach mitigates concentration risk and leverages global infrastructure. Globe Life’s concentrated Life focus signals ecosystem lock-in but heightens vulnerability to sector-specific headwinds.
Strengths and Weaknesses Comparison
This table compares the Strengths and Weaknesses of Prudential Financial, Inc. and Globe Life Inc.:
Prudential Financial, Inc. Strengths
- Diverse revenue streams across International, Retirement, Group Insurance, and Individual Life segments
- Strong global presence with significant US and Japanese markets
- Favorable PE of 11.1 and PB of 1.22 indicating reasonable valuation
- Dividend yield at 4.78% supports income investors
Globe Life Inc. Strengths
- High net margin at 19.36% indicates strong profitability
- Favorable PE of 9.74 and PB of 0 suggest undervaluation
- Excellent interest coverage at 11.27 supports debt servicing
- Low debt-to-equity and debt-to-assets ratios reflect conservative leverage
Prudential Financial, Inc. Weaknesses
- Unfavorable ROIC of 0.66% below WACC of 8.3% signals weak capital returns
- Current and quick ratios at 0 indicate liquidity concerns
- Interest coverage at 0 raises risk on debt obligations
- Low asset and fixed asset turnover reflect operational inefficiency
Globe Life Inc. Weaknesses
- Return on equity and ROIC unavailable or zero, limiting profitability insights
- Current and quick ratios at 0 highlight liquidity risks
- Dividend yield low at 0.75% may deter income-focused investors
- Asset and fixed asset turnover reported as zero suggest inefficiencies
Both companies display slightly unfavorable financial ratio profiles with Prudential showing broader diversification and global reach. Globe Life excels in profitability metrics but has limited liquidity and capital return transparency. These factors shape each firm’s strategic positioning and risk exposure.
The Moat Duel: Analyzing Competitive Defensibility
A structural moat is the only reliable shield protecting long-term profits from competitive erosion in any sector:
Prudential Financial, Inc.: Diversified Global Reach & Brand Strength
Prudential leverages extensive international footprint and brand recognition as its moat. Its financials show margin stability but declining ROIC signals weakening capital efficiency. Expansion in Asia faces geopolitical risks in 2026.
Globe Life Inc.: Focused Market Niche & Operational Efficiency
Globe Life’s moat rests on a focused product mix targeting middle-income Americans with low-cost operations. Its rising ROIC and strong margin expansion prove robust competitiveness, positioning well for steady growth and new product launches.
Moat Battle: Global Diversification vs. Niche Focus
Prudential’s broad diversification offers scale but suffers from deteriorating capital returns, while Globe Life’s niche focus delivers higher operational efficiency and improving ROIC. Globe Life holds the deeper moat and is better equipped to defend market share in 2026.
Which stock offers better returns?
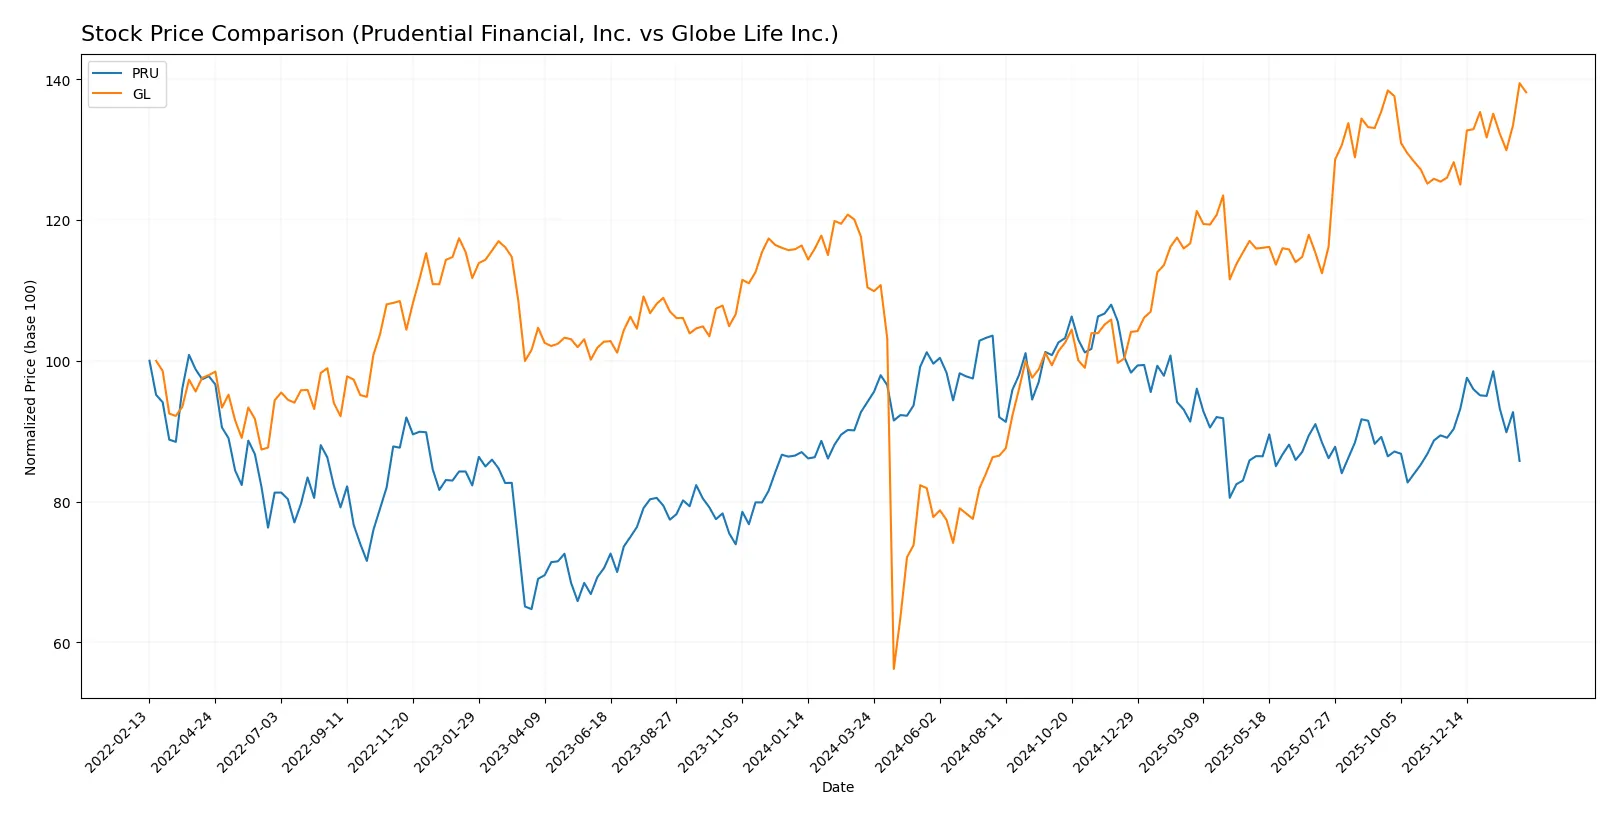
Over the past 12 months, Prudential Financial, Inc. (PRU) experienced a bearish trend with price declines and decelerating momentum. Globe Life Inc. (GL) showed a strong bullish trend with accelerating gains and higher volatility.
Trend Comparison
Prudential Financial’s stock declined 8.9% over the past year, showing a bearish trend with decelerating price movement and moderate volatility (7.72 std deviation). Recent months confirmed further weakness with a -3.7% change.
Globe Life’s stock rose 25.7% over the past year, evidencing a bullish trend with accelerating gains and elevated volatility (20.32 std deviation). Recent performance remained strong, gaining 7.73%.
Globe Life outperformed Prudential Financial, delivering the highest market returns and sustained positive momentum over the 12-month period.
Target Prices
Analysts present a bullish consensus for Prudential Financial, Inc. and Globe Life Inc., reflecting confidence in their growth prospects.
| Company | Target Low | Target High | Consensus |
|---|---|---|---|
| Prudential Financial, Inc. | 110 | 126 | 118.43 |
| Globe Life Inc. | 158 | 176 | 167 |
The target consensus for Prudential sits about 15% above its current price of 102.68, signaling upside potential. Globe Life’s consensus target exceeds its 146.11 stock price by around 14%, indicating similar positive analyst expectations.

Don’t Let Luck Decide Your Entry Point
Optimize your entry points with our advanced ProRealTime indicators. You’ll get efficient buy signals with precise price targets for maximum performance. Start outperforming now!
How do institutions grade them?
This section summarizes the latest institutional grades for Prudential Financial, Inc. and Globe Life Inc.:
Prudential Financial, Inc. Grades
The table below shows recent grades from major financial institutions for Prudential Financial, Inc.
| Grading Company | Action | New Grade | Date |
|---|---|---|---|
| Evercore ISI Group | Maintain | In Line | 2026-02-05 |
| JP Morgan | Maintain | Neutral | 2026-02-04 |
| Wells Fargo | Maintain | Equal Weight | 2026-01-13 |
| UBS | Maintain | Neutral | 2026-01-08 |
| Piper Sandler | Maintain | Neutral | 2025-12-23 |
| Keefe, Bruyette & Woods | Maintain | Market Perform | 2025-11-03 |
| Evercore ISI Group | Maintain | In Line | 2025-10-30 |
| Barclays | Maintain | Equal Weight | 2025-10-08 |
| Morgan Stanley | Maintain | Equal Weight | 2025-10-07 |
| Morgan Stanley | Maintain | Equal Weight | 2025-08-18 |
Globe Life Inc. Grades
The following table lists recent grades from recognized institutions for Globe Life Inc.
| Grading Company | Action | New Grade | Date |
|---|---|---|---|
| Truist Securities | Maintain | Buy | 2026-02-06 |
| JP Morgan | Maintain | Overweight | 2026-02-05 |
| TD Cowen | Maintain | Buy | 2025-12-11 |
| Morgan Stanley | Maintain | Overweight | 2025-11-17 |
| Keefe, Bruyette & Woods | Maintain | Outperform | 2025-10-28 |
| Wells Fargo | Maintain | Overweight | 2025-10-24 |
| Truist Securities | Maintain | Buy | 2025-10-24 |
| Wells Fargo | Maintain | Overweight | 2025-10-08 |
| Morgan Stanley | Maintain | Overweight | 2025-08-18 |
| Morgan Stanley | Upgrade | Overweight | 2025-08-05 |
Which company has the best grades?
Globe Life Inc. has consistently received stronger grades, including multiple “Buy” and “Overweight” ratings. Prudential Financial, Inc.’s grades cluster around “Neutral” and “Equal Weight.” This suggests Globe Life is viewed more favorably by analysts, potentially influencing investor confidence and portfolio positioning.
Risks specific to each company
The following categories identify the critical pressure points and systemic threats facing both firms in the 2026 market environment:
1. Market & Competition
Prudential Financial, Inc.
- Faces intense competition in diversified insurance and asset management sectors; larger scale offers some resilience.
Globe Life Inc.
- Focuses on lower to middle income segments with less diversification, vulnerable to niche market shifts.
2. Capital Structure & Debt
Prudential Financial, Inc.
- Moderate debt-to-equity ratio (0.63) but low interest coverage signals potential financial strain.
Globe Life Inc.
- Virtually no debt reported, strong interest coverage at 11.27, indicating solid financial stability.
3. Stock Volatility
Prudential Financial, Inc.
- Beta near 1 (0.951) shows market-aligned volatility; average daily volume high, aiding liquidity.
Globe Life Inc.
- Low beta (0.464) suggests defensive stock behavior; lower trading volume may impact liquidity.
4. Regulatory & Legal
Prudential Financial, Inc.
- Operates internationally, facing complex regulatory environments and compliance costs.
Globe Life Inc.
- Primarily US-focused, subject to domestic insurance regulations but with less geographic regulatory risk.
5. Supply Chain & Operations
Prudential Financial, Inc.
- Large employee base (37,936) and broad operations increase operational complexity and risk.
Globe Life Inc.
- Smaller workforce (3,732) and focused product lines simplify operations but limit scale benefits.
6. ESG & Climate Transition
Prudential Financial, Inc.
- Global presence pressures ESG compliance; asset management segment faces climate-related investment risks.
Globe Life Inc.
- Limited disclosure; smaller scale may delay ESG transition but less exposed to global climate mandates.
7. Geopolitical Exposure
Prudential Financial, Inc.
- International businesses expose Prudential to currency, political, and economic risks abroad.
Globe Life Inc.
- US-centric operations reduce geopolitical risk but increase vulnerability to domestic policy shifts.
Which company shows a better risk-adjusted profile?
Prudential’s largest risk is its precarious capital structure, indicated by low interest coverage despite moderate leverage. Globe Life’s key risk lies in its concentrated market focus and lower profitability efficiency. I see Globe Life’s clean balance sheet and strong interest coverage as advantages, but Prudential’s scale and diversification offer a buffer. The distress zone Altman Z-scores for both highlight financial fragility, yet Prudential’s stronger Piotroski score suggests better underlying fundamentals. Overall, Globe Life presents a safer capital profile but Prudential shows more operational resilience amid sector volatility.
Final Verdict: Which stock to choose?
Prudential Financial, Inc. (PRU) shines as a cash-generating powerhouse with a solid dividend yield, appealing to income-focused investors. Its key point of vigilance is the declining return on invested capital, signaling efficiency challenges. PRU suits portfolios seeking steady income with moderate growth exposure.
Globe Life Inc. (GL) boasts a strategic moat in its consistent operating profitability and disciplined cost management, which drives superior margin expansion. It presents a more dynamic growth profile and better recent price momentum, offering a safer harbor relative to PRU’s operational headwinds. GL fits well in GARP (Growth at a Reasonable Price) portfolios.
If you prioritize income stability and a proven capital return track record, PRU is the compelling choice due to its reliable dividend and valuation appeal. However, if you seek stronger growth potential paired with operational efficiency, GL offers better stability and momentum, despite a thinner yield. Both stocks carry risks; your choice depends on your portfolio’s risk tolerance and income-growth balance.
Disclaimer: Investment carries a risk of loss of initial capital. The past performance is not a reliable indicator of future results. Be sure to understand risks before making an investment decision.
Go Further
I encourage you to read the complete analyses of Prudential Financial, Inc. and Globe Life Inc. to enhance your investment decisions: