Home > Comparison > Financial Services > MET vs GL
The competitive dynamic between MetLife, Inc. and Globe Life Inc. shapes the life insurance industry’s evolution. MetLife operates as a diversified financial services powerhouse with a global footprint, while Globe Life focuses on targeted life and supplemental health insurance for middle-income U.S. households. This head-to-head contrasts broad diversification against niche specialization. This analysis aims to identify which strategy delivers superior risk-adjusted returns for a balanced investment portfolio.

Table of contents
Companies Overview
MetLife and Globe Life hold pivotal roles in the U.S. life insurance market, each targeting distinct customer bases.
MetLife, Inc.: Global Financial Services Leader
MetLife dominates as a global insurer offering life, disability, and annuity products across multiple continents. Its revenue engine is diversified through five geographic segments and a broad product lineup, including pension risk transfers and longevity reinsurance. In 2026, MetLife strategically emphasizes expanding asset management and institutional income annuities to leverage its scale and international footprint.
Globe Life Inc.: Focused U.S. Insurance Provider
Globe Life specializes as a U.S.-centric insurer targeting lower to middle-income households with whole life, term life, and supplemental health insurance. Its core revenue derives from life insurance and annuities designed for affordability and accessibility. In 2026, Globe Life concentrates on broadening its supplemental health insurance and annuity offerings to deepen penetration in its niche market.
Strategic Collision: Similarities & Divergences
MetLife and Globe Life contrast sharply in scale and strategy; MetLife pursues a diversified global presence while Globe Life opts for a focused domestic niche. Both compete primarily in the life insurance and annuity spaces but serve different customer segments and risk profiles. Their distinct investment appeal lies in MetLife’s global diversification versus Globe Life’s targeted, income-focused business model.
Income Statement Comparison
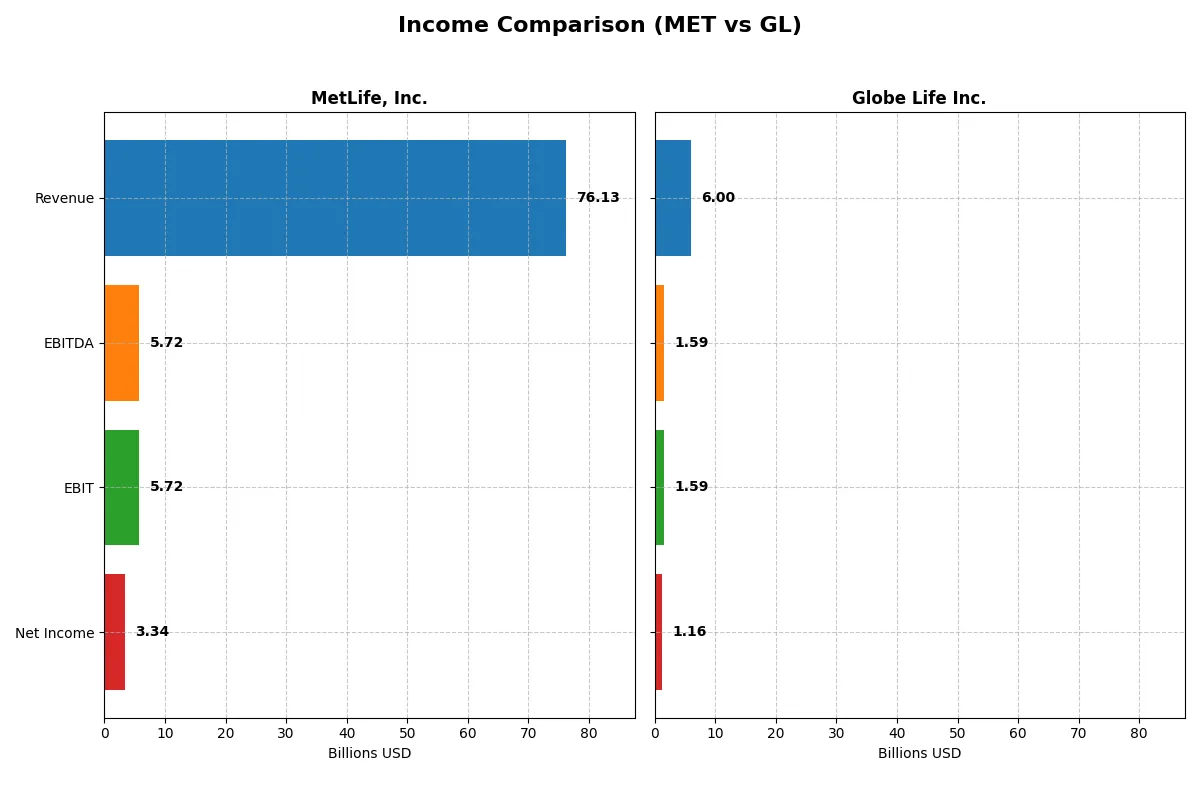
This data dissects the core profitability and scalability of both corporate engines to reveal who dominates the bottom line:
| Metric | MetLife, Inc. (MET) | Globe Life Inc. (GL) |
|---|---|---|
| Revenue | 76.1B | 6.0B |
| Cost of Revenue | 58.8B | 4.0B |
| Operating Expenses | 12.4B | 541M |
| Gross Profit | 17.3B | 2.0B |
| EBITDA | 5.7B | 1.6B |
| EBIT | 5.7B | 1.6B |
| Interest Expense | 1.1B | 141M |
| Net Income | 3.3B | 1.2B |
| EPS | 4.73 | 14.3 |
| Fiscal Year | 2025 | 2025 |
Income Statement Analysis: The Bottom-Line Duel
This income statement comparison reveals the true efficiency and profitability dynamics of two distinct corporate engines in the insurance sector.
MetLife, Inc. Analysis
MetLife’s revenue climbed steadily to $76.1B in 2025, marking a 20% growth over five years. However, net income fell sharply by over 50%, reaching $3.3B, signaling pressure on profitability. Gross margin contracted to 22.7%, while net margin dropped to 4.4%, reflecting rising expenses and diminished operational efficiency in the latest year.
Globe Life Inc. Analysis
Globe Life’s revenue rose moderately to $6.0B in 2025, showing steady growth. Net income improved by 12.6% over the period, reaching $1.16B, with strong margin gains. Gross margin stood at 33.4%, and net margin at 19.4%, underscoring robust cost control and operational leverage fueling profitability momentum.
Margin Power vs. Revenue Scale
MetLife demonstrates scale with a substantial revenue base but struggles with shrinking margins and net income. Globe Life operates smaller but delivers superior profitability and margin expansion. For investors prioritizing margin strength and earnings growth, Globe Life’s profile offers a more attractive risk-return balance.
Financial Ratios Comparison
These vital ratios act as a diagnostic tool to expose the underlying fiscal health, valuation premiums, and capital efficiency of the companies compared below:
| Ratios | MetLife, Inc. (MET) | Globe Life Inc. (GL) |
|---|---|---|
| ROE | 16.13% (2024) | 20.18% (2024) |
| ROIC | 6.33% (2024) | 14.35% (2024) |
| P/E | 12.75 (2024) | 8.74 (2024) |
| P/B | 2.06 (2024) | 1.76 (2024) |
| Current Ratio | 0 (2024) | 0.80 (2024) |
| Quick Ratio | 0 (2024) | 0.80 (2024) |
| D/E | 0.68 (2024) | 0.52 (2024) |
| Debt-to-Assets | 2.76% (2024) | 9.42% (2024) |
| Interest Coverage | 5.42 (2024) | 10.44 (2024) |
| Asset Turnover | 0.10 (2024) | 0.20 (2024) |
| Fixed Asset Turnover | 37.78 (2024) | 20.27 (2024) |
| Payout Ratio | 39.0% (2024) | 7.9% (2024) |
| Dividend Yield | 3.06% (2024) | 0.91% (2024) |
| Fiscal Year | 2024 | 2024 |
Efficiency & Valuation Duel: The Vital Signs
Financial ratios serve as a company’s DNA, uncovering hidden risks and operational strengths crucial for savvy investors.
MetLife, Inc.
MetLife shows modest profitability with a 4.39% net margin and zero return on equity, signaling weak core returns. Its P/E of 15.7 is neutral, indicating fair valuation. The stock delivers a healthy 2.85% dividend yield, rewarding shareholders while balancing reinvestment. However, several liquidity and efficiency metrics flag caution.
Globe Life Inc.
Globe Life impresses with a strong 19.4% net margin and a favorable P/E of 9.7, suggesting undervaluation relative to earnings. Despite no reported ROE, the company maintains robust interest coverage and low debt ratios. Dividend yield is low at 0.75%, indicating a growth focus or capital retention strategy over payouts.
Operational Strength vs. Valuation Discipline
Both companies face some unfavorable metrics, yet Globe Life offers better profitability and valuation multiples. MetLife’s dividend payout suits income investors, while Globe Life’s margin efficiency and conservative valuation appeal to growth-oriented investors. Each profile fits distinct risk-reward preferences.
Which one offers the Superior Shareholder Reward?
I compare MetLife, Inc. (MET) and Globe Life Inc. (GL) on dividends, payout ratios, and buybacks. MET yields 3.06% in 2025 with a sustainable 39% payout and strong free cash flow coverage. GL yields only 0.75%, with a low 7% payout ratio, favoring reinvestment. MET also supports buybacks, enhancing total returns. GL’s lower yield and minimal buyback activity limit immediate shareholder rewards but suggest growth focus. I see MET’s balanced dividend and buyback strategy as a more attractive total return in 2026.
Comparative Score Analysis: The Strategic Profile
The radar chart reveals the fundamental DNA and trade-offs of both firms across key financial dimensions:
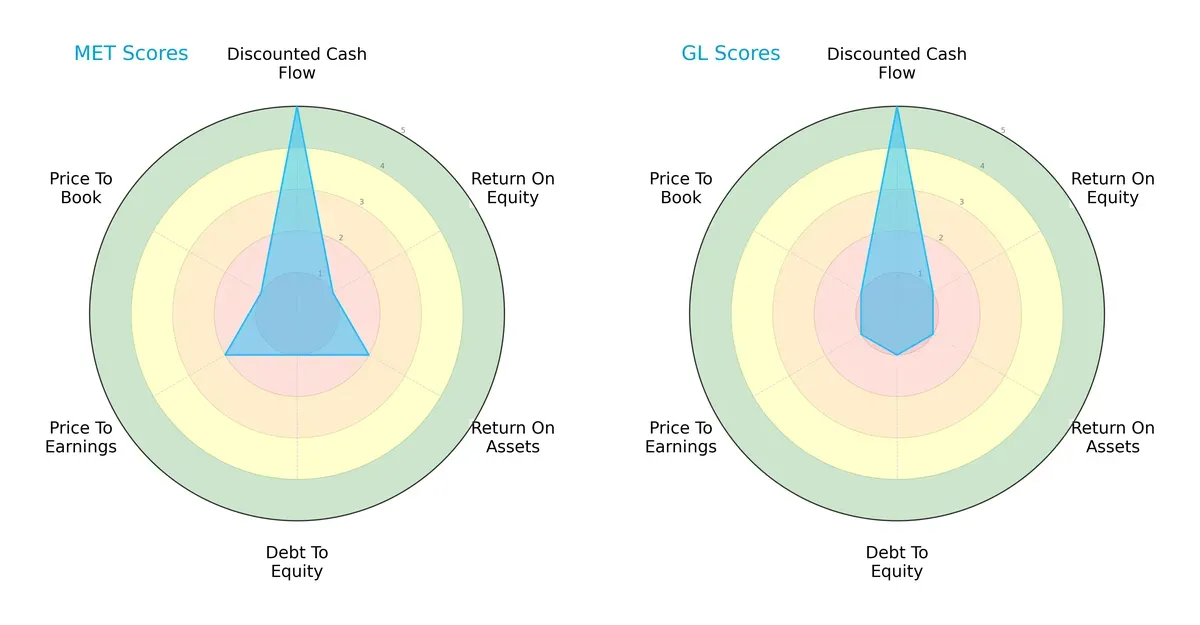
MetLife and Globe Life both score highly on discounted cash flow, indicating strong future cash flow potential. MetLife edges out with a slightly better return on assets, but both struggle on return on equity and face high debt-to-equity risk. Valuation metrics show MetLife has a marginally stronger price-to-earnings score, yet both companies’ price-to-book ratios remain weak. Overall, MetLife presents a somewhat more balanced profile, while Globe Life leans heavily on its cash flow strength despite weaker asset efficiency.
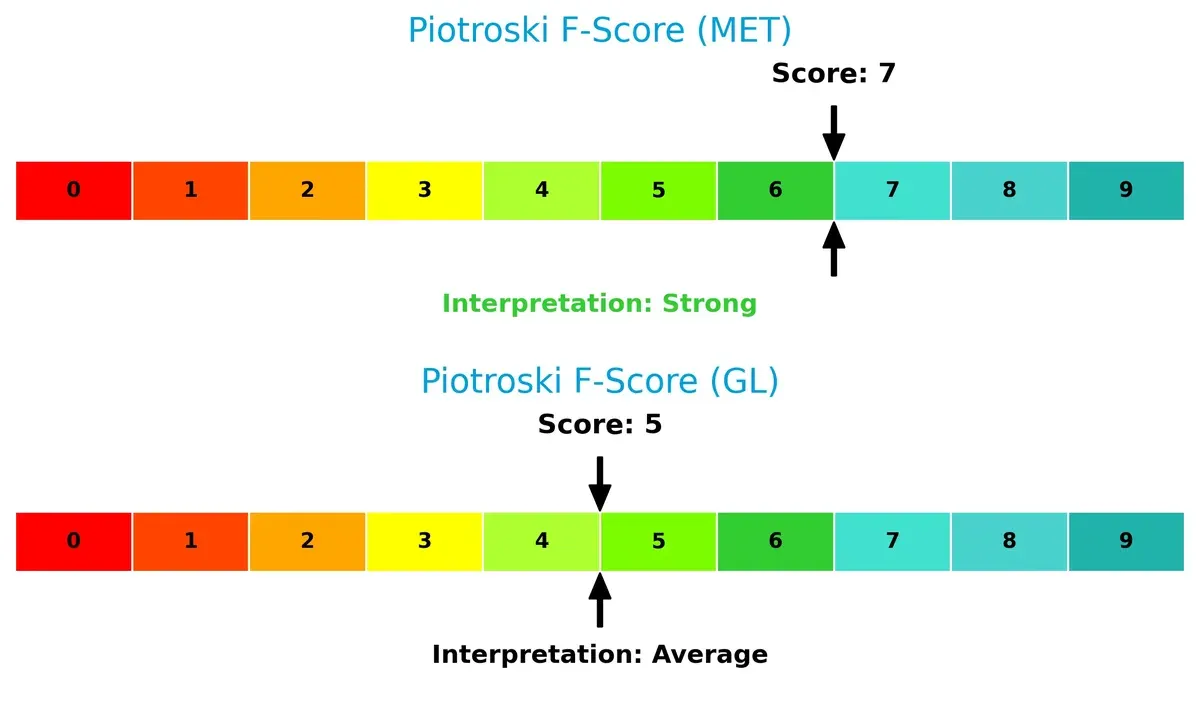
Financial Health: Quality of Operations
MetLife’s Piotroski score of 7 signals robust financial health with solid internal metrics. Globe Life’s score of 5 is average, flagging potential operational weaknesses relative to MetLife:
How are the two companies positioned?
This section dissects MET and GL’s operational DNA by comparing their revenue distribution and internal strengths and weaknesses. The goal is to confront their economic moats and identify which business model offers the most resilient competitive advantage today.
Revenue Segmentation: The Strategic Mix
This visual comparison dissects how MetLife, Inc. and Globe Life Inc. diversify their income streams and where their primary sector bets lie:
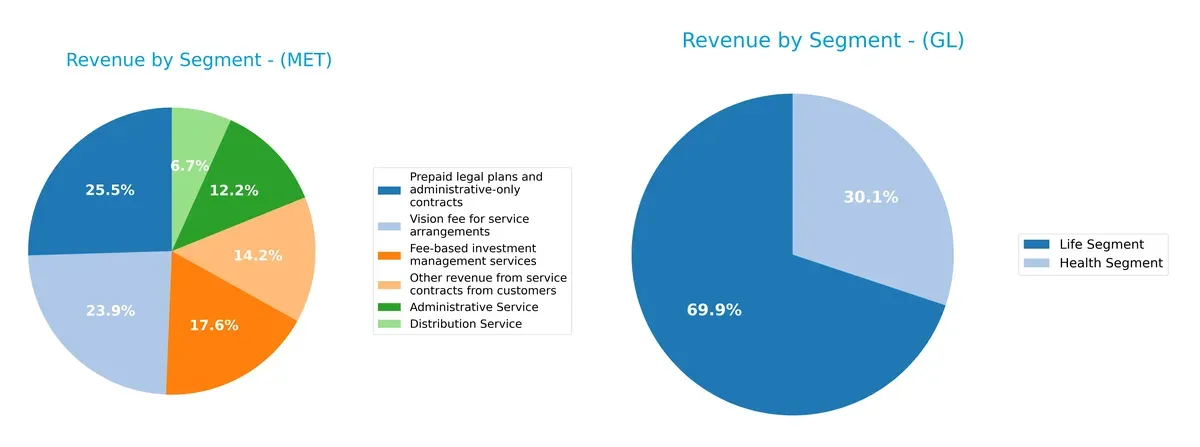
MetLife pivots on its broad geographic mix, with the U.S. segment anchoring $45.8B and significant contributions from Asia, Latin America, and MetLife Holdings. Globe Life leans heavily on its Life Segment at $3.26B, dwarfs Health at $1.4B, showing less diversification. MetLife’s global footprint reduces concentration risk, while Globe Life’s reliance on Life insurance exposes it to sector-specific cycles but may benefit from focused expertise and market positioning.
Strengths and Weaknesses Comparison
This table compares the Strengths and Weaknesses of MetLife, Inc. and Globe Life Inc.:
MetLife Strengths
- Diversified revenue streams across multiple regions and segments
- Favorable debt-to-assets and interest coverage ratios
- Dividend yield at 2.85% supports income investors
Globe Life Strengths
- High net margin at 19.36% indicates strong profitability
- Favorable price-to-earnings ratio of 9.74
- Solid interest coverage ratio of 11.27
MetLife Weaknesses
- Unfavorable net margin and zero ROE/ROIC highlight profitability challenges
- Unfavorable liquidity ratios (current and quick)
- Asset turnover ratios remain weak
Globe Life Weaknesses
- Zero ROE/ROIC reflects poor capital efficiency
- Unfavorable liquidity ratios (current and quick)
- Low dividend yield of 0.75% may deter income-focused investors
Both companies show strengths in debt management and interest coverage. MetLife’s broad geographic diversification contrasts with Globe Life’s superior profitability metrics. Each faces liquidity and capital efficiency concerns, impacting strategic priorities.
The Moat Duel: Analyzing Competitive Defensibility
A structural moat alone protects long-term profits from relentless competitive erosion. Here’s how MetLife and Globe Life stack up:
MetLife, Inc.: Geographic Diversification Moat
MetLife leverages broad geographic reach, stabilizing revenue across multiple markets. However, its declining ROIC trend signals weakening capital efficiency in 2026.
Globe Life Inc.: Margin and Operational Efficiency Moat
Globe Life’s moat stems from superior margin control and operational discipline, reflected in robust EBIT and net margins. Its ROIC growth highlights improving capital returns and expansion potential.
Geographic Reach vs. Operational Mastery: Who Holds the Moat Edge?
MetLife’s geographic diversification offers scale but struggles with capital efficiency. Globe Life’s margin strength and rising ROIC create a deeper moat. Globe Life better defends market share amid evolving industry pressures.
Which stock offers better returns?
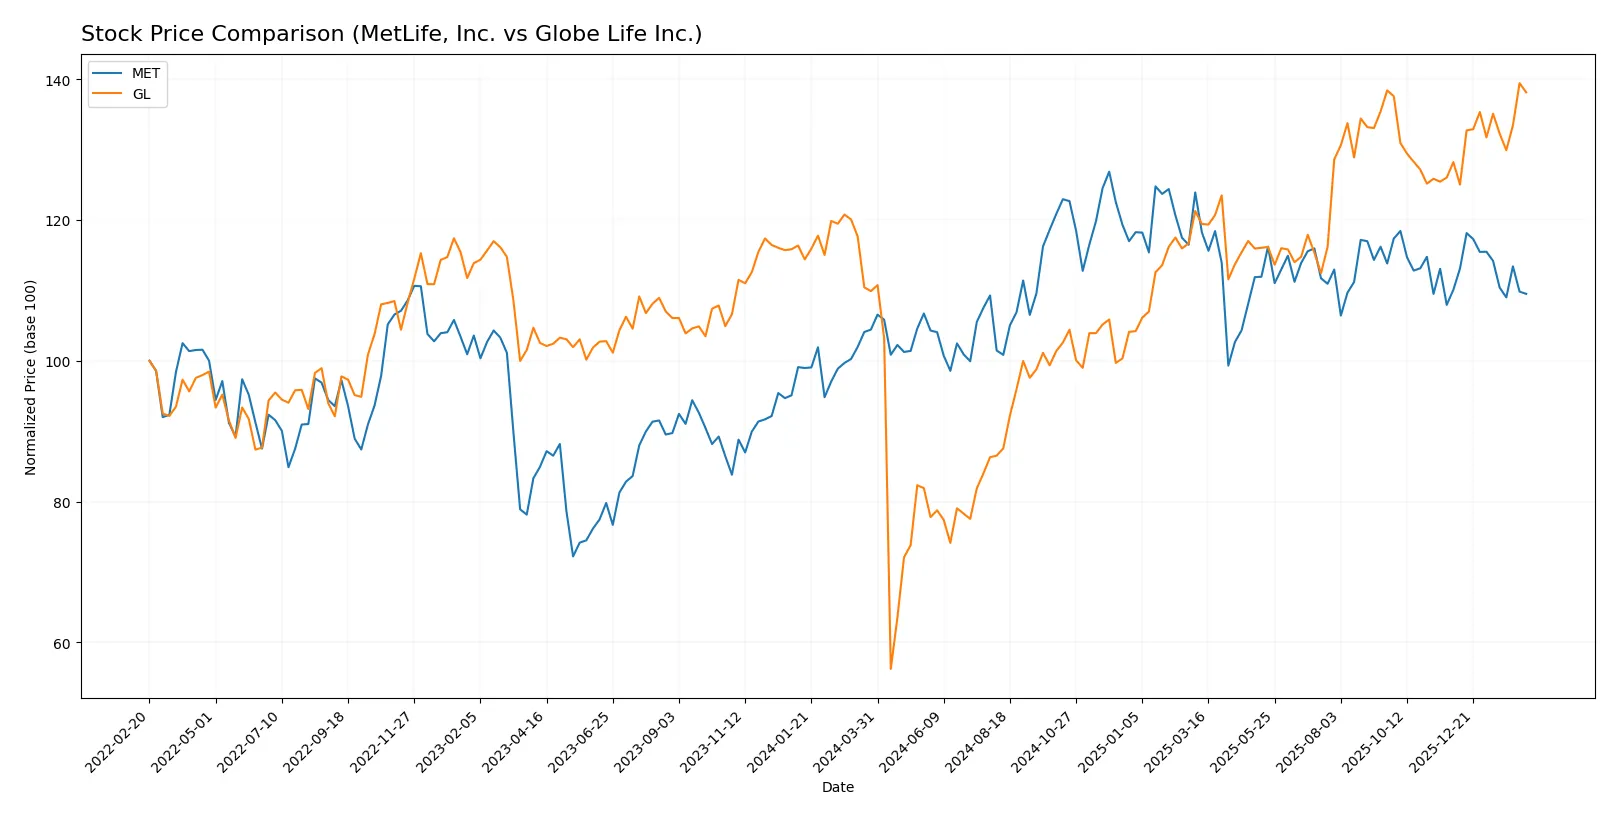
The past year revealed divergent momentum: MetLife’s price rose modestly with slowing gains, while Globe Life accelerated strongly on higher volatility and robust buyer dominance.
Trend Comparison
MetLife’s stock advanced 4.86% over the past 12 months, showing a bullish but decelerating trend. Its price ranged between 68.55 and 88.23, with recent mild weakness of -0.52%.
Globe Life’s stock surged 25.7% in the same period, sustaining a bullish trend with acceleration. Price volatility was higher, swinging from 59.09 to 146.51, while recent gains hit 7.73%.
Globe Life clearly outperformed MetLife in market returns and trend strength, delivering a markedly higher price appreciation over the year.
Target Prices
Analysts show a positive outlook with clear price targets for MetLife and Globe Life.
| Company | Target Low | Target High | Consensus |
|---|---|---|---|
| MetLife, Inc. | 84 | 102 | 95.5 |
| Globe Life Inc. | 158 | 176 | 167 |
The consensus targets exceed current prices significantly: MetLife trades near 76, while Globe Life is around 146. This signals expected upside potential for both insurers.

Don’t Let Luck Decide Your Entry Point
Optimize your entry points with our advanced ProRealTime indicators. You’ll get efficient buy signals with precise price targets for maximum performance. Start outperforming now!
How do institutions grade them?
The following grades from reputable institutions provide insight into MetLife, Inc. and Globe Life Inc.:
MetLife, Inc. Grades
The table below summarizes MetLife’s recent grades from major financial institutions.
| Grading Company | Action | New Grade | Date |
|---|---|---|---|
| UBS | Maintain | Buy | 2026-02-05 |
| Wells Fargo | Maintain | Overweight | 2026-01-13 |
| UBS | Maintain | Buy | 2026-01-08 |
| Wells Fargo | Maintain | Overweight | 2025-12-23 |
| Keefe, Bruyette & Woods | Maintain | Outperform | 2025-11-11 |
| Wells Fargo | Maintain | Overweight | 2025-11-07 |
| UBS | Maintain | Buy | 2025-11-06 |
| B of A Securities | Maintain | Buy | 2025-11-06 |
| B of A Securities | Maintain | Buy | 2025-10-13 |
| Wells Fargo | Maintain | Overweight | 2025-10-08 |
Globe Life Inc. Grades
Below is a summary of Globe Life’s recent grades from leading financial firms.
| Grading Company | Action | New Grade | Date |
|---|---|---|---|
| Truist Securities | Maintain | Buy | 2026-02-06 |
| JP Morgan | Maintain | Overweight | 2026-02-05 |
| TD Cowen | Maintain | Buy | 2025-12-11 |
| Morgan Stanley | Maintain | Overweight | 2025-11-17 |
| Keefe, Bruyette & Woods | Maintain | Outperform | 2025-10-28 |
| Wells Fargo | Maintain | Overweight | 2025-10-24 |
| Truist Securities | Maintain | Buy | 2025-10-24 |
| Wells Fargo | Maintain | Overweight | 2025-10-08 |
| Morgan Stanley | Maintain | Overweight | 2025-08-18 |
| Morgan Stanley | Upgrade | Overweight | 2025-08-05 |
Which company has the best grades?
Both companies consistently receive positive grades from reputable analysts. MetLife shows a strong “Buy” and “Overweight” trend, while Globe Life combines “Buy,” “Overweight,” and occasional “Outperform” ratings. Investors may view Globe Life’s “Outperform” and recent upgrades as signals of slightly higher analyst enthusiasm.
Risks specific to each company
The following categories identify the critical pressure points and systemic threats facing both firms in the 2026 market environment:
1. Market & Competition
MetLife, Inc.
- Faces intense global competition across diverse insurance segments, challenging its market share growth.
Globe Life Inc.
- Competes primarily in the US with focused life and supplemental health products, limiting geographic diversification.
2. Capital Structure & Debt
MetLife, Inc.
- Maintains favorable debt ratios and solid interest coverage at 5.39x, supporting financial stability.
Globe Life Inc.
- Exhibits strong debt metrics with interest coverage at 11.27x, reflecting robust capacity to service debt.
3. Stock Volatility
MetLife, Inc.
- Beta of 0.738 indicates moderate sensitivity to market swings, slightly higher risk than Globe Life.
Globe Life Inc.
- Lower beta of 0.464 signals less volatility, appealing to conservative investors amid market uncertainty.
4. Regulatory & Legal
MetLife, Inc.
- Operates worldwide, subject to complex and evolving regulations, increasing compliance costs and risk.
Globe Life Inc.
- US-focused regulatory environment is more predictable but still exposes the firm to healthcare and insurance policy changes.
5. Supply Chain & Operations
MetLife, Inc.
- Large global footprint creates operational complexity and vulnerability to regional disruptions.
Globe Life Inc.
- Smaller scale and US-centric operations reduce operational risk but limit scale advantages.
6. ESG & Climate Transition
MetLife, Inc.
- Faces pressure to enhance ESG disclosures and align investments with climate goals given global presence.
Globe Life Inc.
- ESG risks are moderate, with less exposure to climate transition risks due to focused US market and product line.
7. Geopolitical Exposure
MetLife, Inc.
- Significant exposure to geopolitical tensions in Asia, Europe, and Latin America risks operational disruptions.
Globe Life Inc.
- Minimal geopolitical risks due to concentrated US operations, offering more stability.
Which company shows a better risk-adjusted profile?
Globe Life’s focused US market and stronger debt service capacity reduce its operational and financial risks. MetLife’s global diversification provides growth opportunities but increases exposure to regulatory, geopolitical, and operational complexities. Globe Life’s lower beta and superior interest coverage indicate a more resilient risk profile. However, MetLife’s strong dividend yield and broader product mix offer compensating factors. The most impactful risk for MetLife is geopolitical and regulatory complexity. For Globe Life, it is its concentrated market exposure limiting growth flexibility. The recent strong interest coverage ratio of 11.27x for Globe Life justifies my preference for its risk-adjusted profile in 2026.
Final Verdict: Which stock to choose?
MetLife’s superpower lies in its scale and diversified insurance platform, providing steady cash flow and a reliable dividend. A point of vigilance remains its declining returns on invested capital, which could pressure long-term value creation. It fits portfolios seeking income with moderate growth expectations.
Globe Life boasts a strategic moat through its focused life insurance niche and strong underwriting discipline. Its accelerating revenue and profit growth, combined with a healthier ROIC trend, suggest stronger competitive positioning. It appeals to investors prioritizing growth with a tolerance for operational leverage.
If you prioritize steady income and a large-cap presence, MetLife is the compelling choice due to its robust cash generation and dividend yield. However, if you seek growth and improving profitability, Globe Life offers better stability in returns and accelerating momentum, though with higher volatility. Both present nuanced scenarios that depend on your risk and return profile.
Disclaimer: Investment carries a risk of loss of initial capital. The past performance is not a reliable indicator of future results. Be sure to understand risks before making an investment decision.
Go Further
I encourage you to read the complete analyses of MetLife, Inc. and Globe Life Inc. to enhance your investment decisions: