Home > Comparison > Technology > WIT vs GLOB
The strategic rivalry between Wipro Limited and Globant S.A. shapes the trajectory of the global technology sector. Wipro operates as a capital-intensive IT services powerhouse with a broad industry reach and deep government ties in India. In contrast, Globant is a nimble, high-margin digital consultancy emphasizing innovation and cloud transformation. This analysis will assess which model offers superior risk-adjusted returns for diversified portfolios amid evolving technological demands.

Table of contents
Companies Overview
Wipro Limited and Globant S.A. stand as key players in the global IT services arena, each commanding distinct market niches.
Wipro Limited: Global IT Services Powerhouse
Wipro Limited leads as a diversified IT, consulting, and business process services provider. Its core revenue comes from IT Services, IT Products, and government-focused solutions, primarily in India. In 2026, Wipro emphasizes digital strategy advisory, cloud services, and custom application design, reinforcing its broad service portfolio across multiple industries.
Globant S.A.: Innovation-Driven Tech Services Specialist
Globant S.A. excels as a technology services company focused on digital transformation and innovation. It generates revenue from e-commerce, cloud transformation, AI, and immersive digital experiences globally. The 2026 strategic focus lies in cutting-edge platforms like metaverse, blockchain, and smart automation, targeting industry disruption through agile delivery and high-tech tools.
Strategic Collision: Similarities & Divergences
Wipro adopts a broad, service-diverse model with strong government ties, while Globant pursues niche innovation in digital ecosystems. Their primary battleground is enterprise digital transformation, with Wipro leveraging scale and legacy clients, Globant competing on agility and cutting-edge tech. These differences create distinct investment profiles: Wipro offers scale and stability, Globant promises growth through innovation.
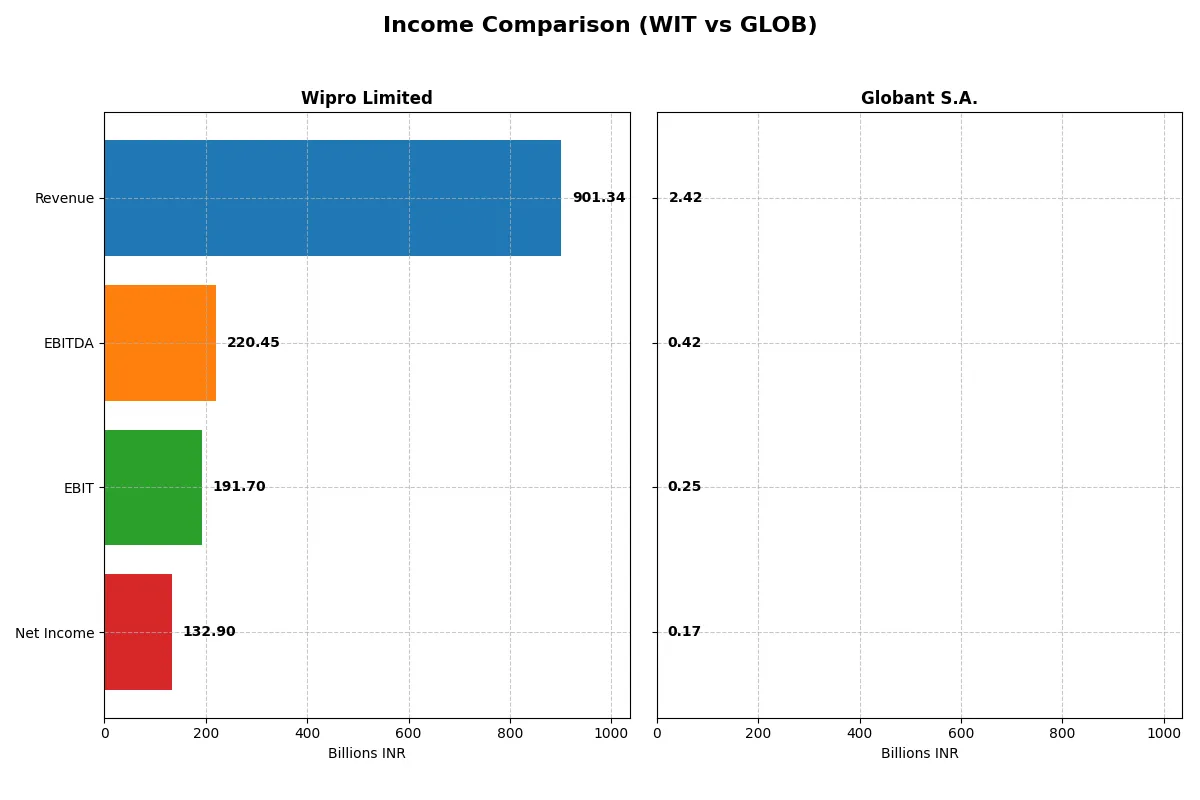
Income Statement Comparison
This data dissects the core profitability and scalability of both corporate engines to reveal who dominates the bottom line:
| Metric | Wipro Limited (WIT) | Globant S.A. (GLOB) |
|---|---|---|
| Revenue | 901B INR | 2.42B USD |
| Cost of Revenue | 625B INR | 1.55B USD |
| Operating Expenses | 123B INR | 638M USD |
| Gross Profit | 276B INR | 863M USD |
| EBITDA | 220B INR | 417M USD |
| EBIT | 192B INR | 254M USD |
| Interest Expense | 15B INR | 29M USD |
| Net Income | 133B INR | 166M USD |
| EPS | 12.56 INR | 3.82 USD |
| Fiscal Year | 2025 | 2024 |
Income Statement Analysis: The Bottom-Line Duel
This income statement comparison reveals which company runs its business engine more efficiently and delivers stronger profit momentum.
Wipro Limited Analysis
Wipro’s revenue hovered near 900B INR in 2025, showing slight yearly decline, but net income climbed to 133B INR, reflecting solid profit growth. Its gross margin of 30.65% and net margin near 15% remain healthy. The 2025 year highlights improved EBIT and EPS growth, signaling operational momentum despite flat top-line figures.
Globant S.A. Analysis
Globant posted a robust 15% revenue increase to $2.42B in 2024, with net income rising to $166M. Its superior gross margin of 35.74% contrasts with a lower net margin of 6.86%, indicating higher costs after gross profit. The firm shows strong revenue and EBIT growth, though a slight net margin contraction suggests margin pressure.
Scale versus Margin Efficiency
Wipro delivers higher absolute profits with stronger net margin and earnings growth, while Globant impresses with faster top-line expansion and superior gross margin. For investors prioritizing stable profitability and margin health, Wipro’s profile is more attractive. Those seeking rapid growth might favor Globant despite its thinner net margin.
Financial Ratios Comparison
These vital ratios act as a diagnostic tool to expose the underlying fiscal health, valuation premiums, and capital efficiency of the companies compared:
| Ratios | Wipro Limited (WIT) | Globant S.A. (GLOB) |
|---|---|---|
| ROE | 16.0% | 8.4% |
| ROIC | 10.5% | 6.8% |
| P/E | 20.6 | 57.6 |
| P/B | 3.30 | 4.86 |
| Current Ratio | 2.72 | 1.54 |
| Quick Ratio | 2.71 | 1.54 |
| D/E (Debt-to-Equity) | 0.23 | 0.21 |
| Debt-to-Assets | 14.9% | 13.0% |
| Interest Coverage | 10.3 | 7.87 |
| Asset Turnover | 0.70 | 0.76 |
| Fixed Asset Turnover | 8.48 | 8.70 |
| Payout ratio | 47.2% | 0% |
| Dividend yield | 2.29% | 0% |
| Fiscal Year | 2025 | 2024 |
Efficiency & Valuation Duel: The Vital Signs
Ratios act as a company’s DNA, uncovering hidden risks and operational strengths that raw numbers alone cannot reveal.
Wipro Limited
Wipro demonstrates strong profitability with a 16.04% ROE and a solid 14.74% net margin, reflecting operational efficiency. Its P/E ratio of 20.6 appears fair, though a 3.3 PB ratio signals valuation caution. Wipro supports shareholders with a 2.29% dividend yield, balancing returns with reinvestment in growth avenues.
Globant S.A.
Globant shows modest profitability with an 8.44% ROE and a 6.86% net margin, indicating moderate efficiency. The stock trades at a stretched P/E of 57.64, suggesting high expectations. It offers no dividend, focusing instead on reinvestment, but unfavorable valuation metrics raise questions on risk versus reward.
Balanced Efficiency vs. Premium Valuation
Wipro offers a healthier mix of solid returns and reasonable valuation, underpinned by consistent dividends. Globant’s premium valuation and lower profitability raise risk concerns. Investors seeking stability might prefer Wipro, while those targeting growth must weigh Globant’s stretched multiples carefully.
Which one offers the Superior Shareholder Reward?
I see a sharp contrast in shareholder rewards between Wipro Limited (WIT) and Globant S.A. (GLOB). WIT pays a moderate dividend yield around 2.3% with a payout ratio near 47%, well-covered by strong free cash flow. It also pursues consistent buybacks, enhancing total return sustainably. GLOB does not pay dividends but reinvests heavily in growth, reflected by its zero payout ratio and high price multiples, though its buyback program is minimal. Historically, dividend-paying firms like WIT in this sector offer steadier, more predictable returns, while GLOB’s growth focus carries higher volatility. In 2026, I favor WIT for delivering superior total shareholder reward through balanced income and capital return.
Comparative Score Analysis: The Strategic Profile
The radar chart reveals the fundamental DNA and trade-offs of Wipro Limited and Globant S.A., highlighting their core financial strengths and valuation nuances:
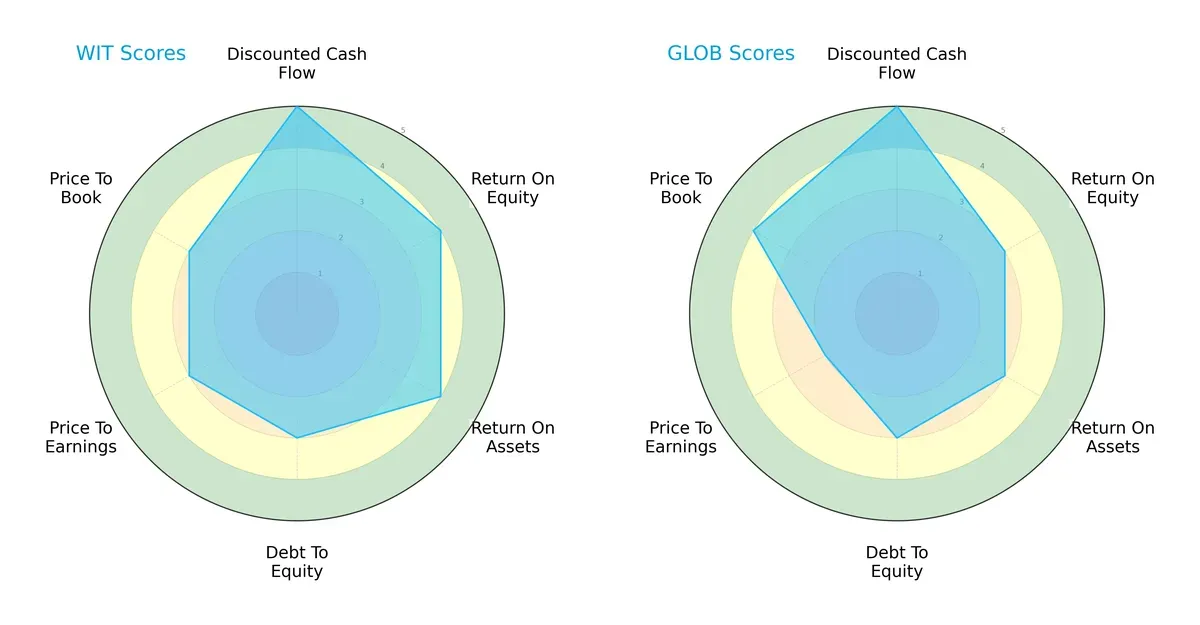
Wipro shows a more balanced profile with strong DCF (5), ROE (4), and ROA (4) scores, signaling efficient capital use and profitability. Globant matches Wipro’s top DCF score but lags in ROE (3) and ROA (3), indicating less efficient asset utilization. Both share moderate debt-to-equity scores (3), yet Globant’s valuation metrics diverge: lower P/E (2) but higher P/B (4), suggesting differing market perceptions. Overall, Wipro relies on operational efficiency, while Globant’s edge comes from market valuation anomalies.
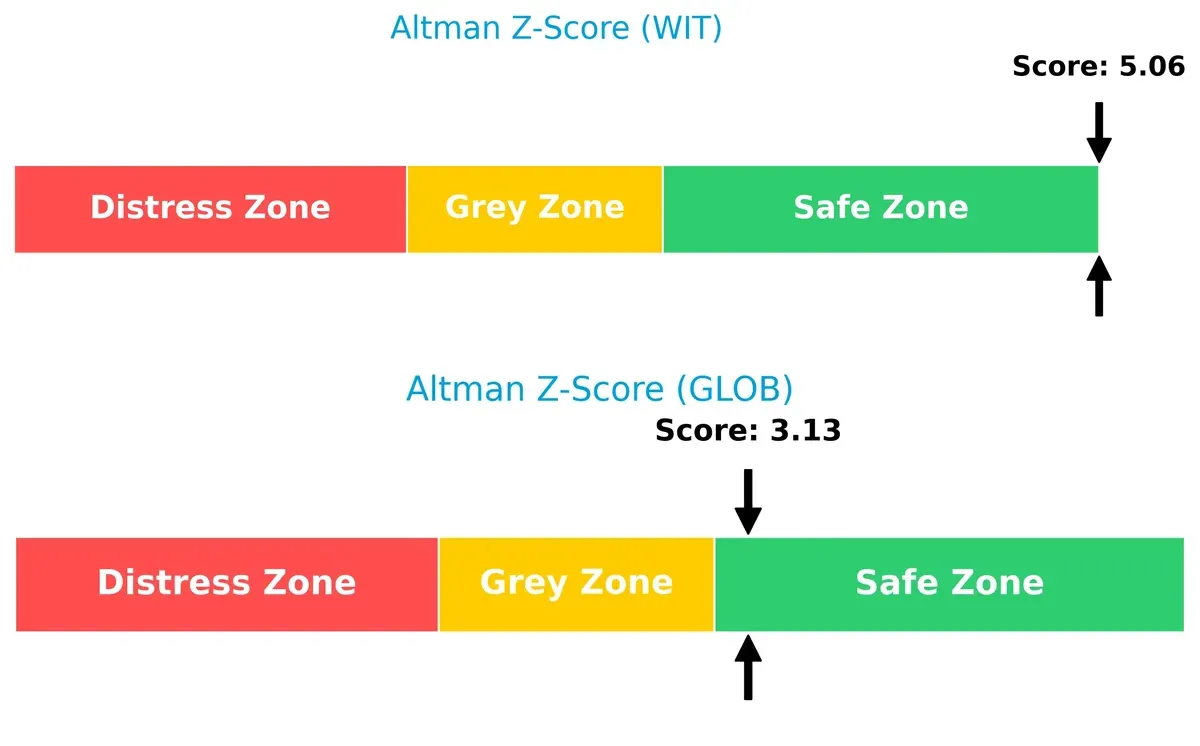
Bankruptcy Risk: Solvency Showdown
Wipro’s Altman Z-Score of 5.06 versus Globant’s 3.13 signals stronger solvency and lower bankruptcy risk for Wipro in this cycle:
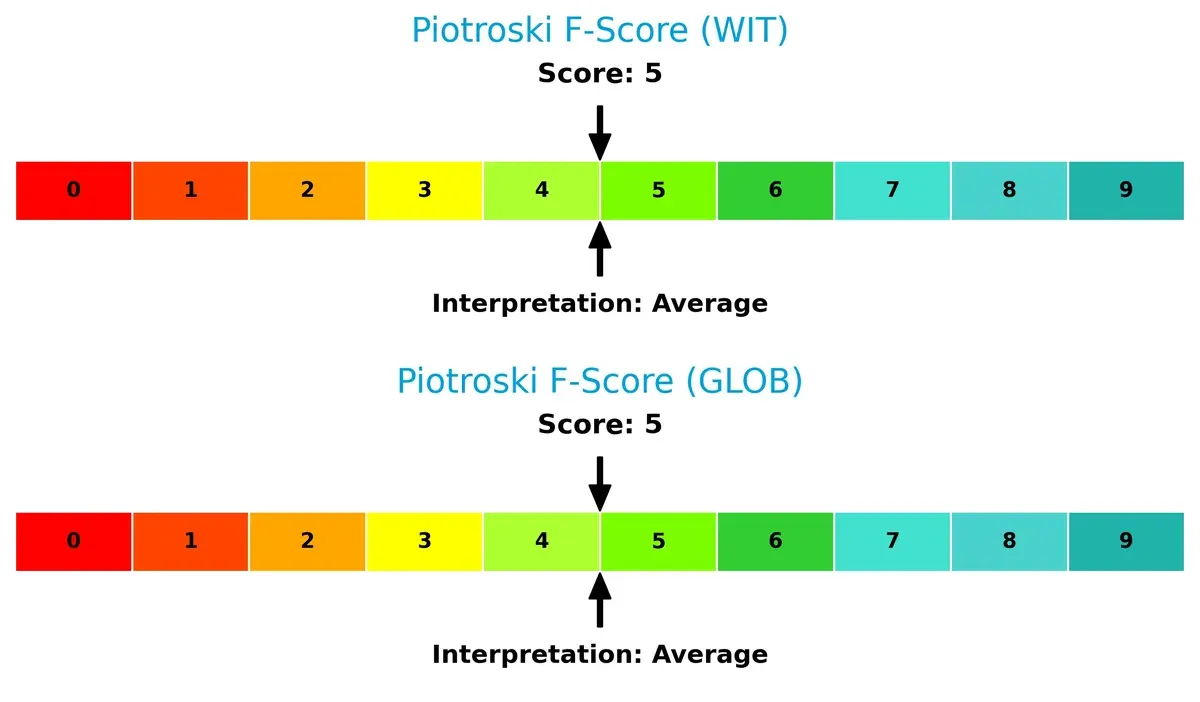
Financial Health: Quality of Operations
Both firms score identically at 5 on the Piotroski F-Score, reflecting average financial health without glaring red flags:
How are the two companies positioned?
This section dissects how Wipro and Globant generate revenue across segments and reveals their internal strengths and weaknesses. The goal is to confront their economic moats and identify the more resilient competitive advantage today.
Strengths and Weaknesses Comparison
This table compares the strengths and weaknesses of Wipro Limited and Globant S.A.:
Wipro Limited Strengths
- High net margin at 14.74%
- Strong ROE of 16.04%
- ROIC well above WACC at 10.49% vs. 6.38%
- Healthy liquidity with current ratio 2.72
- Low debt-to-assets at 14.93%
- Favorable dividend yield of 2.29%
Globant S.A. Strengths
- Global revenue diversification across North America, Latin America, Europe, and Asia
- Favorable current and quick ratios at 1.54
- Low debt-to-assets at 12.95%
- Good interest coverage at 8.87
- Favorable fixed asset turnover at 8.7
Wipro Limited Weaknesses
- Unfavorable price-to-book ratio at 3.3
- Neutral valuation at PE 20.6
- Neutral asset turnover at 0.7
Globant S.A. Weaknesses
- Below average profitability with net margin 6.86%
- Unfavorable ROE at 8.44%
- High PE ratio at 57.64 indicates overvaluation
- No dividend yield
- Higher WACC than ROIC at 8.98% vs. 6.82%
- Unfavorable price-to-book ratio at 4.86
Both companies show solid liquidity and low leverage. Wipro’s profitability and capital efficiency metrics stand out versus Globant’s broader global footprint but weaker profitability and valuation concerns. These differences highlight contrasting strategic focuses in financial and operational execution.
The Moat Duel: Analyzing Competitive Defensibility
A structural moat is the only true shield protecting long-term profits from relentless competitive erosion:
Wipro Limited: Cost Advantage Fuels Value Creation
Wipro’s moat stems from its cost advantage and scale in IT services, evident in a steady 21% EBIT margin and 4.1% ROIC premium over WACC. Despite a declining ROIC trend, new digital offerings in cloud and analytics may reinforce its moat in 2026.
Globant S.A.: Innovation-Driven Growth with Emerging Profitability
Globant relies on innovation and agile digital solutions, driving a 26% ROIC growth trend but still trailing WACC by 2.2%. Its rapidly expanding global footprint and strong revenue growth position it to deepen competitive defenses through new markets and tech services.
Cost Leadership vs. Innovation Momentum
Wipro possesses a deeper, more established moat with positive economic value creation despite margin pressure. Globant shows promising ROIC momentum but currently destroys value economically. Wipro is better equipped to defend its market share amid intensifying competition.
Which stock offers better returns?
Over the past 12 months, both stocks exhibit bearish trends, with Wipro Limited showing steady decline and Globant S.A. undergoing intensified volatility and a recent upward shift in momentum.
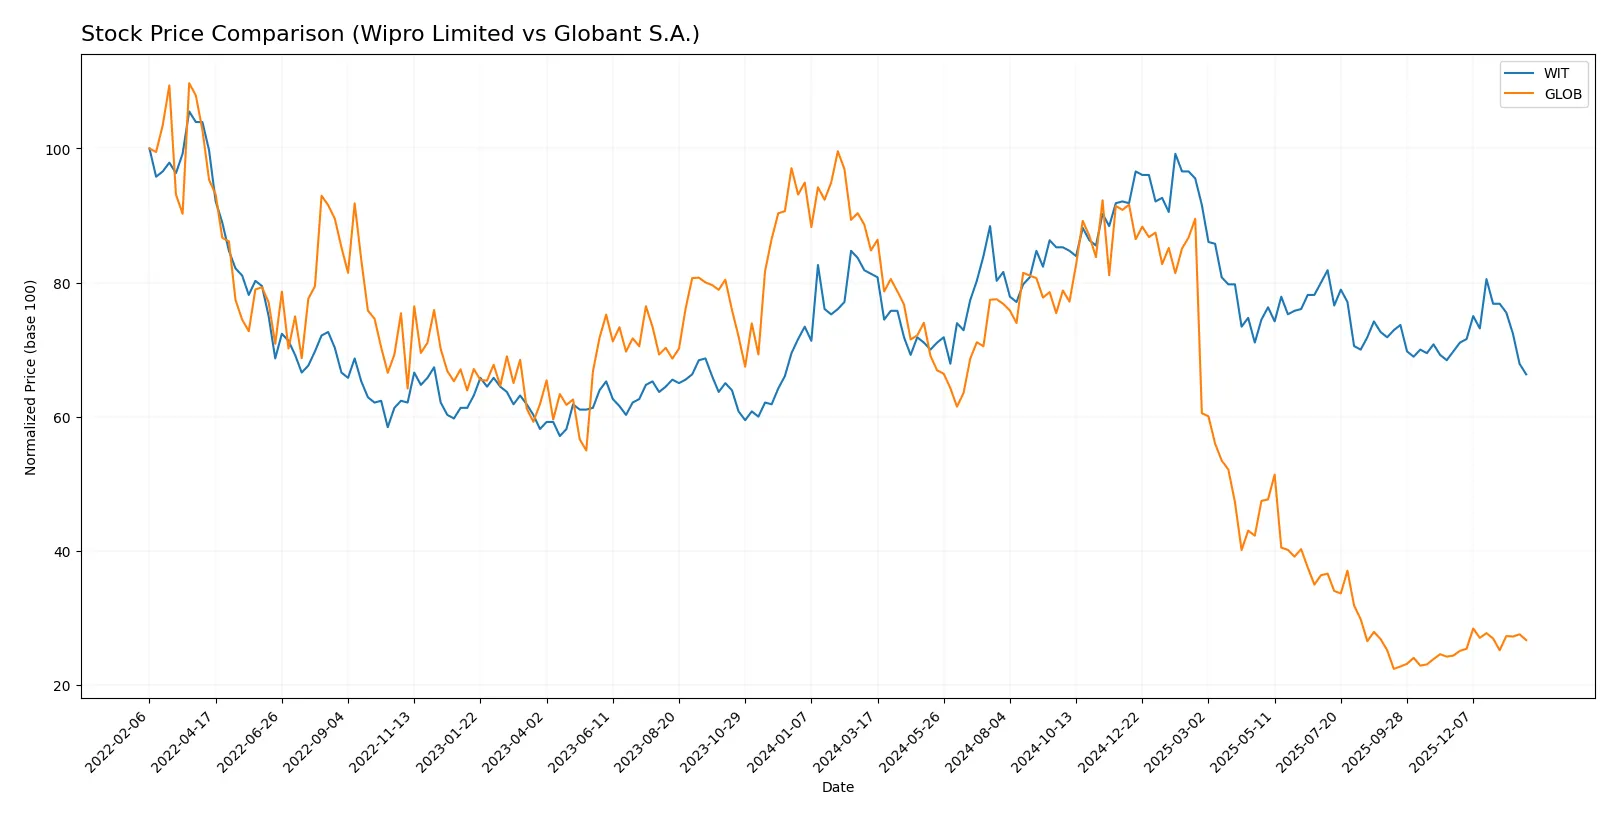
Trend Comparison
Wipro Limited’s stock price dropped 18.45% over the past year, marking a bearish trend with decelerating losses and moderate volatility. The recent period also shows a slight downtrend of -4.91%.
Globant S.A. experienced a severe 68.54% price decline over the year, indicating a bearish trend with accelerating losses and extreme volatility. However, recent months reveal a strong 9.51% gain and buyer dominance.
Between the two, Globant’s recent strong rebound contrasts Wipro’s steady decline, but overall, Wipro has delivered a smaller cumulative loss, reflecting higher relative market performance.
Target Prices
Analysts set clear target price ranges for Wipro Limited and Globant S.A., reflecting confident growth expectations.
| Company | Target Low | Target High | Consensus |
|---|---|---|---|
| Wipro Limited | 7.0 | 7.7 | 7.35 |
| Globant S.A. | 68 | 80 | 73.75 |
The consensus targets for both stocks far exceed their current prices, signaling strong analyst optimism. Wipro trades near $2.52, while Globant sits at $66.88, both with substantial upside potential.
How do institutions grade them?
Wipro Limited Grades
The following table summarizes recent institutional grades for Wipro Limited.
| Grading Company | Action | New Grade | Date |
|---|---|---|---|
| UBS | Upgrade | Neutral | 2025-01-02 |
| Wedbush | Maintain | Underperform | 2024-01-16 |
| JP Morgan | Maintain | Underweight | 2023-05-24 |
| Bernstein | Downgrade | Underperform | 2023-03-22 |
| Bernstein | Downgrade | Underperform | 2023-03-21 |
| Goldman Sachs | Upgrade | Buy | 2022-09-13 |
| Goldman Sachs | Upgrade | Buy | 2022-09-12 |
| Morgan Stanley | Downgrade | Underweight | 2022-07-14 |
| Morgan Stanley | Downgrade | Underweight | 2022-07-13 |
| Macquarie | Upgrade | Outperform | 2022-06-02 |
Globant S.A. Grades
The following table summarizes recent institutional grades for Globant S.A.
| Grading Company | Action | New Grade | Date |
|---|---|---|---|
| Wells Fargo | Maintain | Equal Weight | 2026-01-14 |
| Jefferies | Downgrade | Hold | 2025-11-20 |
| UBS | Maintain | Neutral | 2025-11-18 |
| Needham | Maintain | Buy | 2025-11-14 |
| Canaccord Genuity | Maintain | Hold | 2025-11-14 |
| JP Morgan | Maintain | Neutral | 2025-11-14 |
| Goldman Sachs | Maintain | Neutral | 2025-10-09 |
| UBS | Maintain | Neutral | 2025-08-20 |
| Goldman Sachs | Maintain | Neutral | 2025-08-18 |
| Needham | Maintain | Buy | 2025-08-15 |
Which company has the best grades?
Wipro shows a more varied grading history with recent upgrades to Neutral and Buy grades but also downgrades to Underperform and Underweight. Globant’s grades are more stable, mostly Neutral or Hold with some Buy ratings maintained. Globant’s consistency may suggest more stable expectations, whereas Wipro’s mixed signals reflect greater uncertainty for investors.

Don’t Let Luck Decide Your Entry Point
Optimize your entry points with our advanced ProRealTime indicators. You’ll get efficient buy signals with precise price targets for maximum performance. Start outperforming now!
Risks specific to each company
The following categories identify the critical pressure points and systemic threats facing both firms in the 2026 market environment:
1. Market & Competition
Wipro Limited
- Operates mainly in India with broad sector exposure, facing intense local and global IT services competition.
Globant S.A.
- Focuses on digital and cloud transformation globally, competing with niche tech firms and large consultancies in innovation-driven markets.
2. Capital Structure & Debt
Wipro Limited
- Low debt-to-equity ratio (0.23) and strong interest coverage (12.83) indicate conservative leverage and sound financial stability.
Globant S.A.
- Also maintains low debt (0.21 D/E) with good interest coverage (8.87), but slightly higher WACC (8.98%) suggests costlier capital.
3. Stock Volatility
Wipro Limited
- Beta of 0.555 signals lower stock volatility, reflecting defensive characteristics and steady investor sentiment.
Globant S.A.
- Beta of 1.204 indicates higher volatility, exposing shareholders to greater market swings and risk.
4. Regulatory & Legal
Wipro Limited
- Heavy reliance on Indian government contracts could expose it to regulatory and political shifts in India.
Globant S.A.
- Operating globally, faces complex regulatory environments across multiple jurisdictions, increasing compliance costs and risks.
5. Supply Chain & Operations
Wipro Limited
- Extensive operations in India with established supply chains; potential risks from regional disruptions remain.
Globant S.A.
- More diversified operations but exposed to global supply chain volatility, especially in tech infrastructure and talent acquisition.
6. ESG & Climate Transition
Wipro Limited
- Increasing pressure to improve ESG standards in India; currently moderate disclosures but improving initiatives.
Globant S.A.
- Strong focus on sustainable business solutions and digital sustainability, aligning well with global ESG trends.
7. Geopolitical Exposure
Wipro Limited
- Concentrated exposure to Indian geopolitical environment, which can be volatile but benefits from domestic market growth.
Globant S.A.
- Global footprint exposes it to US-EU trade policies and Latin American risks, increasing geopolitical uncertainty.
Which company shows a better risk-adjusted profile?
Wipro’s strongest risk is its reliance on the Indian government sector, which poses regulatory and political uncertainty. Globant’s critical risk lies in its higher stock volatility and complex global regulatory landscape. Wipro demonstrates a better risk-adjusted profile with lower leverage, lower volatility, and stronger profitability metrics. Its Altman Z-score of 5.06 confirms robust financial health, while Globant’s higher beta and moderate Piotroski scores suggest greater vulnerability. The recent stability in Wipro’s interest coverage ratio underlines its superior capital management amid market pressures.
Final Verdict: Which stock to choose?
Wipro Limited’s superpower lies in its robust capital efficiency and consistent value creation, reflected in a strong moat despite a recent dip in ROIC. Its solid liquidity profile is a point of vigilance to monitor. It suits portfolios focused on steady, moderate growth with resilience.
Globant S.A. leverages its strategic moat through accelerating profitability and rapid revenue growth, driven by innovation and digital transformation expertise. Its higher valuation and weaker value creation signal more risk but also potential upside. It fits growth-oriented portfolios willing to embrace volatility.
If you prioritize capital efficiency and defensive stability, Wipro outshines due to its strong economic moat and favorable financial health. However, if you seek dynamic growth fueled by expanding margins and topline momentum, Globant offers better upside potential albeit with higher risk and valuation premium.
Disclaimer: Investment carries a risk of loss of initial capital. The past performance is not a reliable indicator of future results. Be sure to understand risks before making an investment decision.
Go Further
I encourage you to read the complete analyses of Wipro Limited and Globant S.A. to enhance your investment decisions: