In the fast-evolving world of information technology services, Leidos Holdings, Inc. (LDOS) and Globant S.A. (GLOB) stand out as influential players. Leidos focuses on defense, civil, and health markets with strong ties to government and security sectors, while Globant drives digital transformation and innovative tech solutions globally. This comparison will help investors understand which company offers the most compelling opportunity in today’s competitive landscape. Let’s explore their strengths and potential for your portfolio.
Table of contents
Companies Overview
I will begin the comparison between Leidos Holdings, Inc. and Globant S.A. by providing an overview of these two companies and their main differences.
Leidos Holdings, Inc. Overview
Leidos Holdings, Inc. is a U.S.-based technology company focused on providing services and solutions in defense, intelligence, civil, and health markets worldwide. Operating through Defense Solutions, Civil, and Health segments, the company delivers national security technology, systems integration, IT solutions, and health services. Founded in 1969 and headquartered in Reston, Virginia, Leidos serves government agencies and commercial customers with a broad portfolio supporting critical missions.
Globant S.A. Overview
Globant S.A. is a Luxembourg-based technology services firm specializing in digital transformation, cloud computing, data strategies, and innovative software solutions. Its offerings include e-commerce, AI, healthcare interoperability, media, and cloud services, among others. Founded in 2003, Globant operates globally with a focus on agile delivery, blockchain, cybersecurity, and augmented reality, supporting clients across various industries to build and evolve digital platforms and experiences.
Key similarities and differences
Both companies operate in the Information Technology Services sector and provide technology-driven solutions globally. Leidos centers on government and defense-related contracts with emphasis on security and health, while Globant targets commercial markets with digital transformation and software innovation. Leidos has a larger workforce and market cap, reflecting its broad government focus, whereas Globant’s higher beta indicates greater stock volatility linked to its dynamic, tech-centric business model.
Income Statement Comparison
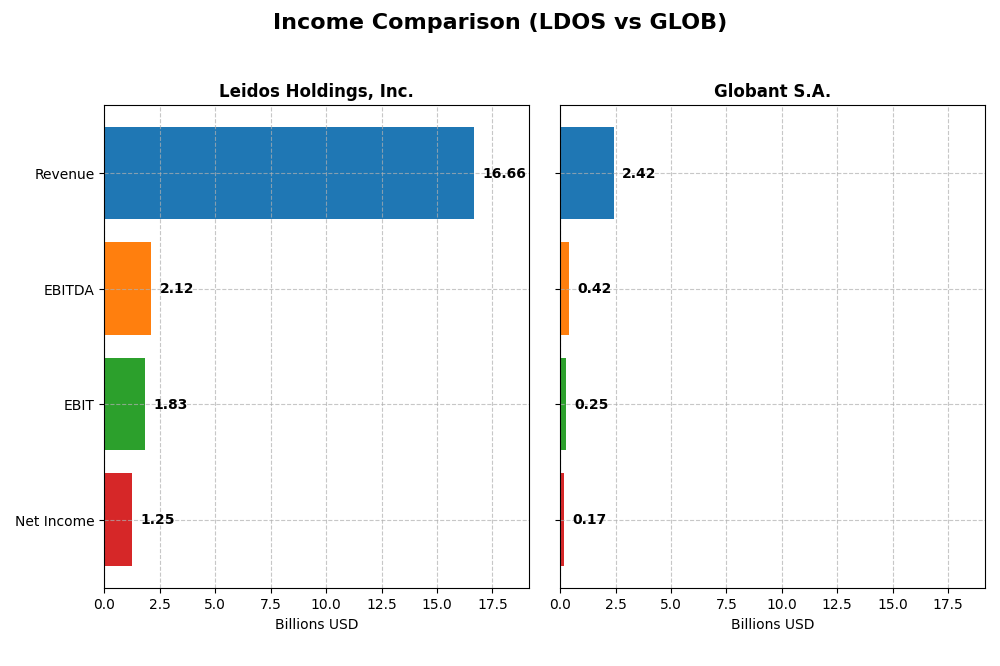
The following table compares key income statement metrics for Leidos Holdings, Inc. and Globant S.A. for the most recent fiscal year available.
| Metric | Leidos Holdings, Inc. (LDOS) | Globant S.A. (GLOB) |
|---|---|---|
| Market Cap | 24.4B | 3.0B |
| Revenue | 16.7B | 2.4B |
| EBITDA | 2.12B | 417M |
| EBIT | 1.83B | 254M |
| Net Income | 1.25B | 166M |
| EPS | 9.36 | 3.82 |
| Fiscal Year | 2024 | 2024 |
Income Statement Interpretations
Leidos Holdings, Inc.
Leidos Holdings showed consistent revenue growth from $12.3B in 2020 to $16.7B in 2024, nearly a 35.5% increase. Net income almost doubled from $628M to $1.25B, reflecting a 99.7% rise. Margins improved notably, with net margin reaching 7.53% in 2024. The latest year saw strong EBIT and EPS growth, signaling enhanced profitability.
Globant S.A.
Globant’s revenue surged from $814M in 2020 to $2.42B in 2024, a robust 196.7% increase. Net income grew over 200% to $166M, though the net margin slightly dipped to 6.86%. The company maintained a favorable gross margin around 35.7%. While revenue and EBIT grew steadily in 2024, net margin contracted, indicating margin pressure despite top-line gains.
Which one has the stronger fundamentals?
Both companies exhibit favorable income statement trends with strong revenue and net income growth. Leidos demonstrates more stable margin expansion and significant EPS improvement, while Globant’s faster revenue growth is tempered by a slight net margin decline. Leidos’ consistent margin gains contrast with Globant’s recent margin pressures, reflecting nuanced strengths in their fundamentals.
Financial Ratios Comparison
The table below presents a side-by-side comparison of key financial ratios for Leidos Holdings, Inc. (LDOS) and Globant S.A. (GLOB) based on their most recent fiscal year data available for 2024.
| Ratios | Leidos Holdings, Inc. (LDOS) | Globant S.A. (GLOB) |
|---|---|---|
| ROE | 28.4% | 8.4% |
| ROIC | 13.9% | 6.8% |
| P/E | 15.7 | 57.6 |
| P/B | 4.47 | 4.86 |
| Current Ratio | 1.21 | 1.54 |
| Quick Ratio | 1.13 | 1.54 |
| D/E (Debt-to-Equity) | 1.20 | 0.21 |
| Debt-to-Assets | 40.4% | 13.0% |
| Interest Coverage | 9.47 | 7.87 |
| Asset Turnover | 1.27 | 0.76 |
| Fixed Asset Turnover | 10.7 | 8.70 |
| Payout Ratio | 16.6% | 0% |
| Dividend Yield | 1.05% | 0% |
Interpretation of the Ratios
Leidos Holdings, Inc.
Leidos displays a balanced ratio profile, with favorable returns on equity (28.42%) and invested capital (13.85%), supported by a reasonable WACC of 5.87%. However, concerns arise from its high price-to-book ratio (4.47) and debt-to-equity ratio (1.2). The company pays dividends with a stable yield of 1.05%, indicating moderate shareholder returns without evident payout risks.
Globant S.A.
Globant shows mixed financial ratios, including a modest return on equity of 8.44% and a neutral return on invested capital of 6.82%. Its valuation appears stretched, with a high P/E ratio of 57.64 and an unfavorable price-to-book ratio of 4.86. The company does not pay dividends, likely prioritizing reinvestment or growth, as suggested by its low debt levels and solid liquidity ratios.
Which one has the best ratios?
Leidos offers stronger profitability ratios and better coverage of its cost of capital, though it carries more leverage. Globant benefits from lower debt and stronger liquidity but suffers from high valuation multiples and weaker returns. Both have a slightly favorable overall ratio assessment, reflecting different risk and growth profiles.
Strategic Positioning
This section compares the strategic positioning of Leidos Holdings, Inc. and Globant S.A. in terms of Market position, Key segments, and Exposure to technological disruption:
Leidos Holdings, Inc.
- Strong market position in defense and government sectors with moderate competitive pressure.
- Key segments include Defense Solutions, Civil, and Health, driven by national security and government contracts.
- Exposure to disruption mainly in cybersecurity and IT modernization within defense and civil sectors.
Globant S.A.
- Smaller market cap with focus on digital and technology services facing higher competitive intensity.
- Diverse digital offerings spanning e-commerce, cloud, AI, healthcare, and media industries.
- High exposure to fast-evolving digital technologies, including AI, blockchain, and cloud transformation.
Leidos Holdings, Inc. vs Globant S.A. Positioning
Leidos has a concentrated approach focused on defense, civil, and health government markets, benefiting from stable contracts but limited diversification. Globant pursues a diversified digital services strategy across multiple industries, increasing innovation opportunities but facing greater market volatility.
Which has the best competitive advantage?
Leidos demonstrates a very favorable moat with growing ROIC above WACC, indicating durable competitive advantage and value creation. Globant shows slightly unfavorable moat status, shedding value despite improving profitability, reflecting weaker competitive positioning.
Stock Comparison
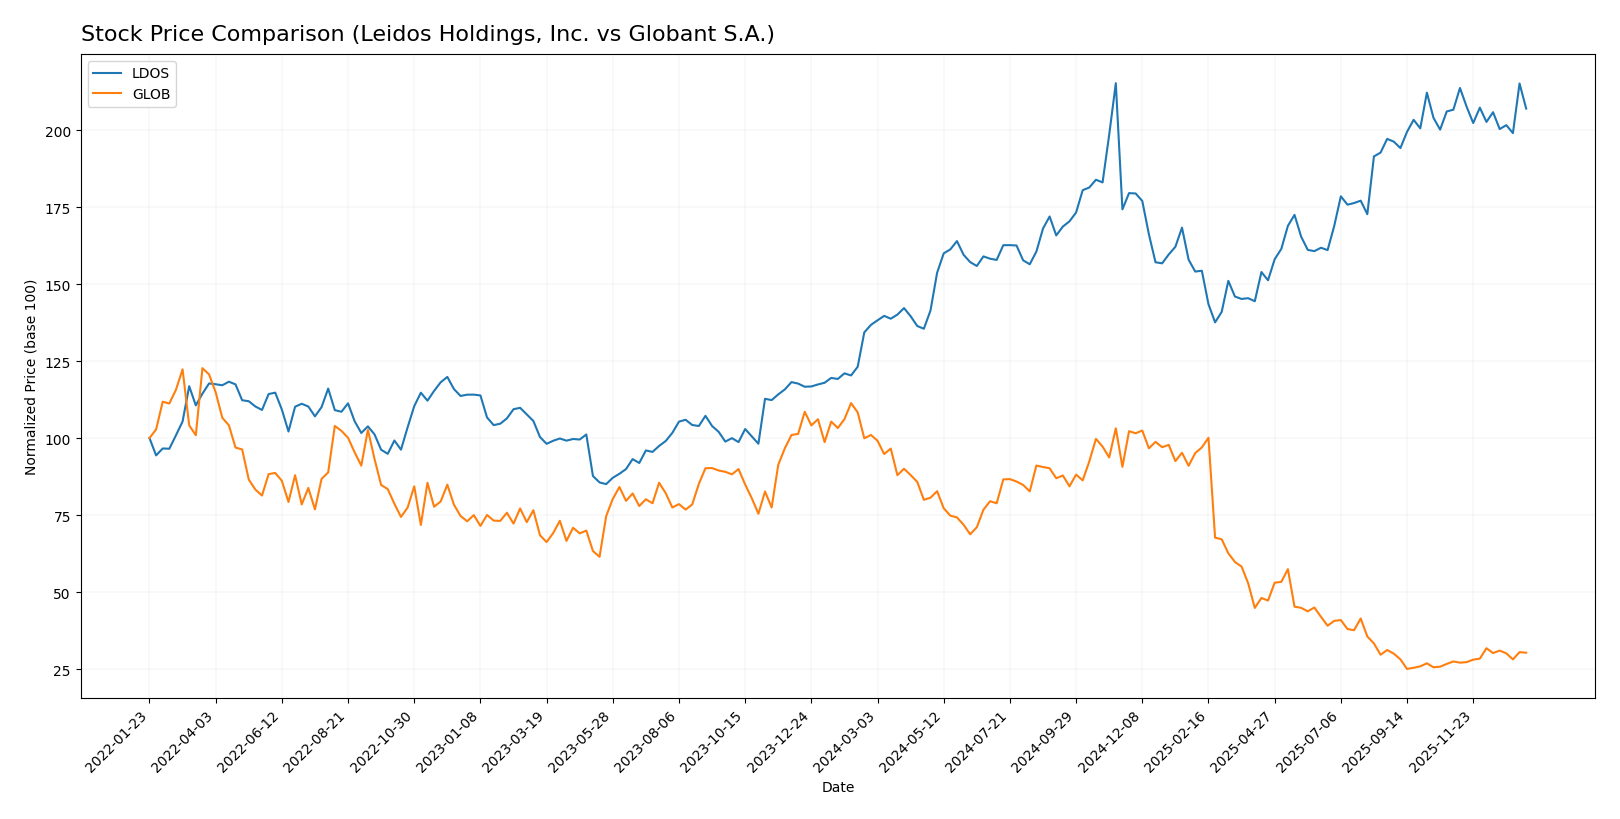
The stock price movements over the past year reveal a strong bullish trend for Leidos Holdings, Inc. (LDOS) with a 51.37% gain but decelerating momentum, while Globant S.A. (GLOB) experienced a sharp 70.01% decline with accelerating bearish pressure.
Trend Analysis
Leidos Holdings, Inc. (LDOS) showed a bullish trend over the past 12 months with a 51.37% price increase but a deceleration in trend strength. The stock experienced moderate volatility with a 20.61 standard deviation.
Globant S.A. (GLOB) exhibited a bearish trend over the same period, dropping 70.01% with accelerating downward momentum. Volatility was high, reflected by a 61.44 standard deviation, indicating significant price swings.
Comparing the two, LDOS delivered the highest market performance with a strong positive price change, contrasting sharply with GLOB’s substantial loss during the last year.
Target Prices
The current analyst consensus indicates promising upside potential for the selected companies.
| Company | Target High | Target Low | Consensus |
|---|---|---|---|
| Leidos Holdings, Inc. | 230 | 216 | 222.2 |
| Globant S.A. | 80 | 68 | 72.5 |
Analysts expect Leidos Holdings, Inc.’s stock to rise significantly above its current price of $190.82, while Globant S.A. shows a moderate upside from its current price of $67.93. Overall, targets suggest positive market sentiment.
Analyst Opinions Comparison
This section compares analysts’ ratings and grades for Leidos Holdings, Inc. (LDOS) and Globant S.A. (GLOB):
Rating Comparison
LDOS Rating
- Rating: A-, considered very favorable by analysts.
- Discounted Cash Flow Score: 5, indicating very favorable valuation based on cash flow projections.
- ROE Score: 5, showing very efficient profit generation from shareholders’ equity.
- ROA Score: 4, favorable use of assets to generate earnings.
- Debt To Equity Score: 1, very unfavorable, indicating high financial risk.
- Overall Score: 4, favorable overall financial standing.
GLOB Rating
- Rating: A-, considered very favorable by analysts.
- Discounted Cash Flow Score: 5, also very favorable for valuation.
- ROE Score: 3, reflecting moderate efficiency in profit generation.
- ROA Score: 3, moderate effectiveness in asset utilization.
- Debt To Equity Score: 3, moderate financial risk with balanced debt levels.
- Overall Score: 4, favorable overall financial standing.
Which one is the best rated?
Both LDOS and GLOB share the same overall rating of A- and an overall score of 4, indicating favorable standings. LDOS scores higher in ROE and ROA but has a weaker debt-to-equity score, while GLOB has moderate scores across these metrics with a better debt-to-equity rating.
Scores Comparison
Here is a comparison of the financial health scores for Leidos Holdings, Inc. and Globant S.A.:
Leidos Holdings, Inc. Scores
- Altman Z-Score: 4.15, indicating a safe zone status
- Piotroski Score: 8, classified as very strong
Globant S.A. Scores
- Altman Z-Score: 3.05, indicating a safe zone status
- Piotroski Score: 5, classified as average
Which company has the best scores?
Leidos Holdings, Inc. shows stronger financial health with a higher Altman Z-Score and a very strong Piotroski Score compared to Globant S.A., which has a lower Piotroski Score classified as average.
Grades Comparison
The following is a comparison of recent reliable grades issued by recognized grading companies for Leidos Holdings, Inc. and Globant S.A.:
Leidos Holdings, Inc. Grades
This table summarizes recent grades from major financial institutions for Leidos Holdings, Inc.:
| Grading Company | Action | New Grade | Date |
|---|---|---|---|
| Citigroup | Maintain | Buy | 2026-01-13 |
| Stifel | Downgrade | Hold | 2026-01-08 |
| B of A Securities | Maintain | Buy | 2025-11-07 |
| Truist Securities | Maintain | Buy | 2025-11-05 |
| UBS | Maintain | Neutral | 2025-11-05 |
| Cantor Fitzgerald | Maintain | Overweight | 2025-10-31 |
| Argus Research | Maintain | Buy | 2025-09-24 |
| B of A Securities | Maintain | Buy | 2025-09-04 |
| RBC Capital | Upgrade | Outperform | 2025-09-04 |
| UBS | Maintain | Neutral | 2025-08-07 |
Leidos shows a generally positive trend with multiple “Buy” and “Outperform” grades, though some neutral and hold ratings suggest cautious optimism.
Globant S.A. Grades
This table summarizes recent grades from major financial institutions for Globant S.A.:
| Grading Company | Action | New Grade | Date |
|---|---|---|---|
| Jefferies | Downgrade | Hold | 2025-11-20 |
| UBS | Maintain | Neutral | 2025-11-18 |
| JP Morgan | Maintain | Neutral | 2025-11-14 |
| Needham | Maintain | Buy | 2025-11-14 |
| Canaccord Genuity | Maintain | Hold | 2025-11-14 |
| Goldman Sachs | Maintain | Neutral | 2025-10-09 |
| UBS | Maintain | Neutral | 2025-08-20 |
| Goldman Sachs | Maintain | Neutral | 2025-08-18 |
| Needham | Maintain | Buy | 2025-08-15 |
| JP Morgan | Downgrade | Neutral | 2025-08-15 |
Globant’s grades reveal a mix of “Neutral,” “Hold,” and some “Buy” ratings, with recent downgrades indicating a more cautious outlook.
Which company has the best grades?
Leidos Holdings, Inc. has received comparatively stronger and more consistent buy and outperform ratings, while Globant S.A. shows a more mixed and cautious rating profile. This difference could influence investors’ perception of relative strength and risk between the two stocks.
Strengths and Weaknesses
Below is a comparison of key strengths and weaknesses for Leidos Holdings, Inc. (LDOS) and Globant S.A. (GLOB) based on the most recent data.
| Criterion | Leidos Holdings, Inc. (LDOS) | Globant S.A. (GLOB) |
|---|---|---|
| Diversification | Highly diversified with strong segments in National Security ($9.55B), Defense ($2.03B), and Civil ($4.99B) | Less diversified, focused primarily on digital consulting and software |
| Profitability | Strong profitability: ROIC 13.85% (favorable), ROE 28.42% (favorable) | Moderate profitability: ROIC 6.82% (neutral), ROE 8.44% (unfavorable) |
| Innovation | Demonstrates durable competitive advantage with growing ROIC and strong defense technology | Improving innovation with growing ROIC but currently value-destroying |
| Global presence | Extensive global footprint, especially in U.S. government and defense sectors | Global presence in digital services but less entrenched in critical sectors |
| Market Share | Large market share in defense and government IT solutions | Smaller market share, operating in competitive software services market |
Key takeaways: Leidos Holdings shows a strong and diversified business model with solid profitability and a durable moat, making it a more stable investment. Globant is growing and innovating but currently struggles with profitability and value creation, posing higher risk for investors.
Risk Analysis
Below is a comparative table highlighting key risk factors for Leidos Holdings, Inc. (LDOS) and Globant S.A. (GLOB) based on the latest 2024 data:
| Metric | Leidos Holdings, Inc. (LDOS) | Globant S.A. (GLOB) |
|---|---|---|
| Market Risk | Beta 0.59 – Lower volatility, moderate market sensitivity | Beta 1.20 – Higher volatility, greater market sensitivity |
| Debt level | Debt/Equity 1.2 – Elevated leverage, cautious debt management needed | Debt/Equity 0.21 – Low leverage, financially stable balance sheet |
| Regulatory Risk | Moderate – Defense and government contracts subject to policy changes | Moderate – Global tech services face data privacy and compliance risks |
| Operational Risk | Moderate – Complex defense and civil systems integration | Moderate – Rapid tech innovation demands continuous adaptation |
| Environmental Risk | Low – Limited direct environmental exposure | Low – Primarily digital services, minimal environmental impact |
| Geopolitical Risk | High – Significant US government and allied country exposure | Moderate – International presence with some geopolitical sensitivities |
Synthesis: Leidos faces higher geopolitical risk due to its defense focus and elevated debt level, which may impact financial flexibility. Globant is more exposed to market volatility and regulatory risks linked to global tech operations. Investors should weigh Leidos’s stable cash flows against debt concerns, while Globant’s growth is balanced by higher valuation multiples and moderate financial strength.
Which Stock to Choose?
Leidos Holdings, Inc. (LDOS) shows a favorable income evolution with strong growth in revenue and net income over 2020-2024. Its financial ratios are slightly favorable, highlighted by a high ROE of 28.42% and ROIC of 13.85%, though debt levels are somewhat unfavorable. The company holds a very favorable rating (A-) and demonstrates a very favorable economic moat with ROIC well above WACC and growing profitability.
Globant S.A. (GLOB) exhibits robust revenue and net income growth but a slightly less favorable net margin trend. Its financial ratios are slightly favorable, supported by low debt and good liquidity, though ROE and valuation multiples are less attractive. GLOB shares the same overall rating (A-) but has a slightly unfavorable moat status, indicating value destruction despite improving ROIC.
For investors focused on strong profitability and durable competitive advantage, LDOS might appear more favorable due to its high returns and solid moat. Conversely, those prioritizing lower leverage and liquidity could find GLOB’s profile more appealing despite its valuation challenges. The choice could thus depend on risk tolerance and investment strategy preferences.
Disclaimer: Investment carries a risk of loss of initial capital. The past performance is not a reliable indicator of future results. Be sure to understand risks before making an investment decision.
Go Further
I encourage you to read the complete analyses of Leidos Holdings, Inc. and Globant S.A. to enhance your investment decisions: