Home > Comparison > Technology > IBM vs GLOB
The strategic rivalry between International Business Machines Corporation (IBM) and Globant S.A. shapes the evolution of the technology sector. IBM operates as a capital-intensive technology services giant with a diversified portfolio spanning software, consulting, infrastructure, and financing. In contrast, Globant focuses on agile, high-growth digital and IT services driven by innovation and software development. This analysis will assess which corporate strategy delivers superior risk-adjusted returns for a diversified portfolio in today’s dynamic tech landscape.

Table of contents
Companies Overview
International Business Machines Corporation and Globant S.A. drive innovation in the global technology services market.
International Business Machines Corporation: Industry Legacy Powerhouse
IBM dominates as a leader in integrated technology solutions and services worldwide. It generates revenue through four segments: Software, Consulting, Infrastructure, and Financing. In 2026, IBM strategically prioritizes hybrid cloud and AI-driven software, reinforcing its competitive edge with open-source enterprise solutions like Red Hat.
Globant S.A.: Digital Transformation Specialist
Globant excels in delivering cutting-edge digital services across industries, including e-commerce, cloud transformation, and AI-powered platforms. The company’s revenue stems from diverse offerings such as augmented revenue management, smart farming, and metaverse solutions. Its 2026 focus sharpens on expanding agile delivery and blockchain, pushing innovation in digital experience and cloud operations.
Strategic Collision: Similarities & Divergences
IBM emphasizes a hybrid cloud and AI software stack with an open-source foundation, while Globant pursues a broad digital transformation portfolio rooted in agile, cloud, and emerging tech. Both compete fiercely in cloud adoption and enterprise digital services. IBM’s scale and legacy contrast with Globant’s nimble innovation, creating distinct investment profiles shaped by market maturity and growth potential.
Income Statement Comparison
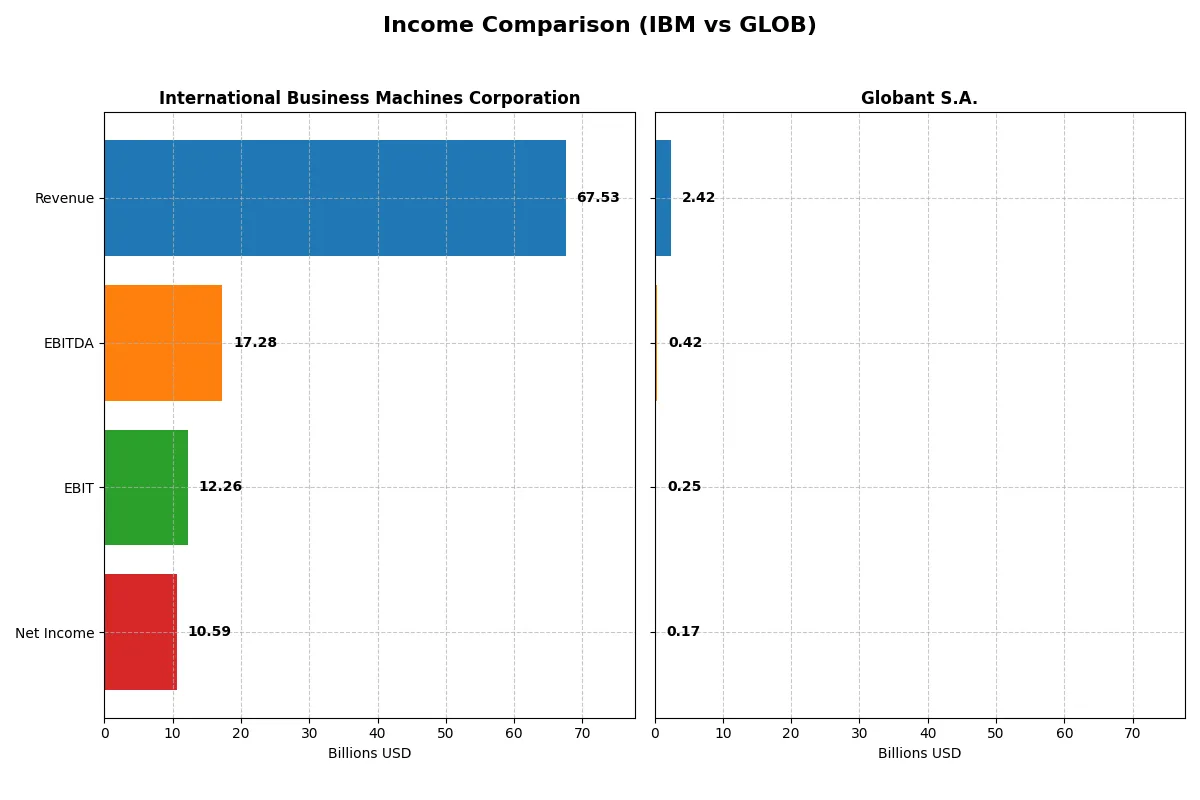
This data dissects the core profitability and scalability of both corporate engines to reveal who dominates the bottom line:
| Metric | International Business Machines Corporation (IBM) | Globant S.A. (GLOB) |
|---|---|---|
| Revenue | 67.5B | 2.42B |
| Cost of Revenue | 27.4B | 1.55B |
| Operating Expenses | 29.9B | 638M |
| Gross Profit | 40.2B | 863M |
| EBITDA | 17.3B | 417M |
| EBIT | 12.3B | 254M |
| Interest Expense | 1.94B | 29M |
| Net Income | 10.6B | 166M |
| EPS | 11.36 | 3.82 |
| Fiscal Year | 2025 | 2024 |
Income Statement Analysis: The Bottom-Line Duel
This income statement comparison reveals which company runs a more efficient and profitable corporate engine through key financial metrics and growth trends.
International Business Machines Corporation Analysis
IBM’s revenue grew steadily from $57.4B in 2021 to $67.5B in 2025, with net income more than doubling from $5.74B to $10.6B. The company sustains strong gross margins near 59.5%, while net margin expanded to 15.7%, signaling improved cost control. In 2025, EBIT surged 63%, highlighting robust operational momentum and efficiency gains.
Globant S.A. Analysis
Globant’s revenue jumped from $814M in 2020 to $2.42B in 2024, reflecting rapid scale. Net income more than tripled to $166M, but margins remain thinner, with a 35.7% gross margin and a 6.9% net margin in 2024. Despite solid revenue and EBIT growth exceeding 15% annually, recent net margin contraction signals pressure on profitability.
Scale Growth vs. Margin Expansion
IBM clearly leads in profitability with superior margins and a doubling of net income over five years. Globant delivers faster top-line expansion but with lower and less stable margins. For investors prioritizing consistent earnings growth and operational efficiency, IBM’s profile stands out as more fundamentally attractive.
Financial Ratios Comparison
These vital ratios act as a diagnostic tool to expose the underlying fiscal health, valuation premiums, and capital efficiency of the companies compared below:
| Ratios | International Business Machines Corporation (IBM) | Globant S.A. (GLOB) |
|---|---|---|
| ROE | 22.06% (2024) | 8.44% (2024) |
| ROIC | 9.17% (2024) | 6.82% (2024) |
| P/E | 34.21 (2024) | 57.64 (2024) |
| P/B | 7.54 (2024) | 4.86 (2024) |
| Current Ratio | 1.04 (2024) | 1.54 (2024) |
| Quick Ratio | 1.00 (2024) | 1.54 (2024) |
| D/E | 2.14 (2024) | 0.21 (2024) |
| Debt-to-Assets | 42.57% (2024) | 12.95% (2024) |
| Interest Coverage | 5.88 (2024) | 7.87 (2024) |
| Asset Turnover | 0.46 (2024) | 0.76 (2024) |
| Fixed Asset Turnover | 7.03 (2024) | 8.70 (2024) |
| Payout Ratio | 102.06% (2024) | 0% (2024) |
| Dividend Yield | 2.98% (2024) | 0% (2024) |
| Fiscal Year | 2024 | 2024 |
Efficiency & Valuation Duel: The Vital Signs
Financial ratios act as a company’s DNA, exposing hidden operational strengths and risks critical to investor decisions.
International Business Machines Corporation
IBM’s net margin is a robust 15.7%, signaling strong profitability, yet its ROE and ROIC stand at zero, indicating efficiency challenges. The stock trades at a 26.1 P/E, which I find stretched compared to sector norms. IBM rewards shareholders with a 2.27% dividend yield, reflecting steady income distribution despite moderate growth reinvestment.
Globant S.A.
Globant displays a modest 6.9% net margin and a ROE of 8.4%, suggesting moderate profitability but less operational efficiency. Its valuation is rich, with a P/E of 57.6 and a high 4.9 PB ratio, marking an expensive profile. Globant does not pay dividends, opting instead to reinvest earnings to fuel growth and innovation.
Valuation Stretch vs. Operational Stability
IBM offers stronger profitability and shareholder income but lacks efficiency, trading at a more reasonable multiple. Globant appears growth-focused but expensive, with weaker margins and no dividends. Risk-averse investors may lean toward IBM’s income and stability, while growth seekers might favor Globant’s reinvestment profile.
Which one offers the Superior Shareholder Reward?
I compare IBM and Globant’s distribution models to identify the superior shareholder reward. IBM offers a 2.3% dividend yield with a high 59% payout ratio well covered by free cash flow (2.1x). IBM also executes steady buybacks, enhancing total returns. Globant pays no dividend, reinvesting heavily in growth (R&D and acquisitions), reflected in its zero payout ratio and minimal buybacks. However, Globant’s free cash flow yield is lower, and valuation multiples are higher (P/E ~58 vs. IBM’s ~26), implying greater risk. I find IBM’s balanced cash return via dividends and buybacks more sustainable and attractive for long-term total shareholder return in 2026.
Comparative Score Analysis: The Strategic Profile
The radar chart reveals the core DNA and strategic trade-offs between International Business Machines Corporation and Globant S.A., highlighting their distinctive financial strengths and weaknesses:
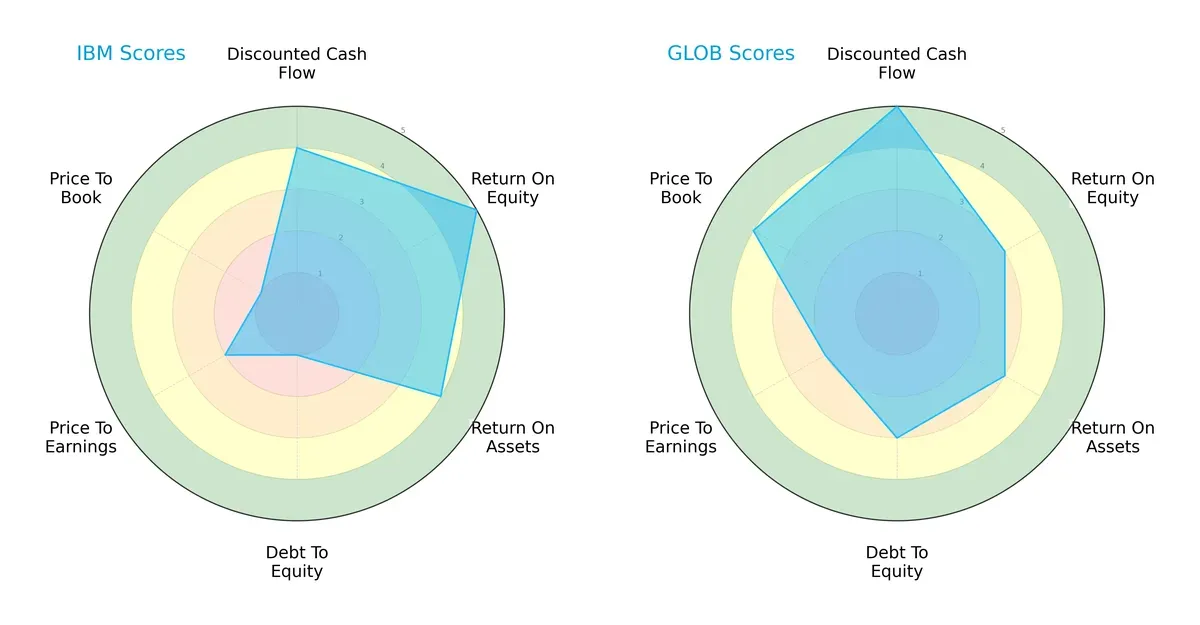
IBM shows strong operational efficiency with superior ROE (5) and ROA (4) scores but suffers from a weak balance sheet, indicated by a very unfavorable debt-to-equity score (1). Conversely, Globant maintains a more balanced profile, excelling in discounted cash flow (5) and price-to-book (4) metrics, signaling better valuation and moderate leverage (3). IBM relies heavily on profitability, while Globant presents a steadier capital structure and valuation appeal.
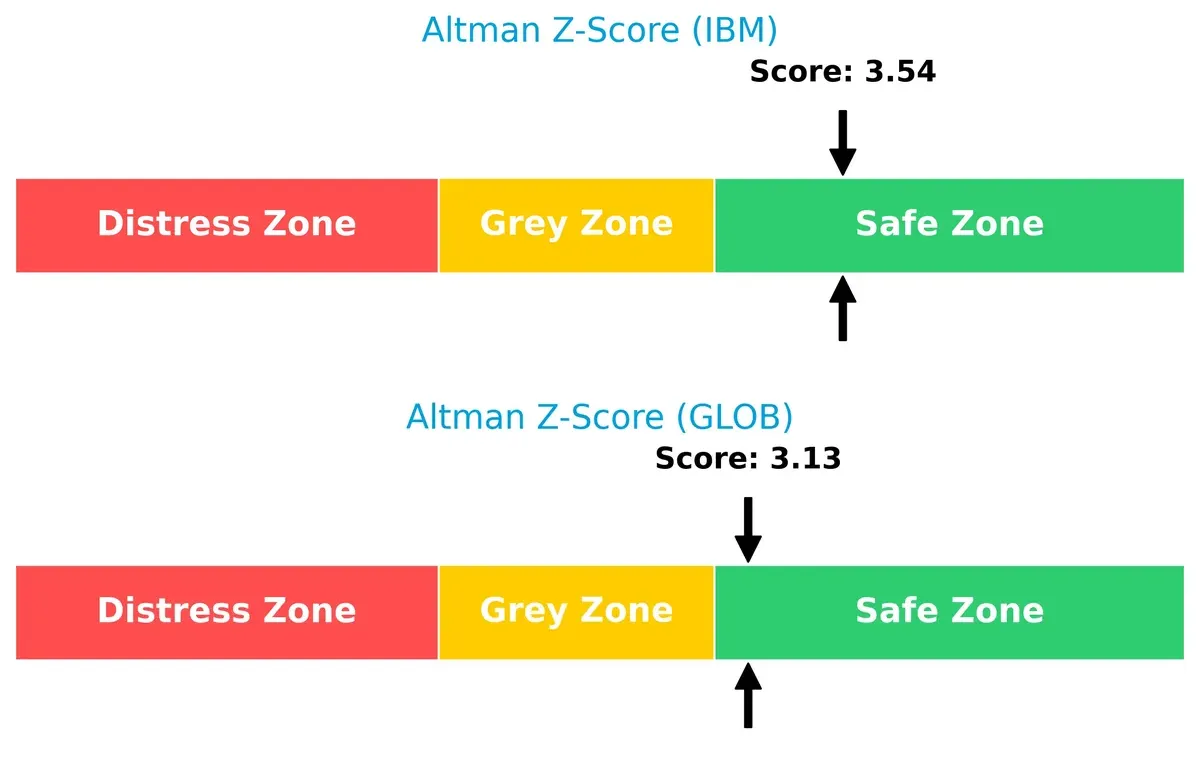
Bankruptcy Risk: Solvency Showdown
IBM’s Altman Z-Score of 3.54 versus Globant’s 3.13 places both firms securely in the safe zone, signaling strong long-term solvency in the current market cycle:
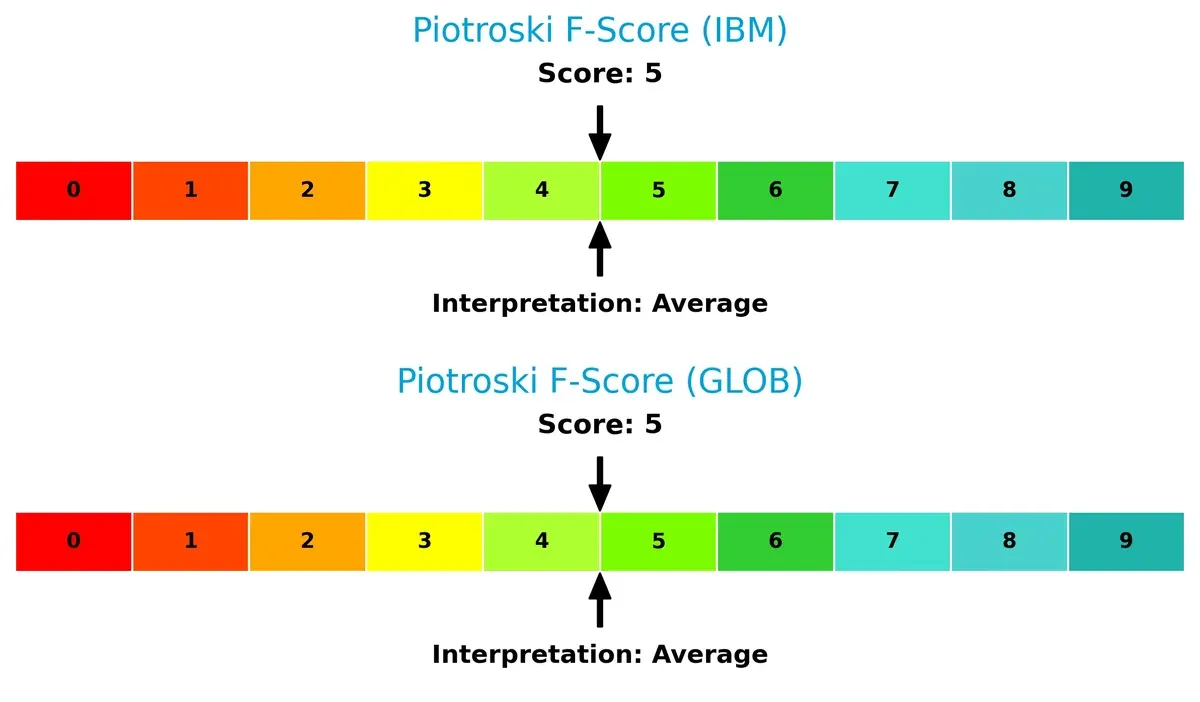
Financial Health: Quality of Operations
Both companies share an identical Piotroski F-Score of 5, indicating average financial health. Neither firm currently flags severe internal weaknesses, but neither demonstrates peak operational strength either:
How are the two companies positioned?
This section dissects IBM and Globant’s operational DNA by comparing their revenue distribution and internal strengths and weaknesses. The goal is to confront their economic moats to identify which model offers the most resilient competitive advantage today.
Revenue Segmentation: The Strategic Mix
The following visual comparison dissects how both firms diversify their income streams and where their primary sector bets lie:
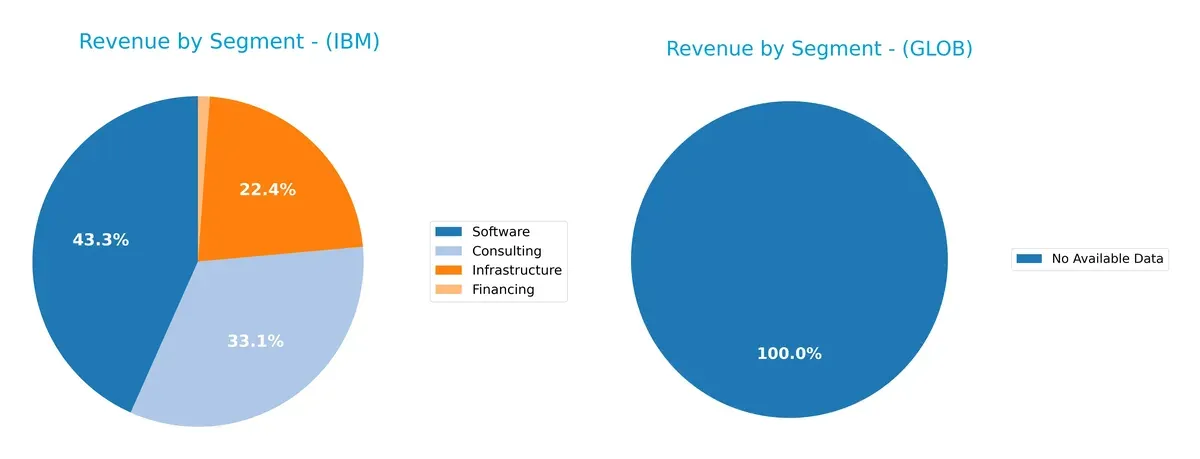
International Business Machines Corporation (IBM) anchors revenue in Software ($27.1B) and Consulting ($20.7B), complemented by Infrastructure ($14B) and a small Financing segment ($713M). Globant S.A. lacks available data for segmentation, preventing a direct comparison. IBM’s revenue mix reveals a diversified approach balancing software innovation and consulting services, reducing concentration risk while leveraging ecosystem lock-in across tech infrastructure and software.
Strengths and Weaknesses Comparison
This table compares the Strengths and Weaknesses of IBM and Globant (GLOB):
IBM Strengths
- Diversified revenue streams across Software, Consulting, Infrastructure, and Financing
- Strong global presence with significant Americas, EMEA, and Asia Pacific sales
- Favorable net margin of 15.7%
- Solid interest coverage ratio at 6.34
- Low debt-to-assets ratio signaling financial prudence
GLOB Strengths
- Favorable liquidity ratios: current and quick ratio at 1.54
- Low debt-to-assets ratio of 12.95% with good interest coverage of 8.87
- Positive asset turnover and fixed asset turnover metrics
- Global revenue spread across North America, Latin America, Europe, and Asia
- Neutral net margin and ROIC indicating operational stability
IBM Weaknesses
- Unfavorable ROE and ROIC at 0% indicating poor capital efficiency
- Poor liquidity ratios: current and quick ratios at 0
- High P/E ratio of 26.07 rated unfavorable
- Unfavorable asset and fixed asset turnover
- Slightly unfavorable global ratios evaluation
- Relatively low dividend yield of 2.27%
GLOB Weaknesses
- High P/E and P/B ratios of 57.64 and 4.86 signaling possible overvaluation
- Unfavorable ROE at 8.44% and no dividend yield
- Net margin only neutral at 6.86%
- Smaller scale and less diversified revenue compared to IBM
- Some neutral financial metrics reducing overall strength
IBM demonstrates strong diversification and global reach but struggles with capital efficiency and liquidity. GLOB shows financial stability and favorable liquidity but faces valuation concerns and limited profitability. These contrasts highlight differing strategic and operational profiles.
The Moat Duel: Analyzing Competitive Defensibility
A structural moat is the critical fortress protecting a company’s long-term profits from relentless competitive erosion. Let’s evaluate the contenders:
International Business Machines Corporation: Intangible Assets Fortress
IBM’s moat stems from deep intangible assets—its hybrid cloud platform, AI, and security software. This manifests in margin stability and robust net margin of 15.7%. However, declining ROIC signals pressure on capital efficiency entering 2026.
Globant S.A.: Agility Through Innovation
Globant leverages agile digital services and platform innovation as its moat, contrasting IBM’s legacy base. Its growing ROIC and rapid revenue expansion suggest improving competitive positioning despite current value destruction signals.
Legacy Intangibles vs. Agile Innovation: The Moat Face-Off
IBM’s intangible asset moat is wider but shows signs of capital efficiency erosion. Globant’s moat is narrower but deepening, fueled by accelerating ROIC growth. I consider IBM better equipped to defend entrenched market share; Globant’s moat, however, could widen with sustained innovation.
Which stock offers better returns?
The past 12 months reveal stark contrasts: IBM’s stock rose 56.5% with slowing momentum, while Globant dropped 68.5% despite recent acceleration and increased buyer dominance.
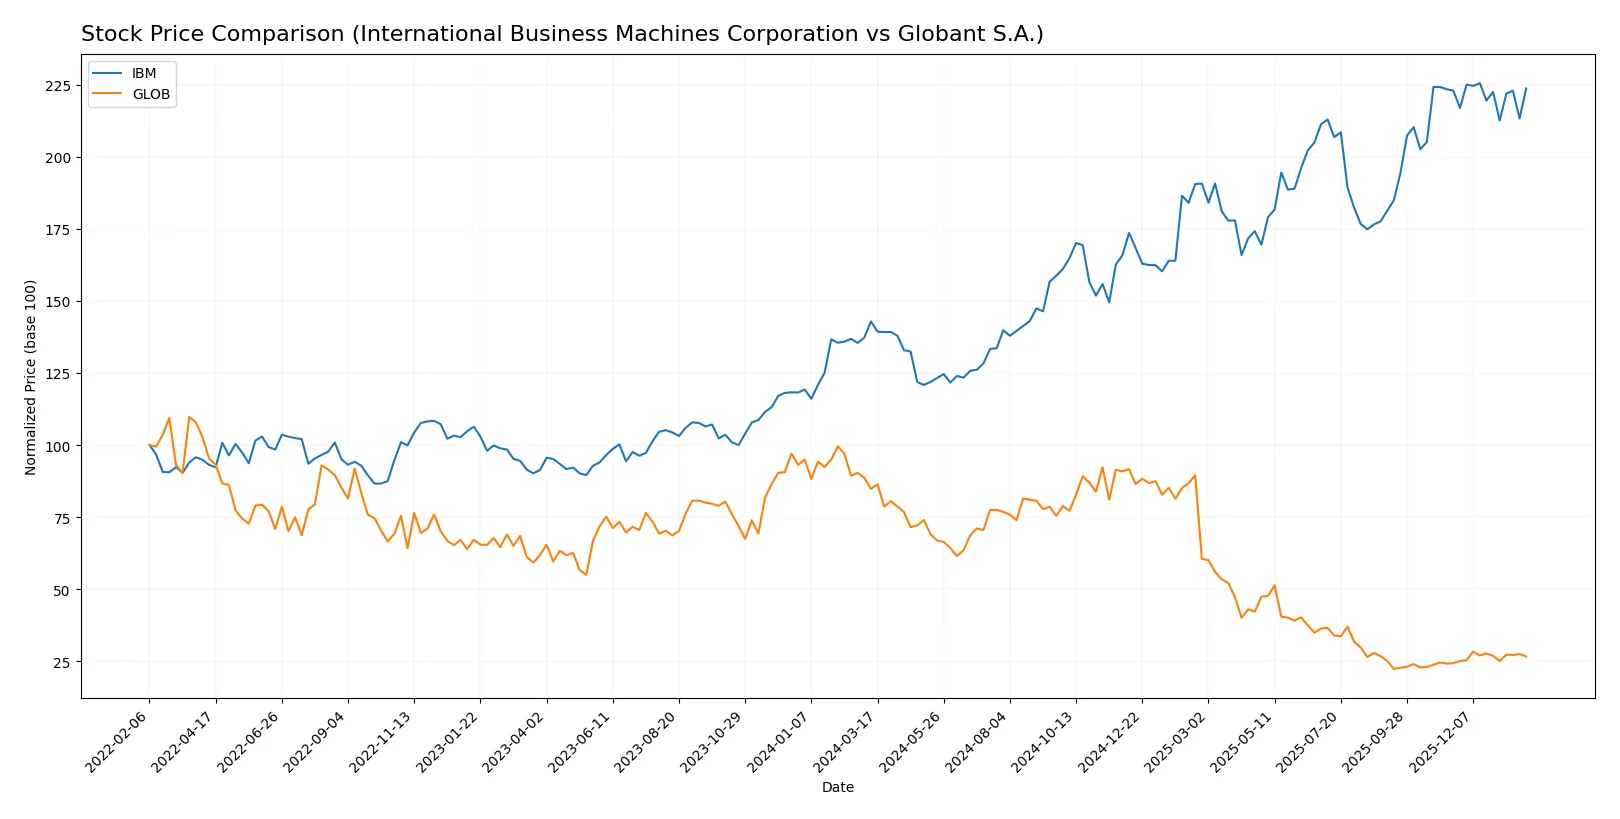
Trend Comparison
IBM’s stock shows a strong bullish trend over the last year, gaining 56.5% with decelerating growth and high volatility, ranging between 165.71 and 309.24. Recent weeks show neutral movement.
Globant’s stock displays a bearish trend with a 68.5% loss over the year, accelerating downward amid high volatility. Recently, it rebounded 9.5%, showing buyer dominance and positive slope.
IBM outperformed Globant significantly, delivering superior market returns despite recent neutral trends, while Globant’s overall performance remains deeply negative despite short-term gains.
Target Prices
Analyst consensus projects solid upside potential for both International Business Machines Corporation and Globant S.A.
| Company | Target Low | Target High | Consensus |
|---|---|---|---|
| International Business Machines Corporation | 304 | 380 | 349.5 |
| Globant S.A. | 68 | 80 | 73.75 |
IBM’s target consensus sits about 14% above its current price of $306.7, reflecting confidence in its hybrid cloud and AI segments. Globant’s $73.75 target exceeds its $66.88 share price by roughly 10%, signaling optimism despite sector volatility.

Don’t Let Luck Decide Your Entry Point
Optimize your entry points with our advanced ProRealTime indicators. You’ll get efficient buy signals with precise price targets for maximum performance. Start outperforming now!
How do institutions grade them?
Institutional grades for International Business Machines Corporation and Globant S.A. are summarized below:
International Business Machines Corporation Grades
The following table shows recent grades from reputable grading firms for IBM:
| Grading Company | Action | New Grade | Date |
|---|---|---|---|
| Wedbush | maintain | Outperform | 2026-01-29 |
| RBC Capital | maintain | Outperform | 2026-01-29 |
| Stifel | maintain | Buy | 2026-01-29 |
| JP Morgan | maintain | Neutral | 2026-01-29 |
| UBS | maintain | Sell | 2026-01-29 |
| Evercore ISI Group | maintain | Outperform | 2026-01-29 |
| Jefferies | maintain | Buy | 2026-01-29 |
| JP Morgan | maintain | Neutral | 2026-01-21 |
| Evercore ISI Group | maintain | Outperform | 2026-01-20 |
| B of A Securities | maintain | Buy | 2026-01-13 |
Globant S.A. Grades
Recent grades from established firms for Globant S.A. are listed as follows:
| Grading Company | Action | New Grade | Date |
|---|---|---|---|
| Wells Fargo | maintain | Equal Weight | 2026-01-14 |
| Jefferies | downgrade | Hold | 2025-11-20 |
| UBS | maintain | Neutral | 2025-11-18 |
| Needham | maintain | Buy | 2025-11-14 |
| Canaccord Genuity | maintain | Hold | 2025-11-14 |
| JP Morgan | maintain | Neutral | 2025-11-14 |
| Goldman Sachs | maintain | Neutral | 2025-10-09 |
| UBS | maintain | Neutral | 2025-08-20 |
| Goldman Sachs | maintain | Neutral | 2025-08-18 |
| Needham | maintain | Buy | 2025-08-15 |
Which company has the best grades?
IBM generally receives stronger grades like Outperform and Buy from multiple firms. Globant’s ratings are more mixed, centered on Neutral and Hold. This difference may affect investor confidence and portfolio positioning.
Risks specific to each company
The following categories identify the critical pressure points and systemic threats facing both firms in the 2026 market environment:
1. Market & Competition
International Business Machines Corporation
- Established IT giant with broad service lines but faces intense competition from cloud-native firms and platform specialists.
Globant S.A.
- Agile digital-native player in tech services; competes in niche, fast-evolving segments but vulnerable to rapid technological shifts and client concentration.
2. Capital Structure & Debt
International Business Machines Corporation
- Low debt-to-equity and debt-to-assets ratios signal conservative leverage, but some financial ratios are unavailable, raising transparency concerns.
Globant S.A.
- Moderate leverage with manageable debt levels and good interest coverage; capital structure appears balanced for growth and risk.
3. Stock Volatility
International Business Machines Corporation
- Beta of 0.70 indicates lower volatility than market average, appealing for risk-averse investors.
Globant S.A.
- Beta of 1.20 suggests higher volatility, reflecting growth stock characteristics and greater market sensitivity.
4. Regulatory & Legal
International Business Machines Corporation
- Global operations expose IBM to complex regulatory environments and legacy compliance risks, especially in data security and financial services.
Globant S.A.
- Operating mainly from Luxembourg with global clients, faces evolving EU regulations and data privacy laws that could impact service delivery.
5. Supply Chain & Operations
International Business Machines Corporation
- Large-scale infrastructure and hardware components risk supply chain disruptions, though diversified service model mitigates impact.
Globant S.A.
- Primarily service-based with limited physical supply chain dependency, but operational scalability could be challenged by rapid client growth.
6. ESG & Climate Transition
International Business Machines Corporation
- Long-term sustainability initiatives underway, but legacy operations may lag in meeting aggressive ESG targets compared to peers.
Globant S.A.
- Digital-first model benefits from lower carbon footprint, but increasing client demands require proactive ESG strategy to maintain reputation.
7. Geopolitical Exposure
International Business Machines Corporation
- US-based with significant global presence; geopolitical tensions and trade restrictions could disrupt international contracts.
Globant S.A.
- Luxembourg headquarters with global operations; exposure to EU political shifts and global trade dynamics presents moderate geopolitical risk.
Which company shows a better risk-adjusted profile?
IBM’s most impactful risk is its legacy operational complexity and opaque financial ratios, increasing uncertainty despite conservative leverage. Globant faces higher market volatility but benefits from a more transparent capital structure and growth-oriented positioning. Globant’s slightly favorable financial ratios and safer Altman Z-Score zone signal a better risk-adjusted profile. Notably, Globant’s higher beta reflects growth risks but also potential upside. IBM’s balance sheet opacity remains a cautionary flag for disciplined investors.
Final Verdict: Which stock to choose?
International Business Machines Corporation (IBM) excels as a cash-generating powerhouse with solid profitability and a robust dividend yield. Its main point of vigilance lies in its declining ROIC trend and moderate financial ratios, signaling pressure on capital efficiency. IBM suits portfolios focused on stable income and value preservation.
Globant S.A. stands out with its digital transformation moat and improving profitability, supported by a healthier balance sheet and higher liquidity ratios. Despite a premium valuation and lower dividend, it offers better growth potential with less financial risk than IBM. Globant fits growth-oriented portfolios seeking innovation exposure.
If you prioritize reliable cash flow and income stability, IBM is the compelling choice due to its strong operating cash generation and dividend. However, if you seek growth with improving capital efficiency and a cleaner balance sheet, Globant offers better upside potential despite its higher valuation. Both require cautious monitoring of their evolving fundamentals.
Disclaimer: Investment carries a risk of loss of initial capital. The past performance is not a reliable indicator of future results. Be sure to understand risks before making an investment decision.
Go Further
I encourage you to read the complete analyses of International Business Machines Corporation and Globant S.A. to enhance your investment decisions: