In the fast-evolving semiconductor industry, GLOBALFOUNDRIES Inc. (GFS) and Tower Semiconductor Ltd. (TSEM) stand out as key players shaping technology’s future. Both specialize in foundry services but differ in market focus and innovation approaches, with GFS emphasizing mainstream wafer fabrication and TSEM offering diverse analog and mixed-signal solutions. This comparison will help investors identify which company offers the most promising opportunity in this competitive sector. Let’s explore their strengths together.
Table of contents
Companies Overview
I will begin the comparison between GLOBALFOUNDRIES Inc. and Tower Semiconductor Ltd. by providing an overview of these two companies and their main differences.
GLOBALFOUNDRIES Inc. Overview
GLOBALFOUNDRIES Inc. operates as a semiconductor foundry worldwide, manufacturing integrated circuits that power diverse electronic devices. Its product range includes microprocessors, mobile application processors, and other semiconductor devices. Founded in 2009 and based in Malta, NY, the company supports mainstream wafer fabrication services and advanced technologies, positioning itself as a key player in the semiconductor industry.
Tower Semiconductor Ltd. Overview
Tower Semiconductor Ltd. is an independent semiconductor foundry specializing in analog intensive mixed-signal semiconductor devices. Headquartered in Migdal Haemek, Israel, it offers customizable process technologies across several markets, including automotive, aerospace, and medical devices. Incorporated in 1993, Tower provides wafer fabrication, design enablement, and development process services to integrated device manufacturers and fabless companies globally.
Key similarities and differences
Both companies operate in the semiconductor foundry industry, providing wafer fabrication services and advanced technology solutions. However, GLOBALFOUNDRIES emphasizes a broad integrated circuit portfolio, while Tower focuses on analog mixed-signal semiconductors and customizable process technologies. GLOBALFOUNDRIES is US-based with a larger workforce, whereas Tower is Israeli with a more specialized market focus and fewer employees.
Income Statement Comparison
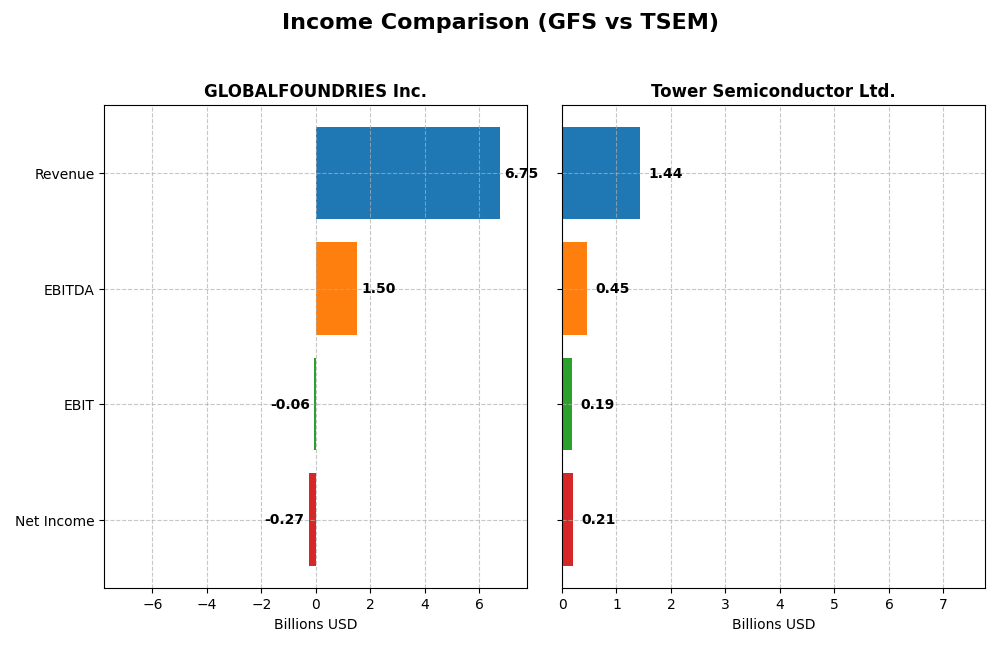
The table below compares key income statement metrics for GLOBALFOUNDRIES Inc. and Tower Semiconductor Ltd. for the fiscal year 2024, providing a snapshot of their financial performance.
| Metric | GLOBALFOUNDRIES Inc. | Tower Semiconductor Ltd. |
|---|---|---|
| Market Cap | 23B | 13.9B |
| Revenue | 6.75B | 1.44B |
| EBITDA | 1.50B | 451M |
| EBIT | -64M | 185M |
| Net Income | -265M | 208M |
| EPS | -0.48 | 1.87 |
| Fiscal Year | 2024 | 2024 |
Income Statement Interpretations
GLOBALFOUNDRIES Inc.
GLOBALFOUNDRIES showed a 39.15% revenue growth from 2020 to 2024, but a decline of 8.69% in the last year. Net income followed a similar pattern, growing 80.37% over the period but turning negative in 2024 at -$265M. Gross margin remained favorable at 24.46%, yet EBIT and net margins deteriorated, reflecting operational challenges in the latest year.
Tower Semiconductor Ltd.
Tower Semiconductor’s revenue increased 13.47% over five years, with a modest 0.94% rise in 2024. Net income surged 152.56% over the period but declined 60.3% last year to $208M. Margins are robust, with a 14.47% net margin and 12.88% EBIT margin in 2024. Despite recent margin compression, the company retains overall favorable profitability metrics.
Which one has the stronger fundamentals?
Tower Semiconductor displays stronger fundamentals, supported by consistently favorable margins and higher net income growth overall, despite recent declines. GLOBALFOUNDRIES, while showing long-term growth, faces unfavorable net and EBIT margins and a negative net income in 2024. This contrast highlights Tower’s relative operational and profitability stability.
Financial Ratios Comparison
Below is a comparison of key financial ratios for GLOBALFOUNDRIES Inc. (GFS) and Tower Semiconductor Ltd. (TSEM) based on their most recent fiscal year data (2024).
| Ratios | GLOBALFOUNDRIES Inc. (GFS) | Tower Semiconductor Ltd. (TSEM) |
|---|---|---|
| ROE | -2.46% | 7.83% |
| ROIC | -1.47% | 6.41% |
| P/E | -89.54 | 27.54 |
| P/B | 2.20 | 2.16 |
| Current Ratio | 2.11 | 6.18 |
| Quick Ratio | 1.57 | 5.23 |
| D/E (Debt-to-Equity) | 0.22 | 0.07 |
| Debt-to-Assets | 13.81% | 5.87% |
| Interest Coverage | -1.48 | 32.64 |
| Asset Turnover | 0.40 | 0.47 |
| Fixed Asset Turnover | 0.82 | 1.11 |
| Payout ratio | 0 | 0 |
| Dividend yield | 0 | 0 |
Interpretation of the Ratios
GLOBALFOUNDRIES Inc.
GLOBALFOUNDRIES shows several unfavorable profitability ratios, including negative net margin (-3.93%), ROE (-2.46%), and ROIC (-1.47%), indicating weak earnings performance. The company’s leverage and liquidity ratios are favorable, with a current ratio of 2.11 and low debt to assets at 13.81%. GLOBALFOUNDRIES does not pay dividends, likely reflecting its reinvestment strategy amid ongoing operational challenges.
Tower Semiconductor Ltd.
Tower Semiconductor presents a mixed profile with a favorable net margin of 14.47% but an unfavorable ROE of 7.83%, suggesting moderate profitability. Its capital structure is solid, with low debt to equity (0.07) and strong interest coverage at 31.57. The company also does not pay dividends, possibly prioritizing growth or R&D, supported by a high quick ratio of 5.23 and a neutral fixed asset turnover.
Which one has the best ratios?
Tower Semiconductor’s ratios are generally more favorable, with better profitability and stronger interest coverage than GLOBALFOUNDRIES. Although TSEM’s ROE and asset turnover show some weaknesses, its liquidity and capital management metrics outperform GFS. GLOBALFOUNDRIES faces more significant profitability and efficiency challenges, reflected in its predominantly unfavorable ratios.
Strategic Positioning
This section compares the strategic positioning of GLOBALFOUNDRIES Inc. and Tower Semiconductor Ltd., including market position, key segments, and exposure to disruption:
GLOBALFOUNDRIES Inc.
- Large foundry with 23B market cap, faces high competitive pressure in global semiconductor industry.
- Key segments: wafer fabrication (6B+ revenue), engineering/pre-fab services; broad semiconductor device range.
- Exposure to technological disruption through advanced wafer fabrication technologies and MEMS; no explicit disruption details.
Tower Semiconductor Ltd.
- Smaller 13.9B market cap; competes in analog mixed-signal semiconductor foundry markets.
- Focus on analog intensive mixed-signal devices; serves consumer, automotive, industrial, aerospace, and medical.
- Offers customizable process technologies including SiGe, BiCMOS, RF CMOS, and MEMS; supports fabless and IDM clients.
GLOBALFOUNDRIES Inc. vs Tower Semiconductor Ltd. Positioning
GLOBALFOUNDRIES has a diversified business with large-scale wafer fabrication and engineering services, while Tower focuses on specialized analog mixed-signal technologies and diverse end markets. GLOBALFOUNDRIES’ scale contrasts with Tower’s niche technology-driven approach.
Which has the best competitive advantage?
Both companies show slightly unfavorable moat evaluations, shedding value but improving profitability. GLOBALFOUNDRIES has a larger scale but both face value destruction challenges, indicating no clear superior competitive advantage based solely on MOAT data.
Stock Comparison
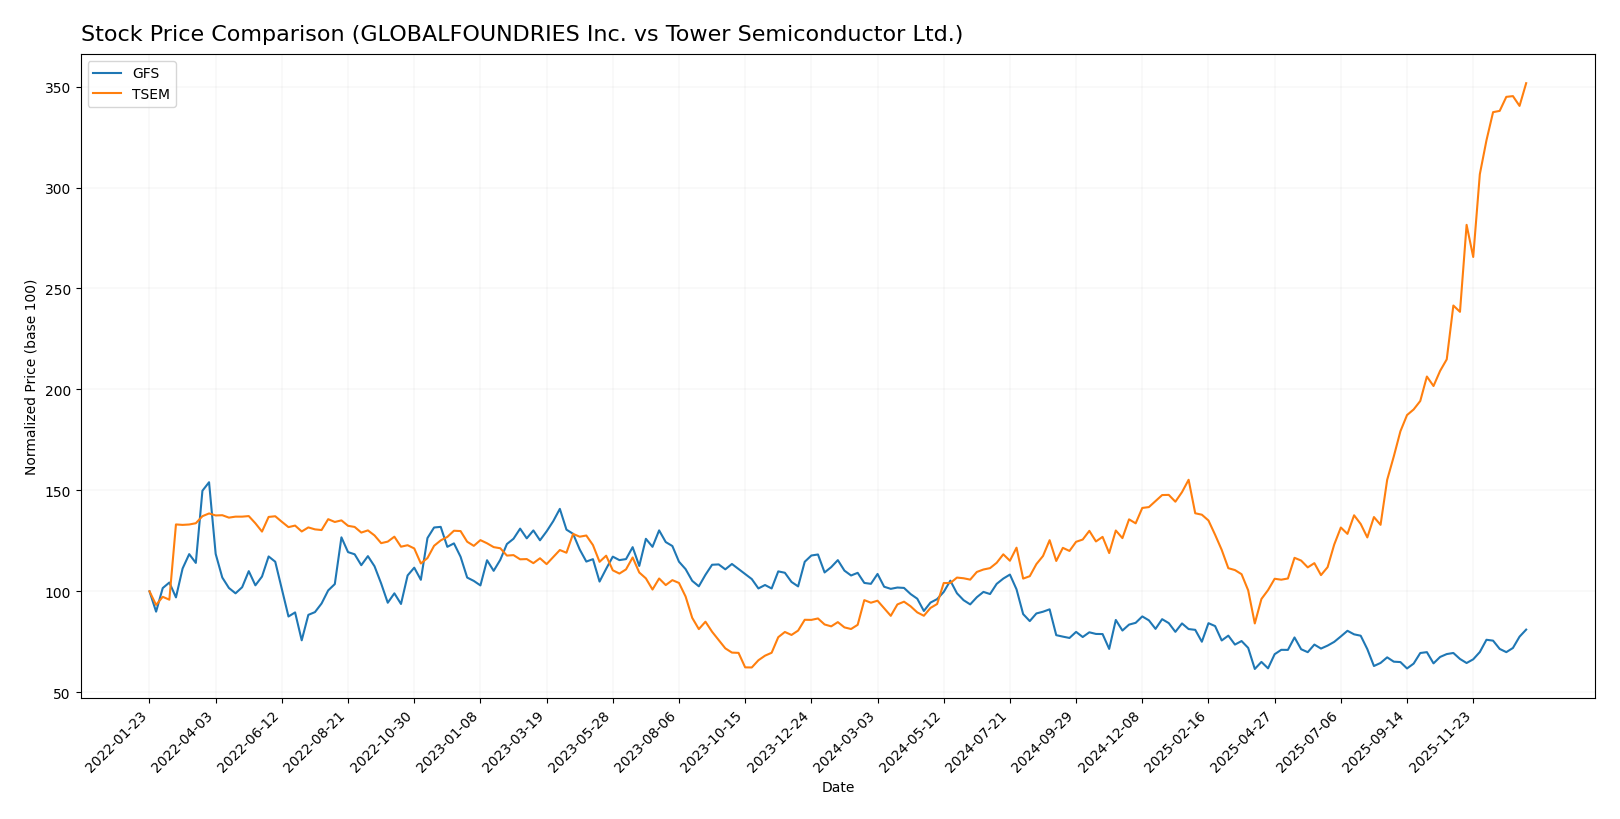
The stock price movements of GLOBALFOUNDRIES Inc. and Tower Semiconductor Ltd. over the past year reveal contrasting trading dynamics, with significant divergences in trend direction and market momentum.
Trend Analysis
GLOBALFOUNDRIES Inc. experienced a bearish trend over the past 12 months, with a price decline of 21.86%. The trend showed acceleration, a high volatility level (std deviation 6.45), and recorded a low at 31.54 and a high at 55.66.
Tower Semiconductor Ltd. exhibited a strong bullish trend over the same period, with a price increase of 272.71% and accelerating momentum. The stock showed high volatility (std deviation 23.67) and traded between 29.65 and 124.0.
Comparing these trends, Tower Semiconductor Ltd. delivered the highest market performance with a substantial price gain, markedly outperforming GLOBALFOUNDRIES Inc.’s decline.
Target Prices
The current analyst consensus reveals varied target prices for GLOBALFOUNDRIES Inc. and Tower Semiconductor Ltd.
| Company | Target High | Target Low | Consensus |
|---|---|---|---|
| GLOBALFOUNDRIES Inc. | 40 | 37 | 38.5 |
| Tower Semiconductor Ltd. | 125 | 66 | 96 |
Analysts expect GLOBALFOUNDRIES’ price to be slightly below its current level of 41.53 USD, while Tower Semiconductor shows a consensus target below its current 124 USD, indicating potential downside pressure.
Analyst Opinions Comparison
This section compares analysts’ ratings and grades for GLOBALFOUNDRIES Inc. and Tower Semiconductor Ltd.:
Rating Comparison
GLOBALFOUNDRIES Inc. Rating
- Rating: C+ with a Very Favorable status
- Discounted Cash Flow Score: 3, indicating moderate value
- ROE Score: 1, considered very unfavorable
- ROA Score: 1, considered very unfavorable
- Debt To Equity Score: 3, indicating moderate financial risk
- Overall Score: 2, moderate overall assessment
Tower Semiconductor Ltd. Rating
- Rating: B+ with a Very Favorable status
- Discounted Cash Flow Score: 3, indicating moderate value
- ROE Score: 3, considered moderate
- ROA Score: 4, considered favorable
- Debt To Equity Score: 4, indicating favorable financial risk
- Overall Score: 3, moderate overall assessment
Which one is the best rated?
Based strictly on the provided data, Tower Semiconductor Ltd. holds a higher rating (B+) than GLOBALFOUNDRIES Inc. (C+) and scores better in ROE, ROA, Debt to Equity, and overall score, indicating stronger analyst favorability.
Scores Comparison
Here is a comparison of the Altman Z-Score and Piotroski Score for both companies:
GFS Scores
- Altman Z-Score: 2.61, indicating a grey zone risk level
- Piotroski Score: 6, reflecting average financial strength
TSEM Scores
- Altman Z-Score: 21.06, indicating a safe zone status
- Piotroski Score: 7, reflecting strong financial health
Which company has the best scores?
Based on the provided data, TSEM shows a significantly safer Altman Z-Score and a stronger Piotroski Score compared to GFS. Thus, TSEM has the better scores in terms of financial stability and strength.
Grades Comparison
Here is the grades comparison for GLOBALFOUNDRIES Inc. and Tower Semiconductor Ltd.:
GLOBALFOUNDRIES Inc. Grades
The following table summarizes recent grades assigned by notable grading companies for GLOBALFOUNDRIES Inc.:
| Grading Company | Action | New Grade | Date |
|---|---|---|---|
| Wedbush | Downgrade | Neutral | 2025-12-31 |
| B of A Securities | Maintain | Underperform | 2025-12-04 |
| Evercore ISI Group | Maintain | Outperform | 2025-11-13 |
| JP Morgan | Maintain | Neutral | 2025-11-13 |
| Citigroup | Maintain | Neutral | 2025-11-13 |
| Wedbush | Maintain | Outperform | 2025-11-13 |
| B of A Securities | Downgrade | Underperform | 2025-10-13 |
| Deutsche Bank | Maintain | Buy | 2025-08-06 |
| Morgan Stanley | Maintain | Equal Weight | 2025-08-06 |
| Wedbush | Maintain | Outperform | 2025-08-06 |
GLOBALFOUNDRIES shows a mixed trend with recent downgrades to Neutral and Underperform from previously stronger ratings, indicating some caution among analysts.
Tower Semiconductor Ltd. Grades
Below are recent grades provided to Tower Semiconductor Ltd. by recognized grading firms:
| Grading Company | Action | New Grade | Date |
|---|---|---|---|
| Benchmark | Maintain | Buy | 2026-01-09 |
| Wedbush | Downgrade | Neutral | 2025-12-31 |
| Benchmark | Maintain | Buy | 2025-11-11 |
| Susquehanna | Maintain | Positive | 2025-11-11 |
| Wedbush | Maintain | Outperform | 2025-11-11 |
| Barclays | Maintain | Equal Weight | 2025-11-11 |
| Benchmark | Maintain | Buy | 2025-09-08 |
| Susquehanna | Maintain | Positive | 2025-08-05 |
| Benchmark | Maintain | Buy | 2025-08-05 |
| Benchmark | Maintain | Buy | 2025-08-04 |
Tower Semiconductor generally maintains strong Buy and Positive ratings, though there was a recent downgrade by Wedbush to Neutral.
Which company has the best grades?
Tower Semiconductor Ltd. has received consistently stronger grades with multiple Buy and Positive ratings compared to GLOBALFOUNDRIES Inc., which has seen several downgrades to Neutral and Underperform. This could suggest more positive analyst sentiment for Tower Semiconductor, potentially influencing investor confidence and portfolio decisions.
Strengths and Weaknesses
The table below summarizes the key strengths and weaknesses of GLOBALFOUNDRIES Inc. (GFS) and Tower Semiconductor Ltd. (TSEM) based on their recent financial and strategic performance indicators.
| Criterion | GLOBALFOUNDRIES Inc. (GFS) | Tower Semiconductor Ltd. (TSEM) |
|---|---|---|
| Diversification | Moderate diversification: dominant revenue from Water Fabrication (6.1B in 2024) and smaller Engineering Services segment (652M) | Narrower focus, mainly semiconductor manufacturing |
| Profitability | Negative net margin (-3.93%), ROIC slightly negative (-1.47%), overall value destruction but improving ROIC trend | Positive net margin (14.47%), ROIC (6.41%) near cost of capital, slightly favorable profitability trend |
| Innovation | Investment in pre-fabrication engineering services supports innovation but not yet reflected in margins | Continuous product technology upgrades, above-average interest coverage (31.57) suggests strong operational efficiency |
| Global presence | Large-scale operations with global clients, evidenced by strong Water Fabrication revenue | Smaller scale but growing presence in specialty semiconductor markets |
| Market Share | Significant in wafer fabrication but challenged by profitability issues | Growing market share in niche semiconductor segments, supported by stable financial ratios |
Key takeaway: GLOBALFOUNDRIES shows strong revenue scale and diversification but struggles with profitability and value creation, although improving. Tower Semiconductor demonstrates better profitability and financial health, with a slightly favorable outlook, making it a more stable choice for risk-conscious investors.
Risk Analysis
Below is a comparative risk assessment for GLOBALFOUNDRIES Inc. (GFS) and Tower Semiconductor Ltd. (TSEM) based on their latest financial and operational data for 2024.
| Metric | GLOBALFOUNDRIES Inc. (GFS) | Tower Semiconductor Ltd. (TSEM) |
|---|---|---|
| Market Risk | High beta of 1.485 indicates higher volatility and market sensitivity. | Lower beta of 0.876 suggests less volatility and more stability. |
| Debt level | Moderate debt-to-equity ratio at 0.22; debt-to-assets at 13.81% (favorable). | Low debt-to-equity at 0.07; debt-to-assets at 5.87% (favorable). |
| Regulatory Risk | US-based, exposed to complex semiconductor export controls and trade policies. | Israel-based, potentially affected by regional regulations and export constraints. |
| Operational Risk | Negative net margin (-3.93%) and unfavorable return metrics imply operational inefficiencies. | Positive net margin (14.47%) and stronger operational scores indicate better efficiency. |
| Environmental Risk | Semiconductor manufacturing involves hazardous materials; risk mitigation policies not detailed. | Similar environmental exposure; no specific mitigation details publicly available. |
| Geopolitical Risk | US-China tensions impact semiconductor supply chains affecting GFS. | Regional geopolitical tensions in the Middle East could disrupt operations or supply chains. |
The most critical risks are operational inefficiency and market volatility for GLOBALFOUNDRIES, given its negative profitability and higher beta. Tower Semiconductor shows stronger financial health but remains exposed to geopolitical risks inherent to its location. Investors should weigh these factors carefully within a diversified portfolio.
Which Stock to Choose?
GLOBALFOUNDRIES Inc. (GFS) shows a mixed income evolution with a 39.15% revenue growth over 2020-2024 but a negative net margin of -3.93% in 2024. Its financial ratios are mostly unfavorable, including negative ROE and ROIC, yet it maintains low debt and a solid current ratio. The company has a slightly unfavorable moat, implying value destruction despite improving profitability, and holds a moderate overall rating of C+.
Tower Semiconductor Ltd. (TSEM) presents a favorable income profile with a 13.47% revenue growth and a 14.47% net margin in 2024. Financial ratios are slightly favorable overall, with strong liquidity and low debt, though some ratios like ROE are moderate. Its moat status is also slightly unfavorable with growing ROIC, and it has a higher overall rating of B+ supported by strong Altman Z-Score and Piotroski scores indicating financial strength.
Considering ratings and financial evaluations, TSEM might appear more favorable for investors seeking a balance of growth and financial stability, whereas GFS could be interpreted as more suitable for those willing to tolerate higher risk amid potential profitability recovery and value creation prospects.
Disclaimer: Investment carries a risk of loss of initial capital. The past performance is not a reliable indicator of future results. Be sure to understand risks before making an investment decision.
Go Further
I encourage you to read the complete analyses of GLOBALFOUNDRIES Inc. and Tower Semiconductor Ltd. to enhance your investment decisions: