In the fast-evolving semiconductor industry, Teradyne, Inc. and GLOBALFOUNDRIES Inc. stand out as key players with distinct approaches to innovation and market presence. Teradyne specializes in advanced test equipment and automation solutions, while GLOBALFOUNDRIES focuses on semiconductor manufacturing and wafer fabrication. This comparison explores their strategic positions and growth potential, helping you identify which company could be the smarter addition to your investment portfolio.
Table of contents
Companies Overview
I will begin the comparison between Teradyne and GLOBALFOUNDRIES by providing an overview of these two companies and their main differences.
Teradyne Overview
Teradyne, Inc. specializes in designing, developing, manufacturing, and supporting automatic test equipment worldwide. Its product portfolio spans Semiconductor Test, System Test, Industrial Automation, and Wireless Test segments. Teradyne serves integrated device manufacturers, fabless companies, foundries, and test providers, positioning itself as a key player in semiconductor testing and automation. The company is headquartered in North Reading, Massachusetts, and employs about 6,500 people.
GLOBALFOUNDRIES Overview
GLOBALFOUNDRIES Inc. operates as a semiconductor foundry, producing integrated circuits that power various electronic devices globally. Its manufacturing capabilities include microprocessors, mobile application processors, and other semiconductor devices alongside wafer fabrication services. Founded in 2009 and based in Malta, New York, GLOBALFOUNDRIES employs approximately 13,000 people, marking it as a significant player in semiconductor manufacturing.
Key similarities and differences
Both Teradyne and GLOBALFOUNDRIES operate within the semiconductor industry but focus on different segments. Teradyne emphasizes test equipment and automation solutions, supporting semiconductor production and wireless device testing. In contrast, GLOBALFOUNDRIES concentrates on manufacturing semiconductor wafers and integrated circuits. While both serve the semiconductor market, Teradyne’s business model centers on testing technologies, whereas GLOBALFOUNDRIES is a pure-play foundry focused on chip fabrication.
Income Statement Comparison
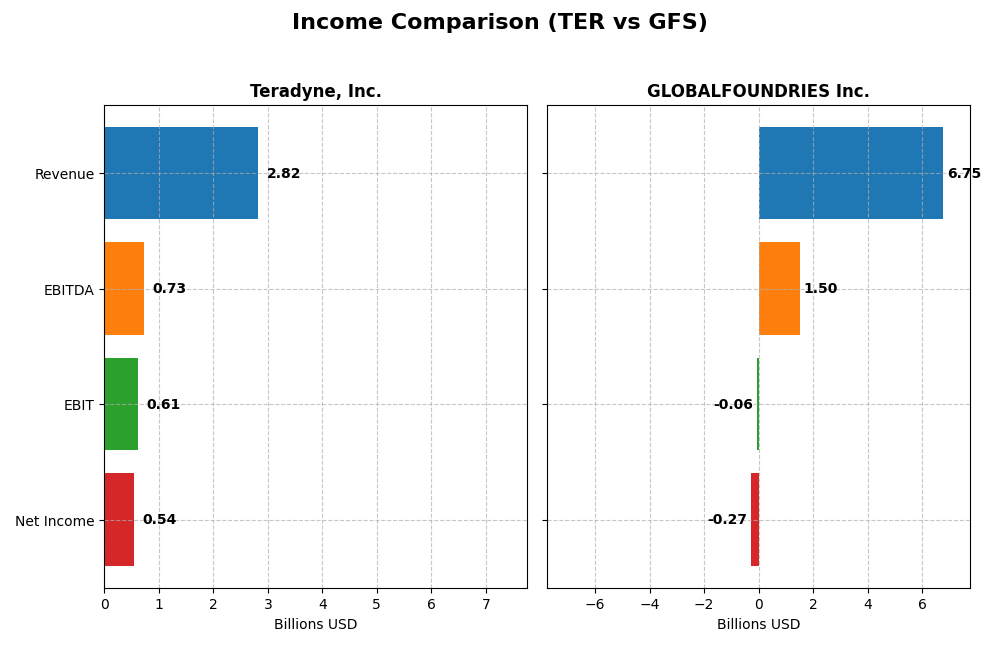
The table below compares key income statement metrics for Teradyne, Inc. and GLOBALFOUNDRIES Inc. for the fiscal year 2024, providing a snapshot of their financial performance.
| Metric | Teradyne, Inc. (TER) | GLOBALFOUNDRIES Inc. (GFS) |
|---|---|---|
| Market Cap | 36.6B | 23.0B |
| Revenue | 2.82B | 6.75B |
| EBITDA | 732M | 1.50B |
| EBIT | 613M | -64M |
| Net Income | 542M | -265M |
| EPS | 3.41 | -0.48 |
| Fiscal Year | 2024 | 2024 |
Income Statement Interpretations
Teradyne, Inc.
Teradyne’s revenue declined by 9.66% over the 2020-2024 period, with net income falling 30.83%, reflecting overall downward trends. Margins remained solid, with a gross margin of 58.48% and a favorable net margin of 19.23%. In 2024, revenue growth slowed to 5.36%, but net margin and EPS showed notable improvement, signaling operational efficiency gains.
GLOBALFOUNDRIES Inc.
GLOBALFOUNDRIES experienced a 39.15% revenue increase from 2020 to 2024, alongside an 80.37% rise in net income, indicating strong growth momentum. However, the 2024 fiscal year saw revenue decline by 8.69%, with gross profit and EBIT margins deteriorating, resulting in a negative EBIT margin of -0.95% and net margin of -3.93%, highlighting recent profitability challenges.
Which one has the stronger fundamentals?
Teradyne demonstrates stronger fundamentals with consistently favorable margins, including a robust gross margin and positive net margin, coupled with operational improvements in 2024. GLOBALFOUNDRIES, despite notable growth over five years, faced significant margin compression and losses in the latest year, undermining its income statement strength relative to Teradyne’s more stable profitability.
Financial Ratios Comparison
The table below compares key financial ratios for Teradyne, Inc. (TER) and GLOBALFOUNDRIES Inc. (GFS) based on their most recent fiscal year 2024 data.
| Ratios | Teradyne, Inc. (TER) | GLOBALFOUNDRIES Inc. (GFS) |
|---|---|---|
| ROE | 19.2% | -2.5% |
| ROIC | 17.2% | -1.5% |
| P/E | 36.9 | -89.5 |
| P/B | 7.11 | 2.20 |
| Current Ratio | 2.91 | 2.11 |
| Quick Ratio | 1.84 | 1.57 |
| D/E | 0.027 | 0.215 |
| Debt-to-Assets | 2.07% | 13.8% |
| Interest Coverage | 166 | -1.48 |
| Asset Turnover | 0.76 | 0.40 |
| Fixed Asset Turnover | 4.88 | 0.82 |
| Payout Ratio | 14.1% | 0% |
| Dividend Yield | 0.38% | 0% |
Interpretation of the Ratios
Teradyne, Inc.
Teradyne’s financial ratios are predominantly strong, with favorable metrics in net margin (19.23%), ROE (19.24%), and ROIC (17.25%), supported by solid liquidity ratios and minimal debt. However, its high P/E (36.93) and P/B (7.11) ratios are less attractive, indicating a potentially expensive valuation. Teradyne pays dividends, but the dividend yield is low at 0.38%, suggesting cautious distribution relative to cash flow.
GLOBALFOUNDRIES Inc.
GLOBALFOUNDRIES shows weak profitability with negative net margin (-3.93%), ROE (-2.46%), and ROIC (-1.47%), alongside unfavorable interest coverage and asset turnover ratios. Liquidity and leverage metrics are acceptable, but the absence of dividends reflects current negative earnings and a focus on reinvestment for growth. The P/E ratio is negative, indicating losses, and the overall financial health remains challenging.
Which one has the best ratios?
Teradyne clearly outperforms GLOBALFOUNDRIES in profitability, return measures, and financial stability, despite some valuation concerns. GLOBALFOUNDRIES struggles with negative returns and coverage issues, reflecting operational and financial stress. Overall, Teradyne’s ratios present a more favorable and stable financial profile compared to GLOBALFOUNDRIES’ unfavorable metrics.
Strategic Positioning
This section compares the strategic positioning of Teradyne, Inc. and GLOBALFOUNDRIES Inc. across market position, key segments, and exposure to technological disruption:
Teradyne, Inc.
- Established semiconductor test equipment leader facing competitive pressure in testing and automation markets.
- Diverse segments: Semiconductor Test, System Test, Industrial Automation, Wireless Test driving revenues.
- Exposure through test platforms and robotics, adapting to evolving semiconductor and wireless technologies.
GLOBALFOUNDRIES Inc.
- Semiconductor foundry with strong market presence in wafer fabrication, facing foundry industry competition.
- Focused on wafer fabrication and engineering services for integrated circuits manufacturing.
- Dependent on fabrication technology advancements, vulnerable to shifts in semiconductor manufacturing processes.
Teradyne, Inc. vs GLOBALFOUNDRIES Inc. Positioning
Teradyne pursues a diversified approach with multiple test and automation segments, offering broad market exposure but complexity in management. GLOBALFOUNDRIES concentrates on foundry services, benefiting from specialized scale yet facing risks from industry shifts and less segment diversity.
Which has the best competitive advantage?
Teradyne shows a slightly favorable moat with value creation despite declining profitability, indicating efficient capital use. GLOBALFOUNDRIES has a slightly unfavorable moat, currently destroying value but improving profitability, reflecting a less stable competitive advantage.
Stock Comparison
The stock price movements of Teradyne, Inc. (TER) and GLOBALFOUNDRIES Inc. (GFS) over the past 12 months reveal contrasting trends, with TER showing significant gains amid accelerating momentum, while GFS faces ongoing declines despite recent modest recovery.

Trend Analysis
Teradyne’s stock exhibited a strong bullish trend over the past year, rising 127.38%, with accelerating momentum and high volatility (std deviation 33.24). It recorded a low of 68.72 and peaked at 227.7, confirming robust upward movement.
GLOBALFOUNDRIES showed a bearish trend over the same period, declining 21.86%. Despite acceleration in trend slope and a recent 16.66% gain, the overall movement remains negative, supported by lower volatility (std deviation 6.45).
Comparing the two, Teradyne clearly outperformed GLOBALFOUNDRIES in market performance, delivering substantial gains versus GFS’s overall losses during the analyzed 12-month span.
Target Prices
Here is the current consensus on target prices for Teradyne, Inc. and GLOBALFOUNDRIES Inc. based on verified analyst data:
| Company | Target High | Target Low | Consensus |
|---|---|---|---|
| Teradyne, Inc. | 275 | 136 | 212.7 |
| GLOBALFOUNDRIES Inc. | 40 | 37 | 38.5 |
Analysts expect Teradyne’s stock to have upside potential with a consensus target slightly below current price 227.7 USD, suggesting some caution. GLOBALFOUNDRIES’ consensus target price is below its current 41.53 USD, indicating a moderate downside risk.
Analyst Opinions Comparison
This section compares analysts’ ratings and grades for Teradyne, Inc. and GLOBALFOUNDRIES Inc.:
Rating Comparison
TER Rating
- Rating: B+, considered Very Favorable.
- Discounted Cash Flow Score: 3, indicating moderate valuation based on DCF.
- ROE Score: 4, reflecting a favorable efficiency in generating shareholder profit.
- ROA Score: 5, showing very favorable asset utilization to generate earnings.
- Debt To Equity Score: 4, representing favorable financial stability.
- Overall Score: 3, reflecting a moderate overall financial standing.
GFS Rating
- Rating: C+, considered Very Favorable.
- Discounted Cash Flow Score: 3, also moderate valuation based on DCF.
- ROE Score: 1, indicating very unfavorable return on equity performance.
- ROA Score: 1, showing very unfavorable asset utilization.
- Debt To Equity Score: 3, indicating moderate financial risk.
- Overall Score: 2, indicating a moderate but lower overall financial standing.
Which one is the best rated?
Based strictly on the provided data, Teradyne (TER) holds higher ratings and scores overall compared to GLOBALFOUNDRIES (GFS). TER shows stronger efficiency metrics and better financial stability, resulting in a superior overall score and rating.
Scores Comparison
Here is a comparison of the financial scores for Teradyne, Inc. and GLOBALFOUNDRIES Inc.:
TER Scores
- Altman Z-Score: 19.49, indicating a safe zone with very low bankruptcy risk.
- Piotroski Score: 5, reflecting average financial strength and investment quality.
GFS Scores
- Altman Z-Score: 2.61, placing the company in the grey zone with moderate bankruptcy risk.
- Piotroski Score: 6, reflecting average financial strength and investment quality.
Which company has the best scores?
Teradyne, Inc. has a significantly higher Altman Z-Score, indicating stronger financial stability than GLOBALFOUNDRIES Inc. Both companies have similar Piotroski Scores, suggesting comparable financial strength in that regard.
Grades Comparison
The following is a comparison of the latest reliable grades from recognized grading companies for Teradyne, Inc. and GLOBALFOUNDRIES Inc.:
Teradyne, Inc. Grades
This table summarizes recent grade actions from major grading companies for Teradyne, Inc.:
| Grading Company | Action | New Grade | Date |
|---|---|---|---|
| Stifel | Maintain | Buy | 2026-01-14 |
| B of A Securities | Maintain | Buy | 2026-01-13 |
| Goldman Sachs | Upgrade | Buy | 2025-12-16 |
| Stifel | Upgrade | Buy | 2025-12-02 |
| Citigroup | Maintain | Buy | 2025-11-12 |
| JP Morgan | Maintain | Neutral | 2025-10-30 |
| UBS | Maintain | Buy | 2025-10-30 |
| Goldman Sachs | Maintain | Sell | 2025-10-30 |
| Evercore ISI Group | Maintain | Outperform | 2025-10-30 |
| Stifel | Maintain | Hold | 2025-10-28 |
Teradyne’s grades generally trend positively with multiple upgrades and consistent Buy ratings from several leading firms.
GLOBALFOUNDRIES Inc. Grades
This table presents recent grading actions from established firms for GLOBALFOUNDRIES Inc.:
| Grading Company | Action | New Grade | Date |
|---|---|---|---|
| Wedbush | Downgrade | Neutral | 2025-12-31 |
| B of A Securities | Maintain | Underperform | 2025-12-04 |
| Evercore ISI Group | Maintain | Outperform | 2025-11-13 |
| JP Morgan | Maintain | Neutral | 2025-11-13 |
| Citigroup | Maintain | Neutral | 2025-11-13 |
| Wedbush | Maintain | Outperform | 2025-11-13 |
| B of A Securities | Downgrade | Underperform | 2025-10-13 |
| Deutsche Bank | Maintain | Buy | 2025-08-06 |
| Morgan Stanley | Maintain | Equal Weight | 2025-08-06 |
| Wedbush | Maintain | Outperform | 2025-08-06 |
GLOBALFOUNDRIES shows a mixed rating pattern with recent downgrades and several Neutral or Underperform ratings alongside some Outperform recommendations.
Which company has the best grades?
Teradyne, Inc. has received generally stronger and more consistent Buy and Outperform ratings compared to GLOBALFOUNDRIES Inc., which faces some downgrades and neutral to underperform grades. This difference may affect investor sentiment and perceived risk between the two companies.
Strengths and Weaknesses
Below is a comparative overview of key strengths and weaknesses for Teradyne, Inc. (TER) and GLOBALFOUNDRIES Inc. (GFS) based on the most recent financial and operational data.
| Criterion | Teradyne, Inc. (TER) | GLOBALFOUNDRIES Inc. (GFS) |
|---|---|---|
| Diversification | Balanced revenue mix: $2.29B products, $0.52B services | Concentrated revenue: $6.10B fabrication, $0.65B engineering services |
| Profitability | Strong profitability with 19.23% net margin, ROIC 17.25% | Negative profitability with -3.93% net margin, ROIC -1.47% |
| Innovation | Consistent investment in automation and testing technologies | Focus on semiconductor fabrication, improving ROIC trend |
| Global presence | Well-established global footprint in industrial automation and test equipment | Significant global manufacturing footprint in semiconductor foundry services |
| Market Share | Leading market position in semiconductor test equipment | Growing but currently less profitable foundry player |
Teradyne shows solid profitability and diversified revenue streams but faces a declining ROIC trend, which suggests caution. GLOBALFOUNDRIES has a less favorable profitability profile but is improving its operational efficiency, indicating potential for future value creation. Investors should weigh stability against growth prospects accordingly.
Risk Analysis
Below is a comparative table outlining key risks for Teradyne, Inc. (TER) and GLOBALFOUNDRIES Inc. (GFS) based on their latest available financial and operational data from 2024.
| Metric | Teradyne, Inc. (TER) | GLOBALFOUNDRIES Inc. (GFS) |
|---|---|---|
| Market Risk | High beta (1.835) indicates higher volatility in semiconductor sector. | Moderate beta (1.485) but exposed to cyclical semiconductor foundry demand. |
| Debt level | Very low debt-to-equity (0.03), minimal financial risk. | Moderate debt-to-equity (0.22), manageable but higher leverage than TER. |
| Regulatory Risk | Moderate; operates globally with some exposure to export controls and tech regulations. | Moderate; foundry industry faces evolving international trade policies. |
| Operational Risk | Diversified segments reduce risk; strong operational efficiency. | Operational challenges due to competitive foundry market and capacity expansion costs. |
| Environmental Risk | Moderate; robotics and automation may face regulatory scrutiny on sustainability. | Moderate to high; semiconductor manufacturing is resource-intensive with environmental compliance costs. |
| Geopolitical Risk | Moderate; exposure to global supply chain disruptions and US-China tensions. | High; foundry operations sensitive to geopolitical tensions affecting supply chains. |
The most likely and impactful risks lie in market volatility and geopolitical tensions, particularly for GLOBALFOUNDRIES, given its foundry focus and higher debt leverage. Teradyne’s strong balance sheet and diversified portfolio mitigate financial and operational risks, but market fluctuations remain significant. Investors should monitor ongoing trade policy developments and semiconductor cycle shifts closely.
Which Stock to Choose?
Teradyne, Inc. (TER) shows a generally favorable income evolution with a 5.36% one-year revenue growth, strong profitability evidenced by a 19.23% net margin, and robust financial ratios including a 19.24% ROE and a low 0.03 debt-to-equity. Its rating is very favorable with a B+ score, supported by a safe Altman Z-Score of 19.5 and average Piotroski score, though its ROIC trend is declining.
GLOBALFOUNDRIES Inc. (GFS) displays an unfavorable recent income statement performance with a -8.69% revenue decline and negative net margin of -3.93%, alongside mostly unfavorable financial ratios such as a negative ROE (-2.46%) and a moderate debt-to-equity ratio of 0.22. Despite a slightly unfavorable moat status, its rating remains very favorable at C+, with a grey-zone Altman Z-Score of 2.6 and an average Piotroski score.
Investors focused on value creation and stable profitability might find Teradyne’s favorable income and financial ratios more aligned with their profile, while those willing to tolerate higher risk and seek potential turnaround opportunities could see some appeal in GLOBALFOUNDRIES’ improving profitability trend despite current challenges.
Disclaimer: Investment carries a risk of loss of initial capital. The past performance is not a reliable indicator of future results. Be sure to understand risks before making an investment decision.
Go Further
I encourage you to read the complete analyses of Teradyne, Inc. and GLOBALFOUNDRIES Inc. to enhance your investment decisions: