In the rapidly evolving semiconductor industry, Taiwan Semiconductor Manufacturing Company Limited (TSMC) and GLOBALFOUNDRIES Inc. stand out as key players shaping the future of technology. Both companies specialize in advanced wafer fabrication, serving diverse markets from consumer electronics to automotive applications. This comparison explores their market positions and innovation strategies to help investors identify which company offers the most compelling investment opportunity in 2026. Let’s dive into the details to find the right choice for your portfolio.
Table of contents
Companies Overview
I will begin the comparison between TSM and GFS by providing an overview of these two companies and their main differences.
Taiwan Semiconductor Manufacturing Company Limited Overview
Taiwan Semiconductor Manufacturing Company Limited (TSM) is a global leader in semiconductor manufacturing, offering wafer fabrication processes for integrated circuits used in high performance computing, smartphones, automotive, and digital consumer electronics. Founded in 1987 and headquartered in Hsinchu City, Taiwan, TSM operates internationally and provides extensive engineering support and technology investments.
GLOBALFOUNDRIES Inc. Overview
GLOBALFOUNDRIES Inc. (GFS) is a semiconductor foundry based in Malta, New York, manufacturing integrated circuits that power a wide array of electronic devices. Established in 2009, GFS offers mainstream wafer fabrication services and produces various semiconductor devices including microprocessors and power management units, serving a global market from its U.S. headquarters.
Key similarities and differences
Both TSM and GFS operate in the semiconductor industry focusing on wafer fabrication and integrated circuit production for diverse electronics markets. TSM, with a larger workforce and longer history, has a more extensive global footprint and broader technological offerings. Conversely, GFS is a younger company with a more focused product range and smaller scale but operates primarily from the U.S. with growing market presence.
Income Statement Comparison
This table compares the most recent fiscal year income statement metrics of Taiwan Semiconductor Manufacturing Company Limited (TSM) and GLOBALFOUNDRIES Inc. (GFS) to provide a clear financial snapshot.
| Metric | Taiwan Semiconductor Manufacturing Company Limited (TSM) | GLOBALFOUNDRIES Inc. (GFS) |
|---|---|---|
| Market Cap | 1.70T TWD | 22.9B USD |
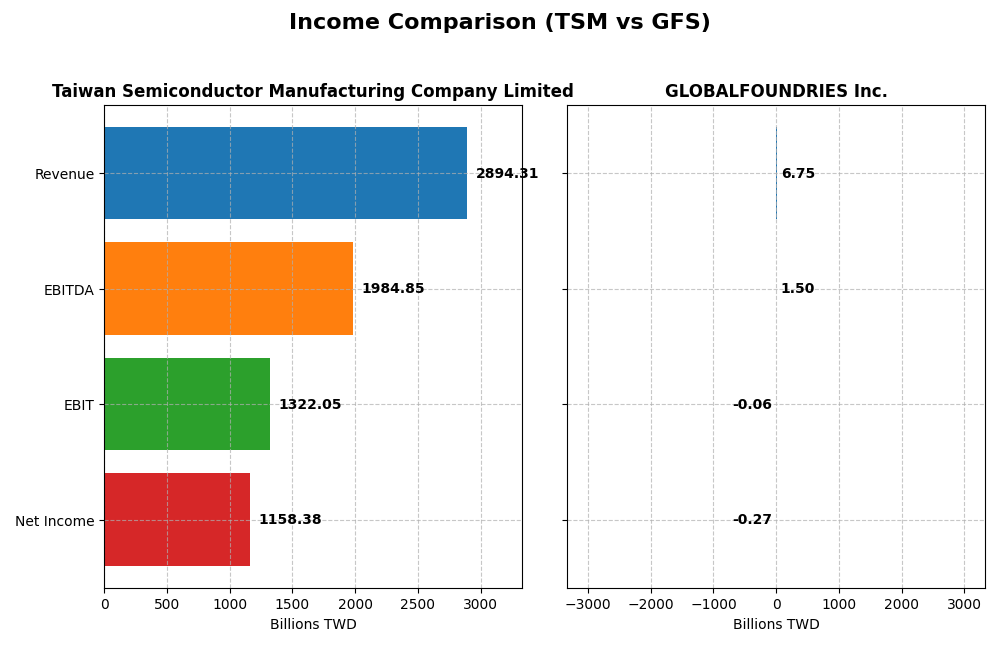
| Revenue | 2.89T TWD | 6.75B USD |
| EBITDA | 1.98T TWD | 1.50B USD |
| EBIT | 1.32T TWD | -64M USD |
| Net Income | 1.16T TWD | -265M USD |
| EPS | 223.4 TWD | -0.48 USD |
| Fiscal Year | 2024 | 2024 |
Income Statement Interpretations
Taiwan Semiconductor Manufacturing Company Limited
Taiwan Semiconductor Manufacturing Company Limited (TSM) demonstrated strong revenue growth from 2020 to 2024, with a notable 33.89% increase in the latest year, reaching TWD 2.89T. Net income expanded significantly to TWD 1.16T in 2024, while maintaining favorable gross and EBIT margins above 45%. The latest year saw stable margin improvement and a substantial EPS growth of 35.98%.
GLOBALFOUNDRIES Inc.
GLOBALFOUNDRIES Inc. (GFS) showed moderate revenue growth of 39.15% over 2020-2024 but experienced an 8.69% decline in revenue in 2024, totaling USD 6.75B. Net income fell to a loss of USD 265M in 2024, with negative EBIT and net margins. Although the overall period net income growth is positive, the latest year reflects deteriorating profitability and margin contraction.
Which one has the stronger fundamentals?
TSM exhibits stronger fundamentals with consistent revenue and net income growth, alongside favorable margin expansion and efficient cost management. In contrast, GFS faces recent operational challenges marked by negative EBIT and net income, despite some long-term growth. The contrasting income statement trends favor TSM’s financial stability and profitability over GFS.
Financial Ratios Comparison
Below is a comparison of key financial ratios for Taiwan Semiconductor Manufacturing Company Limited (TSM) and GLOBALFOUNDRIES Inc. (GFS) based on their latest reported fiscal year 2024.
| Ratios | Taiwan Semiconductor Manufacturing Company Limited (TSM) | GLOBALFOUNDRIES Inc. (GFS) |
|---|---|---|
| ROE | 27.3% | -2.46% |
| ROIC | 20.0% | -1.47% |
| P/E | 29.0 | -89.5 |
| P/B | 7.92 | 2.20 |
| Current Ratio | 2.36 | 2.11 |
| Quick Ratio | 2.14 | 1.57 |
| D/E (Debt-to-Equity) | 0.25 | 0.22 |
| Debt-to-Assets | 15.6% | 13.8% |
| Interest Coverage | 126.0 | -1.48 |
| Asset Turnover | 0.43 | 0.40 |
| Fixed Asset Turnover | 0.88 | 0.82 |
| Payout ratio | 31.3% | 0% |
| Dividend yield | 1.08% | 0% |
Interpretation of the Ratios
Taiwan Semiconductor Manufacturing Company Limited
TSM shows strong profitability with a 40.02% net margin, 27.29% ROE, and 20% ROIC, all favorable. Liquidity metrics like a 2.36 current ratio and low debt levels support financial health. However, valuation ratios PE 29.04 and PB 7.92 are unfavorable, signaling high market pricing. TSM pays dividends with a 1.08% yield, indicating a neutral stance on shareholder returns.
GLOBALFOUNDRIES Inc.
GFS displays weak profitability, with negative net margin (-3.93%), ROE (-2.46%), and ROIC (-1.47%), all unfavorable. While liquidity ratios (current ratio 2.11) and leverage remain favorable, poor interest coverage (-0.44) raises concerns. The company does not pay dividends, likely reflecting its negative earnings and reinvestment focus during a challenging financial phase.
Which one has the best ratios?
TSM holds a more favorable ratio profile with 57.14% of ratios positive versus 35.71% for GFS. Despite some valuation concerns, TSM’s profitability, liquidity, and leverage metrics are strong. GFS faces significant challenges, especially in profitability and interest coverage, resulting in an overall unfavorable evaluation.
Strategic Positioning
This section compares the strategic positioning of Taiwan Semiconductor Manufacturing Company Limited (TSM) and GLOBALFOUNDRIES Inc. (GFS) in terms of market position, key segments, and exposure to technological disruption:
TSM
- Market leader with a market cap of 1.7T USD, facing moderate competitive pressure.
- Key segment is wafer fabrication with revenues in TWD1.99T, plus other products.
- Invests in advanced wafer processes and technology startups, mitigating disruption risks.
GFS
- Smaller market cap of 23B USD, operates in a competitive foundry market with higher beta.
- Focuses on wafer fabrication (6.1B USD) and engineering services (652M USD) as main drivers.
- Provides mainstream fabrication services, less emphasis on cutting-edge technology.
TSM vs GFS Positioning
TSM has a diversified business with significant wafer and other product revenues and invests in technology startups. GFS shows a more concentrated focus on wafer fabrication and engineering services. TSM’s scale and diversification may support resilience, while GFS’s narrower scope could limit flexibility.
Which has the best competitive advantage?
TSM shows a slightly favorable moat with value creation despite declining ROIC, indicating efficient capital use and profitability. GFS has a slightly unfavorable moat, shedding value but with improving ROIC, suggesting less consistent competitive advantage currently.
Stock Comparison
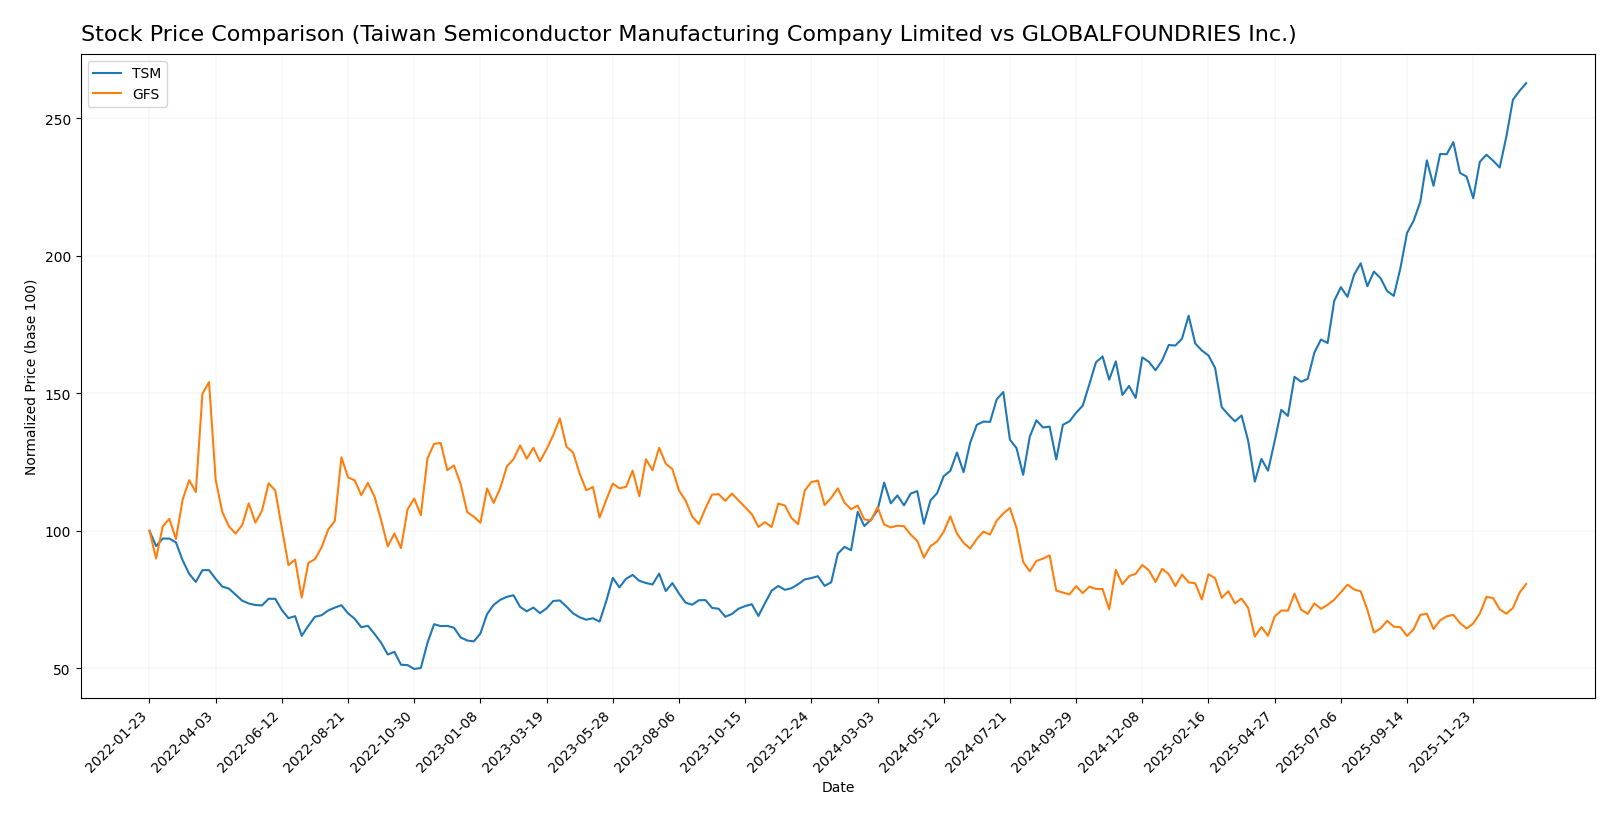
The past year has seen Taiwan Semiconductor Manufacturing Company Limited (TSM) exhibit a strong bullish trend with significant price appreciation and accelerating momentum, while GLOBALFOUNDRIES Inc. (GFS) experienced a bearish trend marked by price decline despite recent modest gains.
Trend Analysis
TSM’s stock price increased by 152.54% over the past 12 months, indicating a clear bullish trend with accelerating growth, a high volatility level (std deviation 51.25), and a price range between 127.7 and 327.11.
GFS recorded a -22.2% price change over the same period, reflecting a bearish trend with accelerating decline, lower volatility (std deviation 6.45), and a price range from 31.54 to 55.66.
Comparing both stocks, TSM delivered the highest market performance with sustained bullish momentum, whereas GFS showed overall weakness despite recent positive price moves.
Target Prices
Analysts present a positive consensus for Taiwan Semiconductor Manufacturing Company Limited and GLOBALFOUNDRIES Inc., indicating potential upside from current prices.
| Company | Target High | Target Low | Consensus |
|---|---|---|---|
| Taiwan Semiconductor Manufacturing Company Limited | 400 | 330 | 361.25 |
| GLOBALFOUNDRIES Inc. | 40 | 37 | 38.5 |
The consensus target prices for both companies exceed their current stock prices, suggesting analyst expectations of moderate to strong price appreciation. This reflects optimism in the semiconductor sector despite recent market fluctuations.
Analyst Opinions Comparison
This section compares analysts’ ratings and grades for Taiwan Semiconductor Manufacturing Company Limited (TSM) and GLOBALFOUNDRIES Inc. (GFS):
Rating Comparison
TSM Rating
- Rating: A-, considered very favorable by analysts.
- Discounted Cash Flow Score: 5, indicating very favorable valuation based on future cash flows.
- ROE Score: 5, showing very efficient profit generation from shareholders’ equity.
- ROA Score: 5, demonstrating very effective asset utilization for earnings.
- Debt To Equity Score: 3, a moderate score indicating average financial risk.
- Overall Score: 4, favorable overall financial standing.
GFS Rating
- Rating: C+, also marked as very favorable despite lower scores.
- Discounted Cash Flow Score: 3, a moderate score reflecting average valuation based on cash flows.
- ROE Score: 1, suggesting very unfavorable efficiency in generating profit from equity.
- ROA Score: 1, indicating very unfavorable use of assets to generate earnings.
- Debt To Equity Score: 3, also moderate, showing similar financial risk level as TSM.
- Overall Score: 2, moderate overall financial standing.
Which one is the best rated?
Based strictly on the provided data, TSM is better rated with higher overall, DCF, ROE, and ROA scores. GFS shows moderate to very unfavorable scores except for debt-to-equity and price-to-book metrics.
Scores Comparison
Here is a comparison of the Altman Z-Score and Piotroski Score for both companies:
TSM Scores
- Altman Z-Score: 2.94, indicating a grey zone risk level.
- Piotroski Score: 8, classified as very strong financial health.
GFS Scores
- Altman Z-Score: 2.61, also in the grey zone risk level.
- Piotroski Score: 6, indicating average financial health.
Which company has the best scores?
TSM has a higher Altman Z-Score and a notably stronger Piotroski Score compared to GFS. Based strictly on these scores, TSM demonstrates stronger financial health and lower bankruptcy risk.
Grades Comparison
Here is a detailed comparison of the grading trends and ratings for the two semiconductor companies:
Taiwan Semiconductor Manufacturing Company Limited Grades
The following table shows recent grades assigned by reputable grading companies to Taiwan Semiconductor Manufacturing Company Limited (TSM):
| Grading Company | Action | New Grade | Date |
|---|---|---|---|
| Bernstein | Maintain | Outperform | 2025-12-08 |
| Needham | Maintain | Buy | 2025-10-27 |
| Barclays | Maintain | Overweight | 2025-10-17 |
| Needham | Maintain | Buy | 2025-10-16 |
| Susquehanna | Maintain | Positive | 2025-10-10 |
| Barclays | Maintain | Overweight | 2025-10-09 |
| Barclays | Maintain | Overweight | 2025-09-16 |
| Needham | Maintain | Buy | 2025-07-17 |
| Susquehanna | Maintain | Positive | 2025-07-14 |
| Needham | Maintain | Buy | 2025-07-01 |
The grades for TSM consistently indicate strong positive sentiment, predominantly Buy and Outperform ratings, with no downgrades reported.
GLOBALFOUNDRIES Inc. Grades
Below is the table summarizing recent grades for GLOBALFOUNDRIES Inc. (GFS) from recognized grading firms:
| Grading Company | Action | New Grade | Date |
|---|---|---|---|
| Wedbush | Downgrade | Neutral | 2025-12-31 |
| B of A Securities | Maintain | Underperform | 2025-12-04 |
| Evercore ISI Group | Maintain | Outperform | 2025-11-13 |
| JP Morgan | Maintain | Neutral | 2025-11-13 |
| Citigroup | Maintain | Neutral | 2025-11-13 |
| Wedbush | Maintain | Outperform | 2025-11-13 |
| B of A Securities | Downgrade | Underperform | 2025-10-13 |
| Deutsche Bank | Maintain | Buy | 2025-08-06 |
| Morgan Stanley | Maintain | Equal Weight | 2025-08-06 |
| Wedbush | Maintain | Outperform | 2025-08-06 |
GLOBALFOUNDRIES displays a mixed pattern, with downgrades to Neutral and Underperform alongside some Outperform and Buy ratings, indicating divergent analyst views.
Which company has the best grades?
Taiwan Semiconductor Manufacturing Company Limited has received consistently strong Buy and Outperform grades, whereas GLOBALFOUNDRIES has a more varied and less favorable rating profile including multiple downgrades. This divergence may influence investor perceptions of relative stability and growth prospects.
Strengths and Weaknesses
Below is a comparative overview of Taiwan Semiconductor Manufacturing Company Limited (TSM) and GLOBALFOUNDRIES Inc. (GFS) based on key operational and financial criteria.
| Criterion | Taiwan Semiconductor Manufacturing Company Limited (TSM) | GLOBALFOUNDRIES Inc. (GFS) |
|---|---|---|
| Diversification | Strong focus on wafer fabrication with significant revenue from wafers (~1.99T TWD in 2022) and other products | Primarily focused on wafer fabrication and engineering services, smaller revenue base (~6.1B USD wafer fabrication in 2024) |
| Profitability | High profitability with 40.02% net margin and 27.29% ROE; ROIC 20% above WACC indicating value creation | Negative net margin (-3.93%) and ROE (-2.46%), ROIC below WACC, indicating value destruction but improving profitability trend |
| Innovation | Leading-edge semiconductor manufacturing technology with consistent investment in R&D | Growing ROIC trend suggests improving innovation or operational efficiency but still below profitability threshold |
| Global presence | Extensive global footprint and market leadership in semiconductor foundry | Global but smaller scale presence, focused on specific markets and segments |
| Market Share | Market leader in semiconductor foundry with dominant share in wafer production | Smaller market share, niche player in specific fabs and engineering services |
Key takeaways: TSM demonstrates strong profitability, diversification, and global leadership, though its profitability is slightly declining. GFS is improving operationally but still faces profitability challenges and has a smaller market footprint. Investors should weigh TSM’s stability against GFS’s growth potential and risk.
Risk Analysis
Below is a comparative table highlighting key risks for Taiwan Semiconductor Manufacturing Company Limited (TSM) and GLOBALFOUNDRIES Inc. (GFS) as of 2024:
| Metric | Taiwan Semiconductor Manufacturing Company Limited (TSM) | GLOBALFOUNDRIES Inc. (GFS) |
|---|---|---|
| Market Risk | Beta 1.274; exposed to global semiconductor demand cycles and tech market volatility | Beta 1.485; higher volatility due to smaller market cap and competitive pressures |
| Debt level | Low leverage (Debt-to-Equity 0.25), strong interest coverage (126x) | Low leverage (Debt-to-Equity 0.22), but negative interest coverage due to losses |
| Regulatory Risk | Moderate; subject to cross-border trade regulations and Taiwan-China geopolitical tensions | Moderate; US-based with exposure to export controls and semiconductor industry regulations |
| Operational Risk | High; complex manufacturing and supply chain with advanced technology demands | High; operational scale smaller, with risks in scaling production and technology upgrades |
| Environmental Risk | Increasing pressure to reduce carbon footprint; investments in green tech ongoing | Moderate; growing focus on sustainability but less advanced initiatives compared to TSM |
| Geopolitical Risk | High; Taiwan’s geopolitical position creates significant risk of disruptions | Moderate; US operations less exposed but impacted by global trade tensions |
Synthesis: The most impactful risks for TSM stem from geopolitical tensions around Taiwan, which could disrupt supply chains and production despite strong financial health. GFS faces higher market volatility and operational risks coupled with financial challenges, including negative profitability and interest coverage. Investors should weigh TSM’s geopolitical exposure against its robust financial stability, while GFS presents higher financial and operational risk with potential for recovery.
Which Stock to Choose?
Taiwan Semiconductor Manufacturing Company Limited (TSM) shows strong income growth with a 33.9% revenue increase in 2024 and a favorable global income statement opinion. Its financial ratios are mostly positive, featuring a 27.3% ROE and low debt, supported by a very favorable A- rating and a slightly favorable economic moat despite a declining ROIC trend.
GLOBALFOUNDRIES Inc. (GFS) presents a mixed picture with a 2024 revenue decline of 8.7% and an unfavorable global income statement evaluation. Financial ratios reveal negative profitability, including a -2.5% ROE, though leverage is moderate. The company holds a C+ rating with a slightly unfavorable economic moat but shows improving ROIC.
The choice between TSM and GFS could depend on investor preferences: those favoring established profitability and a strong rating might find TSM more attractive, while investors who could tolerate higher risk for potential recovery may view GFS’s improving profitability and moderate valuation metrics as noteworthy.
Disclaimer: Investment carries a risk of loss of initial capital. The past performance is not a reliable indicator of future results. Be sure to understand risks before making an investment decision.
Go Further
I encourage you to read the complete analyses of Taiwan Semiconductor Manufacturing Company Limited and GLOBALFOUNDRIES Inc. to enhance your investment decisions: