Home > Comparison > Technology > STM vs GFS
The strategic rivalry between STMicroelectronics N.V. and GLOBALFOUNDRIES Inc. defines the current trajectory of the semiconductor sector. STMicroelectronics operates as a diversified semiconductor designer and manufacturer with broad end-market exposure, while GLOBALFOUNDRIES focuses on capital-intensive wafer fabrication services. This head-to-head pits integrated product innovation against pure-play manufacturing scale. This analysis will assess which corporate strategy delivers a superior risk-adjusted return for a diversified portfolio in 2026.
Table of contents
Companies Overview
STMicroelectronics N.V. and GLOBALFOUNDRIES Inc. stand as pivotal players shaping the semiconductor landscape globally.
STMicroelectronics N.V.: Diverse Semiconductor Innovator
STMicroelectronics N.V. anchors itself as a multifaceted semiconductor designer and manufacturer with a broad global footprint. Its revenue stems from diversified segments including automotive ICs, analog and MEMS sensors, and microcontrollers. In 2026, it sharpens its strategic focus on integrated solutions across automotive, industrial, and communications markets, leveraging innovation in power transistors and wireless connectivity.
GLOBALFOUNDRIES Inc.: Leading Semiconductor Foundry
GLOBALFOUNDRIES Inc. commands attention as a semiconductor foundry specializing in wafer fabrication for a wide spectrum of integrated circuits. Its core revenue engine revolves around manufacturing microprocessors, RF modems, and power units for electronics worldwide. The company’s 2026 strategy prioritizes scaling mainstream wafer technologies and expanding capacity to meet rising demand in mobile and network processors.
Strategic Collision: Similarities & Divergences
Both firms operate within semiconductors but diverge sharply in business models—STMicroelectronics integrates design and manufacturing, while GLOBALFOUNDRIES focuses purely on foundry services. Their primary battleground lies in advanced semiconductor technology catering to automotive and communications sectors. Investors face distinct profiles: STMicroelectronics offers breadth and vertical integration; GLOBALFOUNDRIES emphasizes specialization and scale in contract manufacturing.
Income Statement Comparison
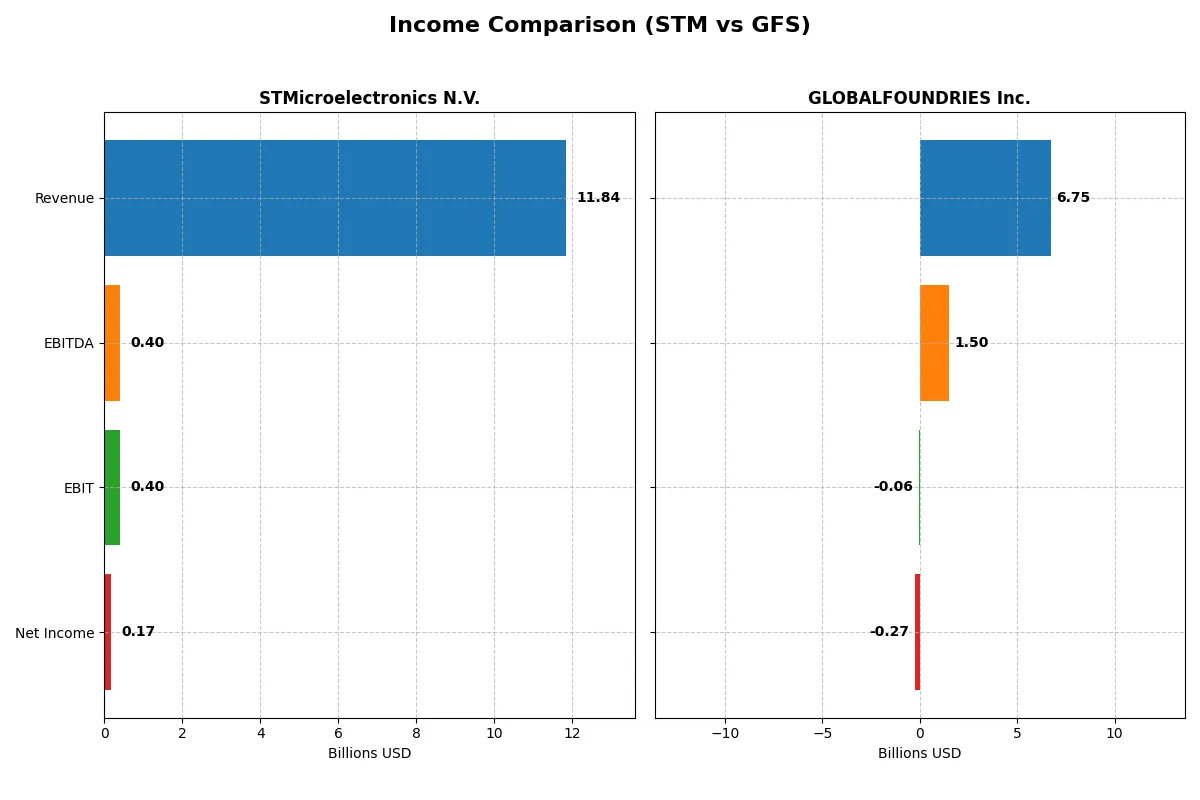
This data dissects the core profitability and scalability of both corporate engines to reveal who dominates the bottom line:
| Metric | STMicroelectronics N.V. (STM) | GLOBALFOUNDRIES Inc. (GFS) |
|---|---|---|
| Revenue | 11.8B | 6.75B |
| Cost of Revenue | 7.83B | 5.10B |
| Operating Expenses | 3.69B | 1.87B |
| Gross Profit | 4.01B | 1.65B |
| EBITDA | 401M | 1.50B |
| EBIT | 401M | -64M |
| Interest Expense | 0 | 145M |
| Net Income | 167M | -265M |
| EPS | 0.19 | -0.48 |
| Fiscal Year | 2025 | 2024 |
Income Statement Analysis: The Bottom-Line Duel
This income statement comparison reveals which company operates with greater efficiency and sustainable profitability in a challenging market environment.
STMicroelectronics N.V. Analysis
STMicroelectronics’ revenue declined from 17.3B in 2023 to 11.8B in 2025, with net income plummeting from 4.2B to 167M. Gross margin remains favorable at 33.9%, but net margin contracted sharply to 1.4%. The 2025 results highlight steep margin erosion and weakening profitability momentum, signaling operational stress.
GLOBALFOUNDRIES Inc. Analysis
GLOBALFOUNDRIES grew revenue overall by 39% from 2020 to 2024 but faced an 8.7% dip in 2024 to 6.75B. The company posted a net loss of 265M in 2024, reversing prior profits. Its gross margin stayed decent at 24.5%, but negative EBIT and net margins reflect ongoing profitability challenges and volatile earnings.
Margin Resilience vs. Growth Struggles
STMicroelectronics delivers stronger margins but suffers from a severe earnings collapse, while GLOBALFOUNDRIES shows revenue growth overshadowed by persistent losses. ST’s scale and margin control dominate, yet momentum falters. Investors seeking margin stability may prefer ST, whereas those betting on a turnaround might watch GLOBALFOUNDRIES cautiously.
Financial Ratios Comparison
These vital ratios act as a diagnostic tool to expose the underlying fiscal health, valuation premiums, and capital efficiency of the companies compared below:
| Ratios | STMicroelectronics N.V. (STM) | GLOBALFOUNDRIES Inc. (GFS) |
|---|---|---|
| ROE | 8.9% (2024) | -2.5% (2024) |
| ROIC | 6.3% (2024) | -1.5% (2024) |
| P/E | 14.4 (2024) | -89.5 (2024) |
| P/B | 1.29 (2024) | 2.20 (2024) |
| Current Ratio | 3.11 (2024) | 2.11 (2024) |
| Quick Ratio | 2.37 (2024) | 1.57 (2024) |
| D/E | 0.18 (2024) | 0.22 (2024) |
| Debt-to-Assets | 13.0% (2024) | 13.8% (2024) |
| Interest Coverage | 19.7 (2024) | -1.48 (2024) |
| Asset Turnover | 0.54 (2024) | 0.40 (2024) |
| Fixed Asset Turnover | 1.22 (2024) | 0.82 (2024) |
| Payout ratio | 18.5% (2024) | 0% (2024) |
| Dividend yield | 1.28% (2024) | 0% (2024) |
| Fiscal Year | 2024 | 2024 |
Efficiency & Valuation Duel: The Vital Signs
Ratios serve as a company’s DNA, unveiling hidden risks and operational excellence beyond surface-level financials.
STMicroelectronics N.V.
STMicroelectronics shows weak profitability with a 0.93% ROE and 1.41% net margin, signaling operational challenges. Its valuation metrics appear favorable, but the stock lacks dividend yield, relying instead on heavy R&D investment at 15.65% of revenue to fuel growth. The company maintains a strong current ratio of 3.36, though asset turnover is low.
GLOBALFOUNDRIES Inc.
GLOBALFOUNDRIES suffers negative returns with a -2.46% ROE and -3.93% net margin, reflecting ongoing profitability struggles. Despite a favorable P/E due to negative earnings, its valuation is stretched with a 2.2 price-to-book ratio. The company pays no dividends, focusing on modest R&D spending (7.35% of revenue). Liquidity ratios are sound, but interest coverage is poor.
Valuation Strength vs. Profitability Weakness
STMicroelectronics balances a favorable valuation with weak profitability and high R&D investment, while GLOBALFOUNDRIES faces deeper losses and stretched valuation. STMicroelectronics offers a more stable operational profile, fitting investors prioritizing growth and resilience over speculative turnaround potential.
Which one offers the Superior Shareholder Reward?
I see STMicroelectronics (STM) pays a modest 1.28% dividend yield with a sustainable 18% payout ratio, supported by positive free cash flow trends until 2025. STM also executes moderate buybacks, enhancing total returns. GLOBALFOUNDRIES (GFS) pays no dividends but shows consistent free cash flow generation and aggressive buybacks. However, GFS’s negative net margins and volatile profits raise sustainability concerns. I conclude STM offers a more balanced, sustainable shareholder reward in 2026, blending dividends with buybacks, while GFS relies heavily on buybacks amid profitability challenges.
Comparative Score Analysis: The Strategic Profile
The radar chart reveals the fundamental DNA and trade-offs of STMicroelectronics N.V. and GLOBALFOUNDRIES Inc., highlighting their financial strengths and vulnerabilities:
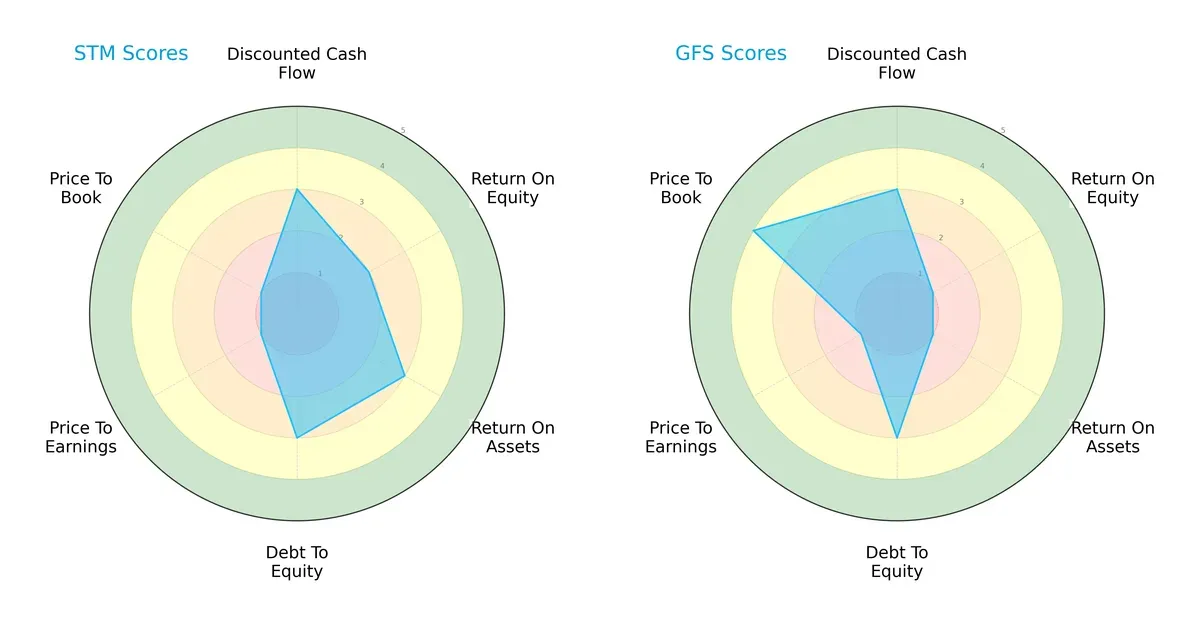
STMicroelectronics demonstrates a balanced profile with moderate scores in DCF (3), ROE (2), ROA (3), and Debt/Equity (3), but suffers from very unfavorable valuation metrics (PE and PB at 1). GLOBALFOUNDRIES shows a clear reliance on a favorable Price-to-Book score (4) but underperforms in ROE (1) and ROA (1). STM’s strength lies in operational efficiency, while GFS leans on valuation appeal, making STM the more balanced choice.
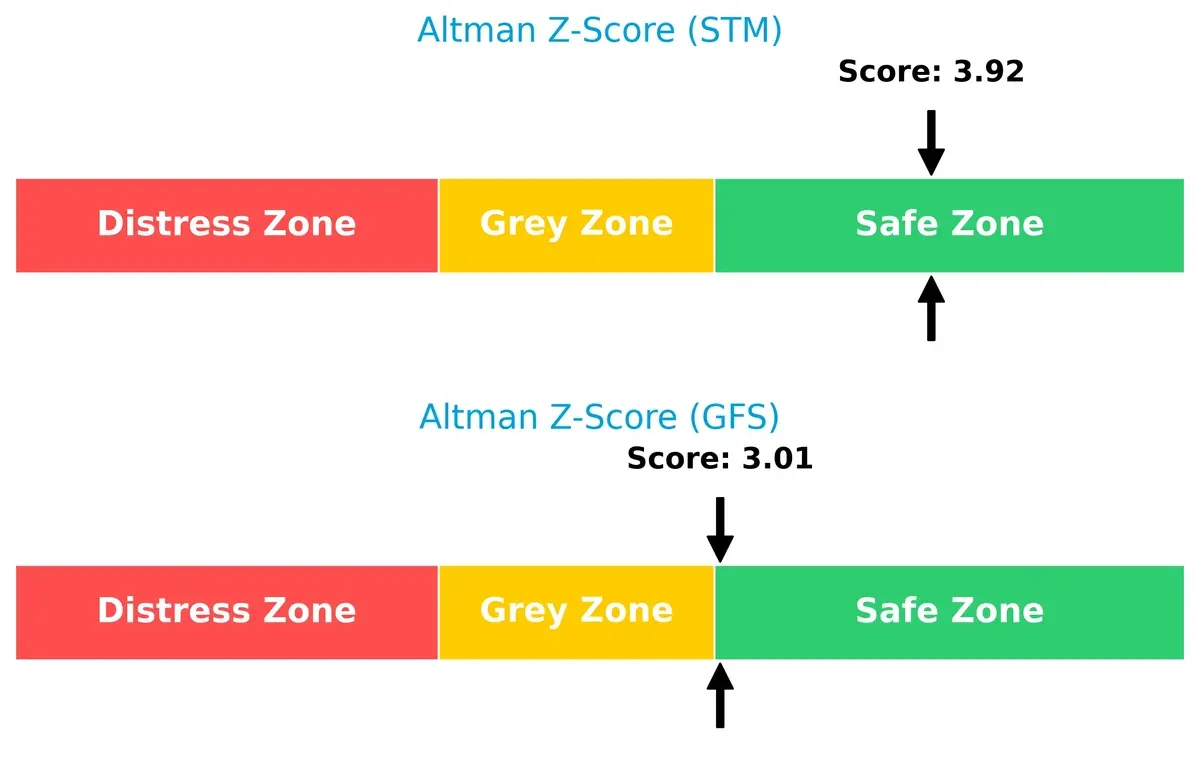
Bankruptcy Risk: Solvency Showdown
The Altman Z-Score difference positions both firms in the safe zone, but STMicroelectronics’ higher score (3.92) suggests stronger long-term survival resilience compared to GLOBALFOUNDRIES (3.01):
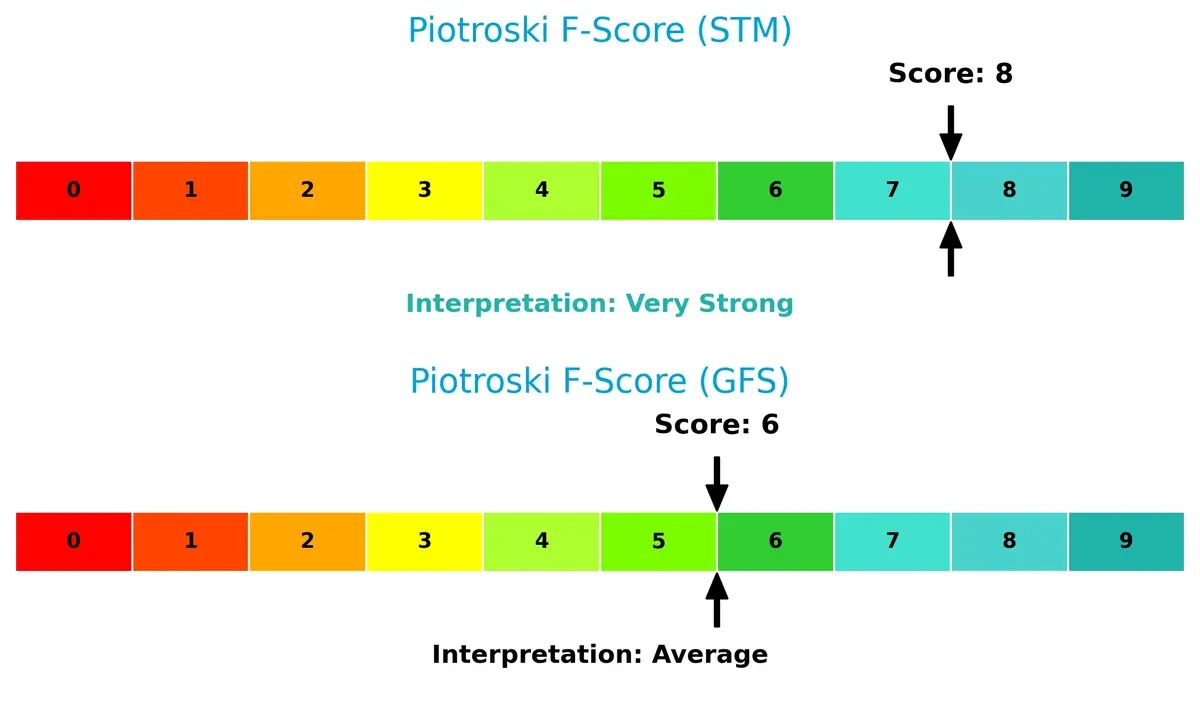
Financial Health: Quality of Operations
STMicroelectronics scores an 8 on the Piotroski scale, indicating very strong financial health, whereas GLOBALFOUNDRIES’ 6 suggests average health with potential red flags in internal metrics:
How are the two companies positioned?
This section dissects STM and GFS’s operational DNA by comparing their revenue distribution and internal dynamics. The goal is to confront their economic moats and reveal which model offers the most resilient competitive advantage today.
Revenue Segmentation: The Strategic Mix
The following comparison dissects how STMicroelectronics and GLOBALFOUNDRIES diversify their income streams and where their primary sector bets lie:
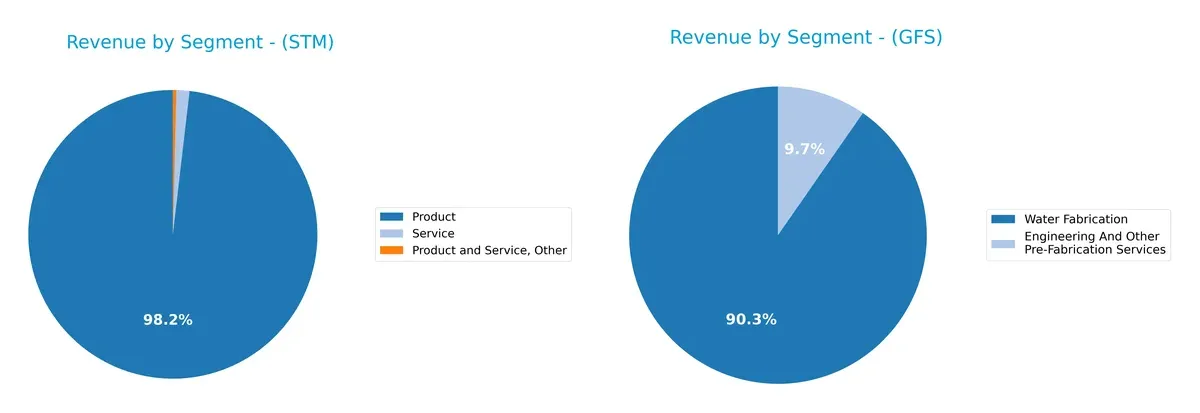
STMicroelectronics shows a more diversified revenue base with $13.2B from Product and $196M from Service in 2024, while GLOBALFOUNDRIES heavily anchors on Water Fabrication at $6.1B, with $652M in Engineering Services. STM’s mix reduces concentration risk, leveraging product variety. GFS’s reliance on fabrication signals strong infrastructure dominance but exposes it to sector-specific cyclicality. This contrast highlights STM’s broader ecosystem vs. GFS’s focused operational moat.
Strengths and Weaknesses Comparison
This table compares the strengths and weaknesses of STMicroelectronics N.V. and GLOBALFOUNDRIES Inc.:
STM Strengths
- Diverse product and service revenue streams totaling over 13B USD
- Strong quick ratio of 2.43 indicates liquidity
- Low debt-to-equity ratio of 0.12 reduces financial risk
- Global presence with significant Asia Pacific and US sales
GFS Strengths
- Solid current and quick ratios (2.11 and 1.57) show good liquidity
- Debt-to-assets at 13.81% manageable
- Significant US market exposure with 3.7B+ revenue
- Engineering services and wafer fabrication segments provide some diversification
STM Weaknesses
- Low profitability with net margin 1.41% and ROE 0.93%
- Asset turnover low at 0.48 signals inefficiency
- Current ratio of 3.36 flagged as unfavorable, possible working capital issues
- No dividend yield limits income return
GFS Weaknesses
- Negative profitability metrics with net margin -3.93% and ROE -2.46%
- WACC at 10.37% higher than STM’s 9.36%, increasing capital costs
- Interest coverage negative, indicating difficulty covering interest expenses
- Lower asset turnover ratios and no dividend yield
STM benefits from a more diversified revenue base and stronger liquidity ratios, yet struggles with profitability and operational efficiency. GFS faces deeper profitability challenges and higher capital costs but maintains reasonable liquidity and a focused market presence. Both companies show risks that influence their strategic priorities around improving margins and operational metrics.
The Moat Duel: Analyzing Competitive Defensibility
A structural moat is the sole barrier protecting long-term profits from relentless competitive erosion. Here’s how STM and GFS stack up:
STMicroelectronics N.V.: Intangible Assets and Diversified Analog Strength
STM’s moat lies in its broad portfolio of analog and sensor technologies. This manifests in stable gross margins near 34%, despite recent profit declines. New automotive and IoT products could bolster its moat if innovation accelerates.
GLOBALFOUNDRIES Inc.: Cost Advantage and Manufacturing Scale
GFS competes primarily on cost and scale as a pure-play foundry. Though it lags STM in margin, its improving ROIC trend signals growing operational efficiency. Expansion into advanced nodes may deepen its moat in 2026.
Verdict: Intangible Assets vs. Cost Leadership
STM’s moat is rooted in proprietary analog tech, offering deeper product differentiation. GFS’s cost moat is narrower but gaining traction. I judge STM better positioned to defend market share long-term.
Which stock offers better returns?
Over the past year, STMicroelectronics N.V. and GLOBALFOUNDRIES Inc. showed significant price declines with accelerating bearish trends, followed by recent rebounds in late 2025 and early 2026.
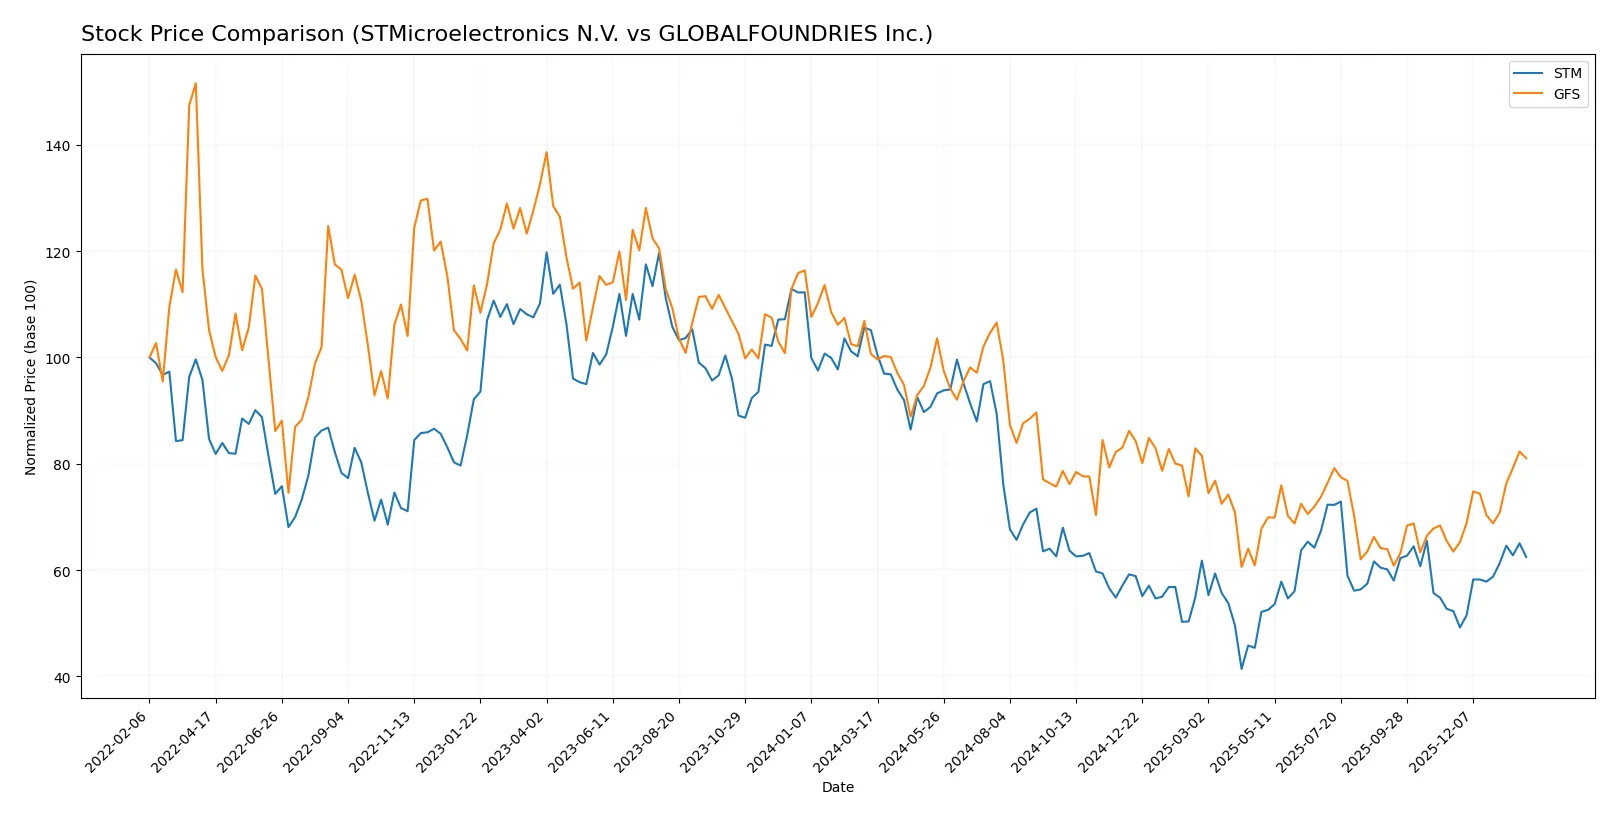
Trend Comparison
STMicroelectronics N.V. experienced a 40.6% price decline over the past 12 months, marking a bearish trend with acceleration. The stock hit a low of 18.49 and recently gained 19.49% from November 2025 to February 2026.
GLOBALFOUNDRIES Inc. recorded a 19.48% price drop in the same period, also bearish with acceleration. It ranged between 31.54 and 55.5, then rebounded 27.69% recently, showing a stronger recovery slope.
GLOBALFOUNDRIES Inc. outperformed STMicroelectronics N.V. over the past year, delivering a smaller overall loss and a higher recent price rebound.
Target Prices
Analysts set a clear target price consensus for both STMicroelectronics N.V. and GLOBALFOUNDRIES Inc.
| Company | Target Low | Target High | Consensus |
|---|---|---|---|
| STMicroelectronics N.V. | 28 | 45 | 37.67 |
| GLOBALFOUNDRIES Inc. | 37 | 40 | 38.5 |
The target consensus for STMicroelectronics at $37.67 suggests upside from the current $27.89 stock price. GLOBALFOUNDRIES’ $38.5 consensus also implies a moderate pullback from the current $42.20 level.

Don’t Let Luck Decide Your Entry Point
Optimize your entry points with our advanced ProRealTime indicators. You’ll get efficient buy signals with precise price targets for maximum performance. Start outperforming now!
How do institutions grade them?
The institutional grades from reputable firms for STMicroelectronics N.V. and GLOBALFOUNDRIES Inc. are as follows:
STMicroelectronics N.V. Grades
Here are recent grades and recommendations from leading financial institutions for STMicroelectronics N.V.:
| Grading Company | Action | New Grade | Date |
|---|---|---|---|
| TD Cowen | Maintain | Buy | 2025-10-24 |
| Susquehanna | Maintain | Positive | 2025-10-22 |
| Susquehanna | Maintain | Positive | 2025-07-25 |
| Baird | Upgrade | Outperform | 2025-07-22 |
| Susquehanna | Maintain | Positive | 2025-07-22 |
| Jefferies | Upgrade | Buy | 2025-02-19 |
| Bernstein | Downgrade | Market Perform | 2025-02-05 |
| Susquehanna | Maintain | Positive | 2025-01-31 |
| Barclays | Downgrade | Underweight | 2025-01-22 |
| JP Morgan | Downgrade | Neutral | 2024-12-09 |
GLOBALFOUNDRIES Inc. Grades
Recent institutional grades and recommendations for GLOBALFOUNDRIES Inc. are detailed below:
| Grading Company | Action | New Grade | Date |
|---|---|---|---|
| Citigroup | Maintain | Neutral | 2026-01-15 |
| Wedbush | Downgrade | Neutral | 2025-12-31 |
| B of A Securities | Maintain | Underperform | 2025-12-04 |
| Citigroup | Maintain | Neutral | 2025-11-13 |
| Evercore ISI Group | Maintain | Outperform | 2025-11-13 |
| JP Morgan | Maintain | Neutral | 2025-11-13 |
| Wedbush | Maintain | Outperform | 2025-11-13 |
| Wedbush | Maintain | Outperform | 2025-08-06 |
| Morgan Stanley | Maintain | Equal Weight | 2025-08-06 |
| B of A Securities | Downgrade | Underperform | 2025-10-13 |
Which company has the best grades?
STMicroelectronics N.V. generally holds stronger and more positive grades, including Buy and Outperform ratings from multiple firms. GLOBALFOUNDRIES Inc. shows mixed grades with several Neutral and Underperform ratings. Investors may interpret STMicroelectronics’ higher grades as greater institutional confidence, potentially reflecting stronger fundamentals or growth prospects.
Risks specific to each company
The following categories identify critical pressure points and systemic threats facing STMicroelectronics N.V. and GLOBALFOUNDRIES Inc. in the 2026 market environment:
1. Market & Competition
STMicroelectronics N.V.
- Faces stiff competition in automotive and industrial semiconductor segments; diversified product groups help mitigate risk.
GLOBALFOUNDRIES Inc.
- Operates in a competitive foundry market with pressure from larger rivals; limited product diversification increases vulnerability.
2. Capital Structure & Debt
STMicroelectronics N.V.
- Low debt-to-equity ratio (0.12) with strong interest coverage signals conservative leverage and financial stability.
GLOBALFOUNDRIES Inc.
- Higher debt-to-equity (0.22) and negative interest coverage (-0.44) raise red flags on financial risk and solvency.
3. Stock Volatility
STMicroelectronics N.V.
- Beta of 1.29 indicates moderate volatility, in line with semiconductor sector averages.
GLOBALFOUNDRIES Inc.
- Higher beta of 1.49 signals greater stock price swings and elevated market risk.
4. Regulatory & Legal
STMicroelectronics N.V.
- Exposure to diverse regulatory environments across multiple continents increases compliance complexity.
GLOBALFOUNDRIES Inc.
- US-centric operations face stricter domestic regulations and potential trade policy impacts.
5. Supply Chain & Operations
STMicroelectronics N.V.
- Complex global supply chains risk disruptions but diversified manufacturing helps resilience.
GLOBALFOUNDRIES Inc.
- Concentrated manufacturing footprint creates higher vulnerability to supply chain shocks.
6. ESG & Climate Transition
STMicroelectronics N.V.
- Progressive on sustainability initiatives, aligning with increasing investor ESG demands.
GLOBALFOUNDRIES Inc.
- ESG efforts less mature, posing reputational and compliance risks amid rising regulatory pressure.
7. Geopolitical Exposure
STMicroelectronics N.V.
- Broad geographic footprint exposes it to geopolitical tensions but also spreads risk.
GLOBALFOUNDRIES Inc.
- US base shields somewhat from international conflicts but limits global market flexibility.
Which company shows a better risk-adjusted profile?
STMicroelectronics faces its largest risk in competitive pressures within fragmented product segments but benefits from a strong balance sheet and diversified operations. GLOBALFOUNDRIES’ primary risk lies in its financial leverage and negative profitability metrics, compounded by higher stock volatility. Given these factors, STMicroelectronics exhibits a superior risk-adjusted profile. Notably, STM’s safe-zone Altman Z-score (3.92) versus GFS’s borderline safe zone (3.01) underscores STM’s stronger financial resilience in 2026.
Final Verdict: Which stock to choose?
STMicroelectronics (STM) impresses with robust liquidity and a strong cash position, making it a reliable cash machine in volatile markets. Its main point of vigilance lies in declining profitability and a shrinking moat, signaling caution for long-term value creation. STM suits investors aiming for aggressive growth tempered by careful risk monitoring.
GLOBALFOUNDRIES (GFS) leverages a strategic moat rooted in its growing return on invested capital despite current losses. Its lower leverage and improving free cash flow yield offer relative safety compared to STM’s volatility. GFS fits a GARP profile, appealing to investors who value growth potential at a reasonable risk-adjusted price.
If you prioritize liquidity and operational cash strength, STM is the compelling choice due to its solid balance sheet and cash conversion capabilities. However, if you seek improving profitability trends and a moat in development, GFS offers better stability and growth prospects despite near-term challenges. Both stocks carry risks, but their distinct profiles cater to different investor appetites.
Disclaimer: Investment carries a risk of loss of initial capital. The past performance is not a reliable indicator of future results. Be sure to understand risks before making an investment decision.
Go Further
I encourage you to read the complete analyses of STMicroelectronics N.V. and GLOBALFOUNDRIES Inc. to enhance your investment decisions: