In the fast-evolving semiconductor industry, GLOBALFOUNDRIES Inc. (GFS) and Silicon Laboratories Inc. (SLAB) stand out for their distinct approaches and market focus. While GFS specializes in manufacturing integrated circuits and wafer fabrication, SLAB leads in analog-intensive mixed-signal solutions for IoT applications. This comparison highlights their innovation strategies and market positions to help you decide which company presents the most compelling investment opportunity in 2026.
Table of contents
Companies Overview
I will begin the comparison between GLOBALFOUNDRIES Inc. and Silicon Laboratories Inc. by providing an overview of these two companies and their main differences.
GLOBALFOUNDRIES Overview
GLOBALFOUNDRIES Inc. operates as a semiconductor foundry worldwide, manufacturing integrated circuits essential for various electronic devices. The company produces a diverse range of semiconductor products, including microprocessors, mobile application processors, and power management units, alongside wafer fabrication services. Founded in 2009 and based in Malta, New York, it employs around 13,000 people and has a market capitalization of approximately 23B USD.
Silicon Laboratories Overview
Silicon Laboratories Inc. is a fabless semiconductor company specializing in analog-intensive mixed-signal solutions for IoT applications. Its product portfolio includes wireless microcontrollers and sensors used in connected homes, industrial automation, and medical instrumentation. Founded in 1996 and headquartered in Austin, Texas, the company has roughly 1,900 employees and a market cap near 5B USD.
Key similarities and differences
Both companies operate in the semiconductor industry within the technology sector and trade on NASDAQ Global Select. GLOBALFOUNDRIES focuses on semiconductor manufacturing and foundry services, employing a large workforce, while Silicon Labs is fabless, emphasizing mixed-signal and analog solutions for IoT with a smaller team. Their business models differ in production capabilities and market focus, with GLOBALFOUNDRIES targeting integrated circuit fabrication and Silicon Labs concentrating on product design and sales.
Income Statement Comparison
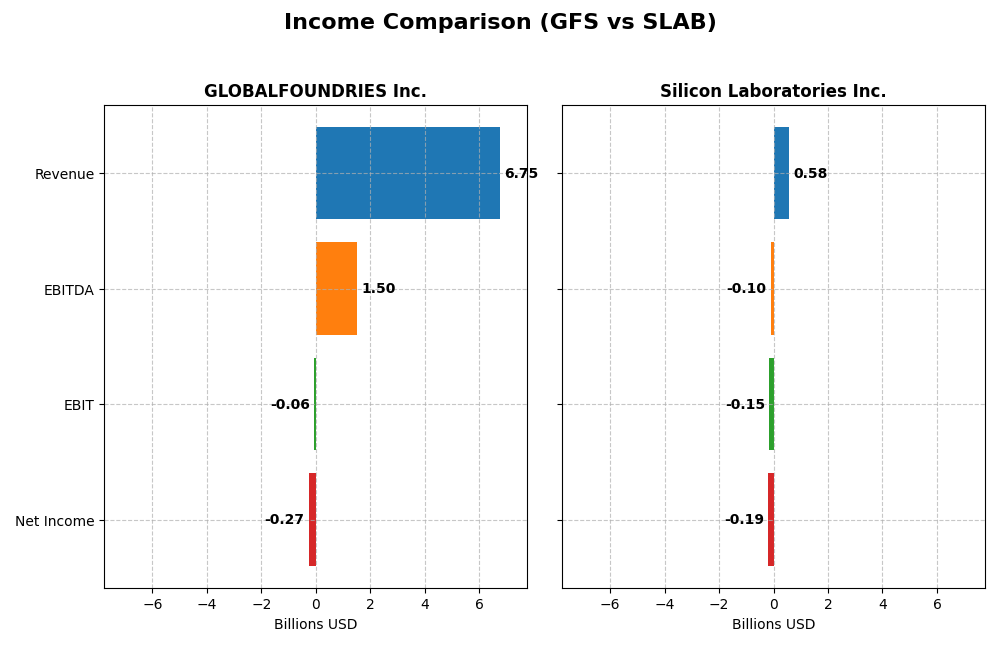
This table compares the key income statement metrics for GLOBALFOUNDRIES Inc. and Silicon Laboratories Inc. for their most recent fiscal year, providing a snapshot of their financial performance.
| Metric | GLOBALFOUNDRIES Inc. (GFS) | Silicon Laboratories Inc. (SLAB) |
|---|---|---|
| Market Cap | 23B | 5B |
| Revenue | 6.75B | 584M |
| EBITDA | 1.50B | -105M |
| EBIT | -64M | -154M |
| Net Income | -265M | -191M |
| EPS | -0.48 | -5.93 |
| Fiscal Year | 2024 | 2024 |
Income Statement Interpretations
GLOBALFOUNDRIES Inc.
GLOBALFOUNDRIES (GFS) showed revenue growth of 39.15% over 2020-2024 but experienced an 8.69% decline in 2024 alone. Net income followed a similar pattern with an 80.37% increase overall but a significant drop in the last year, resulting in a -3.93% net margin. The gross margin remained relatively strong at 24.46% despite recent margin pressures.
Silicon Laboratories Inc.
Silicon Laboratories (SLAB) posted a 14.38% revenue increase over the five-year span but faced a sharp 25.29% revenue decline in 2024. Net income deteriorated drastically, with a -1624.3% growth overall and a -32.69% net margin in 2024. Gross margin was favorable at 53.42%, yet earnings before interest and taxes (EBIT) margins were deeply negative, indicating profitability challenges.
Which one has the stronger fundamentals?
Both companies carry unfavorable overall income statement evaluations. GLOBALFOUNDRIES benefits from stronger gross margins and better revenue and net income growth over the period, despite recent setbacks. Silicon Laboratories excels in gross margin but suffers severe declines in profitability and earnings growth, reflecting weaker fundamentals comparatively.
Financial Ratios Comparison
The following table presents the most recent key financial ratios for GLOBALFOUNDRIES Inc. (GFS) and Silicon Laboratories Inc. (SLAB) as of fiscal year 2024, providing a side-by-side view for comparison.
| Ratios | GLOBALFOUNDRIES Inc. (GFS) | Silicon Laboratories Inc. (SLAB) |
|---|---|---|
| ROE | -2.46% | -17.69% |
| ROIC | -1.47% | -14.71% |
| P/E | -89.54 | -21.53 |
| P/B | 2.20 | 3.81 |
| Current Ratio | 2.11 | 6.15 |
| Quick Ratio | 1.57 | 5.07 |
| D/E (Debt to Equity) | 0.22 | 0.01 |
| Debt-to-Assets | 13.81% | 1.27% |
| Interest Coverage | -1.48 | -126.33 |
| Asset Turnover | 0.40 | 0.48 |
| Fixed Asset Turnover | 0.82 | 4.42 |
| Payout ratio | 0% | 0% |
| Dividend yield | 0% | 0% |
Interpretation of the Ratios
GLOBALFOUNDRIES Inc.
GLOBALFOUNDRIES shows several unfavorable profitability ratios in 2024, including negative net margin (-3.93%) and return on equity (-2.46%), indicating weak earnings performance. However, liquidity and leverage ratios like current ratio (2.11) and debt to equity (0.22) are favorable, suggesting solid balance sheet management. The company does not pay dividends, likely focusing on reinvestment or growth.
Silicon Laboratories Inc.
Silicon Laboratories posts weak profitability with a net margin of -32.69% and return on equity at -17.69% in 2024, signaling operational challenges. Liquidity metrics are mixed; the quick ratio (5.07) is favorable but the current ratio (6.15) is considered unfavorable. With no dividends paid, the firm may prioritize R&D and acquisitions over shareholder returns.
Which one has the best ratios?
Both companies present unfavorable overall ratio profiles in 2024, with GLOBALFOUNDRIES and Silicon Laboratories each having roughly 36% favorable and over 57% unfavorable ratios. GLOBALFOUNDRIES demonstrates stronger liquidity and leverage metrics, while Silicon Laboratories shows better fixed asset turnover. Neither company pays dividends, reflecting reinvestment priorities.
Strategic Positioning
This section compares the strategic positioning of GLOBALFOUNDRIES Inc. (GFS) and Silicon Laboratories Inc. (SLAB), focusing on Market position, Key segments, and Exposure to technological disruption:
GLOBALFOUNDRIES Inc.
- Operates as a global semiconductor foundry facing competitive pressure in wafer fabrication services.
- Key segments include wafer fabrication and engineering/pre-fabrication services, driving the integrated circuits market.
- Exposure to disruption involves semiconductor manufacturing technologies and evolving integrated circuit demands.
Silicon Laboratories Inc.
- Fabless semiconductor company competing in analog-intensive mixed-signal solutions globally.
- Focuses on industrial & commercial segments with strong presence in IoT applications and wireless microcontrollers.
- Faces disruption mainly from IoT technology advancements and analog mixed-signal innovation requirements.
GLOBALFOUNDRIES Inc. vs Silicon Laboratories Inc. Positioning
GFS shows a concentrated focus on semiconductor manufacturing and wafer fabrication, enabling scale advantages but high capital intensity. SLAB pursues diversified analog-intensive product segments with IoT emphasis, allowing broader application reach but smaller scale. Both face distinct technological challenges aligned with their business models.
Which has the best competitive advantage?
Based on MOAT evaluations, GFS has a slightly unfavorable moat with growing ROIC, indicating improving profitability despite value destruction. SLAB exhibits a very unfavorable moat with declining ROIC, reflecting deteriorating profitability and higher risk in sustaining competitive advantage.
Stock Comparison
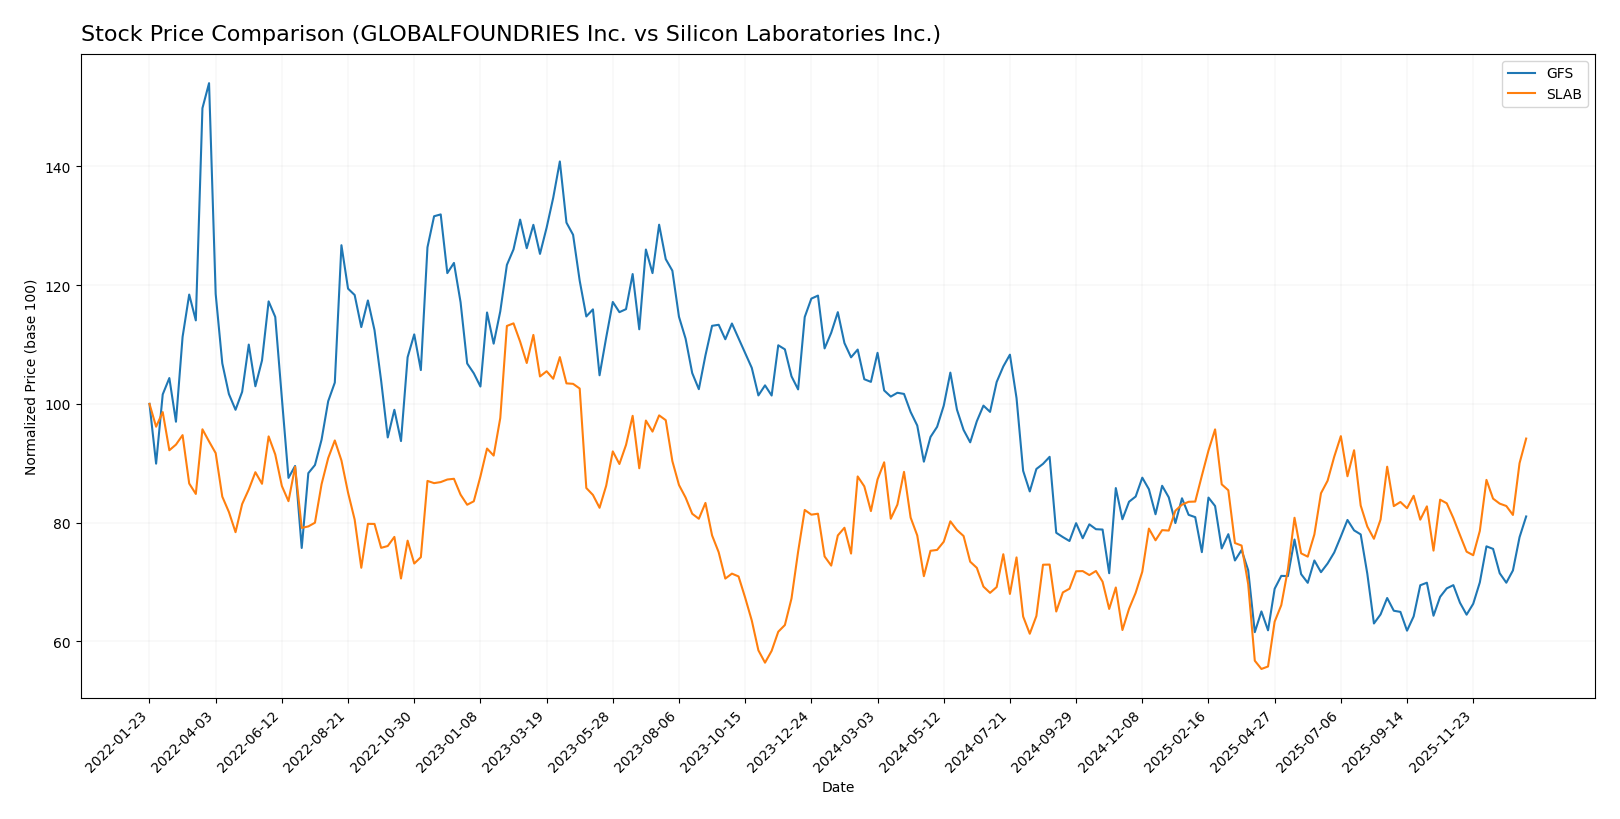
The stock price movements of GLOBALFOUNDRIES Inc. (GFS) and Silicon Laboratories Inc. (SLAB) over the past 12 months exhibit contrasting trends, with GFS showing a significant overall decline and SLAB demonstrating steady growth amid varying trading volumes.
Trend Analysis
GLOBALFOUNDRIES Inc. experienced a bearish trend over the past year with a price drop of -21.86%, marked by accelerating decline and significant volatility (6.45 std deviation), hitting a low of 31.54 and a high of 55.66.
Silicon Laboratories Inc. showed a bullish trend with a 14.91% price increase over the same period, acceleration in upward momentum, and greater volatility (14.15 std deviation), reaching a low of 89.82 and a high of 155.33.
Comparing both stocks, SLAB delivered the highest market performance with a positive 14.91% gain, outperforming GFS’s -21.86% loss over the past year.
Target Prices
Here is the current analyst target price consensus for GLOBALFOUNDRIES Inc. and Silicon Laboratories Inc.
| Company | Target High | Target Low | Consensus |
|---|---|---|---|
| GLOBALFOUNDRIES Inc. | 40 | 37 | 38.5 |
| Silicon Laboratories Inc. | 165 | 130 | 151.67 |
Analysts expect Silicon Laboratories to hold strong upside potential compared to its current price of $152.82, while GLOBALFOUNDRIES is slightly undervalued versus its $41.53 market price.
Analyst Opinions Comparison
This section compares analysts’ ratings and grades for GLOBALFOUNDRIES Inc. (GFS) and Silicon Laboratories Inc. (SLAB):
Rating Comparison
GLOBALFOUNDRIES Inc. Rating
- Rating: C+ with a Very Favorable status
- Discounted Cash Flow Score: 3, Moderate rating
- ROE Score: 1, Very Unfavorable
- ROA Score: 1, Very Unfavorable
- Debt To Equity Score: 3, Moderate rating
- Overall Score: 2, Moderate rating
Silicon Laboratories Inc. Rating
- Rating: C- with a Very Favorable status
- Discounted Cash Flow Score: 2, Moderate rating
- ROE Score: 1, Very Unfavorable
- ROA Score: 1, Very Unfavorable
- Debt To Equity Score: 1, Very Unfavorable
- Overall Score: 1, Very Unfavorable
Which one is the best rated?
Based strictly on the data, GLOBALFOUNDRIES Inc. has higher overall and discounted cash flow scores and a better debt-to-equity rating than Silicon Laboratories Inc., indicating it is better rated in these key financial metrics.
Scores Comparison
The scores comparison between GLOBALFOUNDRIES Inc. and Silicon Laboratories Inc. is as follows:
GFS Scores
- Altman Z-Score: 2.61, indicating moderate bankruptcy risk in the grey zone.
- Piotroski Score: 6, showing average financial strength.
SLAB Scores
- Altman Z-Score: 18.02, indicating very low bankruptcy risk in the safe zone.
- Piotroski Score: 4, showing average financial strength.
Which company has the best scores?
Based strictly on the provided data, SLAB has a significantly higher Altman Z-Score indicating stronger financial stability, while both companies share an average Piotroski Score with GFS slightly higher. Overall, SLAB’s Altman score is notably better.
Grades Comparison
The following analysis compares the recent grades assigned to GLOBALFOUNDRIES Inc. and Silicon Laboratories Inc. by reputable grading companies:
GLOBALFOUNDRIES Inc. Grades
This table summarizes the latest grades from leading financial institutions for GLOBALFOUNDRIES Inc.:
| Grading Company | Action | New Grade | Date |
|---|---|---|---|
| Wedbush | Downgrade | Neutral | 2025-12-31 |
| B of A Securities | Maintain | Underperform | 2025-12-04 |
| Evercore ISI Group | Maintain | Outperform | 2025-11-13 |
| JP Morgan | Maintain | Neutral | 2025-11-13 |
| Citigroup | Maintain | Neutral | 2025-11-13 |
| Wedbush | Maintain | Outperform | 2025-11-13 |
| B of A Securities | Downgrade | Underperform | 2025-10-13 |
| Deutsche Bank | Maintain | Buy | 2025-08-06 |
| Morgan Stanley | Maintain | Equal Weight | 2025-08-06 |
| Wedbush | Maintain | Outperform | 2025-08-06 |
Overall, GLOBALFOUNDRIES Inc. shows a mixed trend with recent downgrades to Neutral and Underperform, though some Outperform and Buy ratings remain.
Silicon Laboratories Inc. Grades
This table presents the current grades from established firms for Silicon Laboratories Inc.:
| Grading Company | Action | New Grade | Date |
|---|---|---|---|
| Morgan Stanley | Maintain | Equal Weight | 2025-08-06 |
| Susquehanna | Maintain | Neutral | 2025-08-06 |
| Barclays | Maintain | Equal Weight | 2025-08-05 |
| Susquehanna | Maintain | Neutral | 2025-07-22 |
| Stifel | Maintain | Buy | 2025-07-18 |
| Keybanc | Maintain | Overweight | 2025-07-08 |
| Benchmark | Maintain | Buy | 2025-05-27 |
| Benchmark | Maintain | Buy | 2025-05-14 |
| Susquehanna | Maintain | Neutral | 2025-05-14 |
| Needham | Maintain | Buy | 2025-05-14 |
Silicon Laboratories Inc. maintains predominantly Buy and Neutral ratings, with no recent downgrades, indicating overall steady positive sentiment.
Which company has the best grades?
Silicon Laboratories Inc. generally holds stronger and more consistent Buy and Overweight grades compared to GLOBALFOUNDRIES Inc., which has recent downgrades and mixed ratings. This disparity may influence investor confidence and portfolio allocation decisions.
Strengths and Weaknesses
Below is a comparative overview of key strengths and weaknesses for GLOBALFOUNDRIES Inc. (GFS) and Silicon Laboratories Inc. (SLAB) based on the most recent financial and operational data.
| Criterion | GLOBALFOUNDRIES Inc. (GFS) | Silicon Laboratories Inc. (SLAB) |
|---|---|---|
| Diversification | Moderate diversification with Water Fabrication (6.1B) and Engineering Services (652M) | Narrow focus on Industrial & Commercial segment (339M) |
| Profitability | Negative net margin (-3.93%), ROIC below WACC, but improving ROIC trend | Significant losses: net margin -32.69%, declining ROIC trend |
| Innovation | Moderate, steady ROIC growth signals efficiency gains | Weak, with declining profitability and value destruction |
| Global presence | Strong global fabrication capabilities | Limited global scale, focused on niche industrial markets |
| Market Share | Large scale in semiconductor fabrication, solid market position | Smaller market share, struggling with profitability |
Key takeaways: GLOBALFOUNDRIES shows improving profitability and strong market presence despite current value destruction, suggesting potential recovery. Silicon Laboratories faces more severe profitability challenges and declining performance, indicating higher investment risk.
Risk Analysis
Below is a comparative risk assessment for GLOBALFOUNDRIES Inc. (GFS) and Silicon Laboratories Inc. (SLAB) based on their latest financial and operational metrics from 2024.
| Metric | GLOBALFOUNDRIES Inc. (GFS) | Silicon Laboratories Inc. (SLAB) |
|---|---|---|
| Market Risk | Beta 1.485, moderate volatility | Beta 1.545, slightly higher volatility |
| Debt level | Low debt-to-equity 0.22, favorable | Very low debt-to-equity 0.01, very favorable |
| Regulatory Risk | Moderate, semiconductor industry subject to export controls | Moderate, IoT device regulations evolving globally |
| Operational Risk | Unfavorable net margin (-3.93%), negative ROE and ROIC | More severe operational losses, net margin -32.69%, negative ROE and ROIC |
| Environmental Risk | Industry-wide concerns on manufacturing emissions | Moderate, less intensive manufacturing footprint |
| Geopolitical Risk | Exposure to US-China tensions affecting chip supply chains | Exposure to US-China tensions but less supply chain dependency |
The most impactful risks are operational losses for both companies, with Silicon Laboratories facing deeper profitability challenges. Geopolitical tensions in semiconductor supply chains pose ongoing risks, particularly for GLOBALFOUNDRIES. Both companies maintain low debt, mitigating financial distress risk despite unfavorable profitability.
Which Stock to Choose?
GLOBALFOUNDRIES Inc. (GFS) shows a mixed income evolution with recent unfavorable growth metrics but favorable long-term revenue and net income growth. Financial ratios reveal more unfavorable than favorable indicators, with low profitability and manageable debt. Its rating is very favorable (C+), reflecting moderate overall scores but weaknesses in profitability measures.
Silicon Laboratories Inc. (SLAB) exhibits declining income metrics, notably negative net income growth overall and poor profitability ratios. Financial ratios are mostly unfavorable, despite very low debt levels and a strong quick ratio. Its rating is also very favorable (C-), though overall scores indicate significant financial challenges and risk.
From a rating and financial perspective, GFS might appear more stable with improving profitability trends, while SLAB shows deeper value erosion and lower financial scores. Risk-tolerant investors seeking turnaround potential could view GFS more favorably, whereas those prioritizing strong liquidity and low debt might consider SLAB’s balance sheet strength, despite its profitability struggles.
Disclaimer: Investment carries a risk of loss of initial capital. The past performance is not a reliable indicator of future results. Be sure to understand risks before making an investment decision.
Go Further
I encourage you to read the complete analyses of GLOBALFOUNDRIES Inc. and Silicon Laboratories Inc. to enhance your investment decisions: