The semiconductor industry remains a dynamic and essential sector driving global technology advancements. GLOBALFOUNDRIES Inc. (GFS) and Qnity Electronics, Inc. (Q) both play pivotal roles within this market, focusing on chip manufacturing and advanced electronic materials. Despite their shared industry, they differ in scale and innovation strategies, making their comparison particularly insightful. In this article, I will help you identify which company holds the most promise for your investment portfolio.

Table of contents
Companies Overview
I will begin the comparison between GLOBALFOUNDRIES Inc. and Qnity Electronics, Inc. by providing an overview of these two companies and their main differences.
GLOBALFOUNDRIES Overview
GLOBALFOUNDRIES Inc. operates as a semiconductor foundry worldwide, manufacturing integrated circuits that enable a broad range of electronic devices. The company offers wafer fabrication services and produces various semiconductor devices, including microprocessors, mobile application processors, and power management units. Founded in 2009, it is based in Malta, New York, and trades on NASDAQ with a market cap of approximately 23B USD.
Qnity Electronics Overview
Qnity Electronics, Inc. specializes in providing electronic solutions and advanced materials used in semiconductor chip manufacturing. Formerly Novus SpinCo 1, Inc., it changed its name in April 2025. The company is headquartered in Wilmington, Delaware, listed on the NYSE, and has a market cap near 19.5B USD. Qnity focuses on supplying materials critical to semiconductor production rather than chip fabrication itself.
Key similarities and differences
Both GLOBALFOUNDRIES and Qnity Electronics operate within the semiconductor industry and are publicly traded US technology companies. However, GLOBALFOUNDRIES primarily manufactures semiconductor devices and offers wafer fabrication services, whereas Qnity concentrates on supplying materials and solutions for semiconductor chip manufacturing. Their business models differ, with GLOBALFOUNDRIES emphasizing production and Qnity focusing on component supply.
Income Statement Comparison
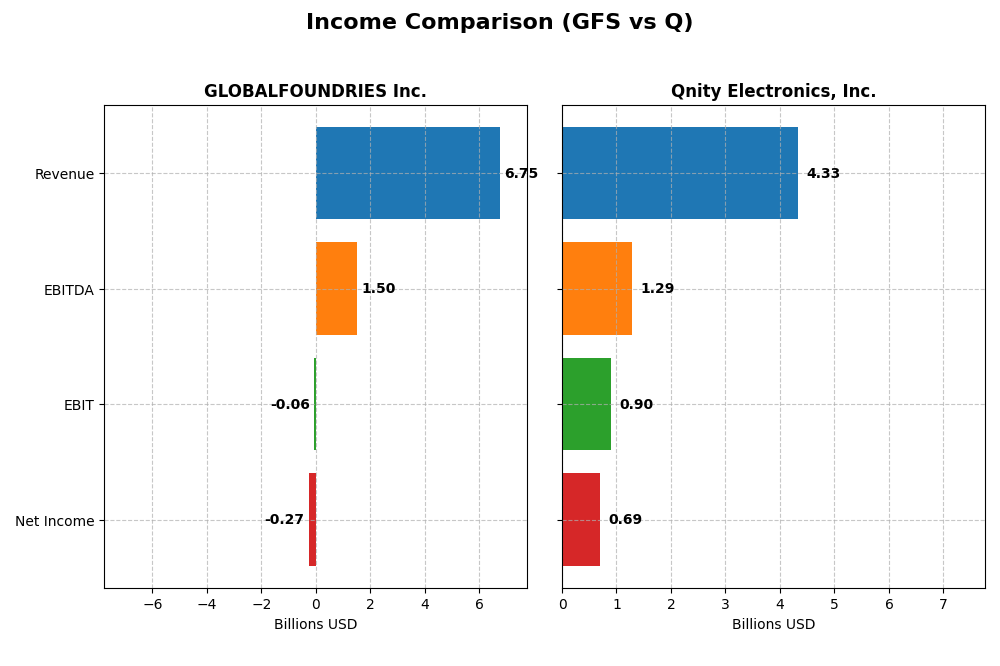
The table below presents a side-by-side comparison of key income statement metrics for GLOBALFOUNDRIES Inc. and Qnity Electronics, Inc. for the fiscal year 2024.
| Metric | GLOBALFOUNDRIES Inc. (GFS) | Qnity Electronics, Inc. (Q) |
|---|---|---|
| Market Cap | 23B | 19.5B |
| Revenue | 6.75B | 4.34B |
| EBITDA | 1.50B | 1.29B |
| EBIT | -64M | 898M |
| Net Income | -265M | 693M |
| EPS | -0.48 | 3.31 |
| Fiscal Year | 2024 | 2024 |
Income Statement Interpretations
GLOBALFOUNDRIES Inc.
GLOBALFOUNDRIES showed a revenue increase of 39.15% from 2020 to 2024 but experienced a net income decline in 2024, posting a loss of $265M compared to a $1.02B profit in 2023. Gross margins held at 24.46%, yet EBIT and net margins turned negative last year. The 2024 performance reflects a slowdown with margin contractions and rising expenses impacting profitability.
Qnity Electronics, Inc.
Qnity Electronics’ revenue fell by 8.83% over 2022-2024 but rose 7.43% in 2024 alone to $4.34B, with net income at $693M, up from $507M in 2023. Gross margin improved to 46.11%, and EBIT margin stood at 20.72%. The latest year showed margin expansion and solid earnings growth, supported by controlled operating expenses and increased profitability.
Which one has the stronger fundamentals?
Qnity Electronics exhibits stronger fundamentals with favorable gross, EBIT, and net margins, plus positive recent growth in revenue and earnings. GLOBALFOUNDRIES, despite long-term revenue and net income growth, faced a 2024 decline in profitability and unfavorable EBIT and net margin trends. Qnity’s overall income statement evaluation is favorable, contrasting with GLOBALFOUNDRIES’ unfavorable assessment.
Financial Ratios Comparison
The table below presents key financial ratios for GLOBALFOUNDRIES Inc. (GFS) and Qnity Electronics, Inc. (Q) based on their most recent fiscal year data for 2024.
| Ratios | GLOBALFOUNDRIES Inc. (GFS) | Qnity Electronics, Inc. (Q) |
|---|---|---|
| ROE | -2.46% | 6.51% |
| ROIC | -1.47% | 5.92% |
| P/E | -89.5 | 28.8 |
| P/B | 2.20 | 1.88 |
| Current Ratio | 2.11 | 1.77 |
| Quick Ratio | 1.57 | 1.06 |
| D/E | 0.22 | 0.02 |
| Debt-to-Assets | 13.8% | 1.56% |
| Interest Coverage | -1.48 | 3.03 |
| Asset Turnover | 0.40 | 0.35 |
| Fixed Asset Turnover | 0.82 | 2.59 |
| Payout ratio | 0 | 0 |
| Dividend yield | 0 | 0 |
Interpretation of the Ratios
GLOBALFOUNDRIES Inc.
GLOBALFOUNDRIES shows a mixed ratio profile with key weaknesses in profitability and efficiency metrics, such as a negative net margin of -3.93% and return on equity at -2.46%, indicating operational challenges. The company benefits from strong liquidity ratios, with a current ratio of 2.11 and low debt levels. It does not pay dividends, likely reflecting reinvestment priorities or a cautious financial stance.
Qnity Electronics, Inc.
Qnity Electronics demonstrates stronger profitability with a favorable net margin of 15.99% but exhibits some concern with a modest return on equity of 6.51%. Its capital structure is conservative, marked by a low debt-to-assets ratio of 1.56% and solid liquidity metrics. The company pays a small dividend, indicating a measured approach to shareholder returns alongside ongoing investments.
Which one has the best ratios?
Qnity Electronics has a more favorable overall ratio profile, with higher profitability and a lower debt burden compared to GLOBALFOUNDRIES. While GLOBALFOUNDRIES benefits from strong liquidity, its negative returns and interest coverage raise concerns. Qnity’s balance of profitability and capital management results in a slightly favorable rating versus GLOBALFOUNDRIES’ unfavorable evaluation.
Strategic Positioning
This section compares the strategic positioning of GLOBALFOUNDRIES Inc. (GFS) and Qnity Electronics, Inc. (Q), including market position, key segments, and exposure to technological disruption:
GLOBALFOUNDRIES Inc.
- Large semiconductor foundry with NASDAQ listing; faces competitive pressure in chip manufacturing.
- Key segments include wafer fabrication ($6.1B in 2024) and engineering/pre-fabrication services ($652M in 2024).
- Exposed to semiconductor industry technological shifts through integrated circuit manufacturing services.
Qnity Electronics, Inc.
- Focuses on electronic solutions and materials for semiconductor chip manufacturing; listed on NYSE.
- Concentrated on advanced electronic materials and semiconductor manufacturing solutions; no reported segment revenue.
- Exposure through provision of advanced materials used in chip manufacturing; no detailed disruption data provided.
GLOBALFOUNDRIES Inc. vs Qnity Electronics, Inc. Positioning
GFS shows a diversified business with significant revenue from wafer fabrication and engineering services, while Q is more concentrated on electronic materials for semiconductors. GFS’s broader segment base offers scale, whereas Q’s focus may limit revenue diversification.
Which has the best competitive advantage?
Based on MOAT evaluation, GFS has a slightly unfavorable moat with growing profitability but is still shedding value. Q holds a neutral moat with stable profitability but no clear competitive advantage yet.
Stock Comparison
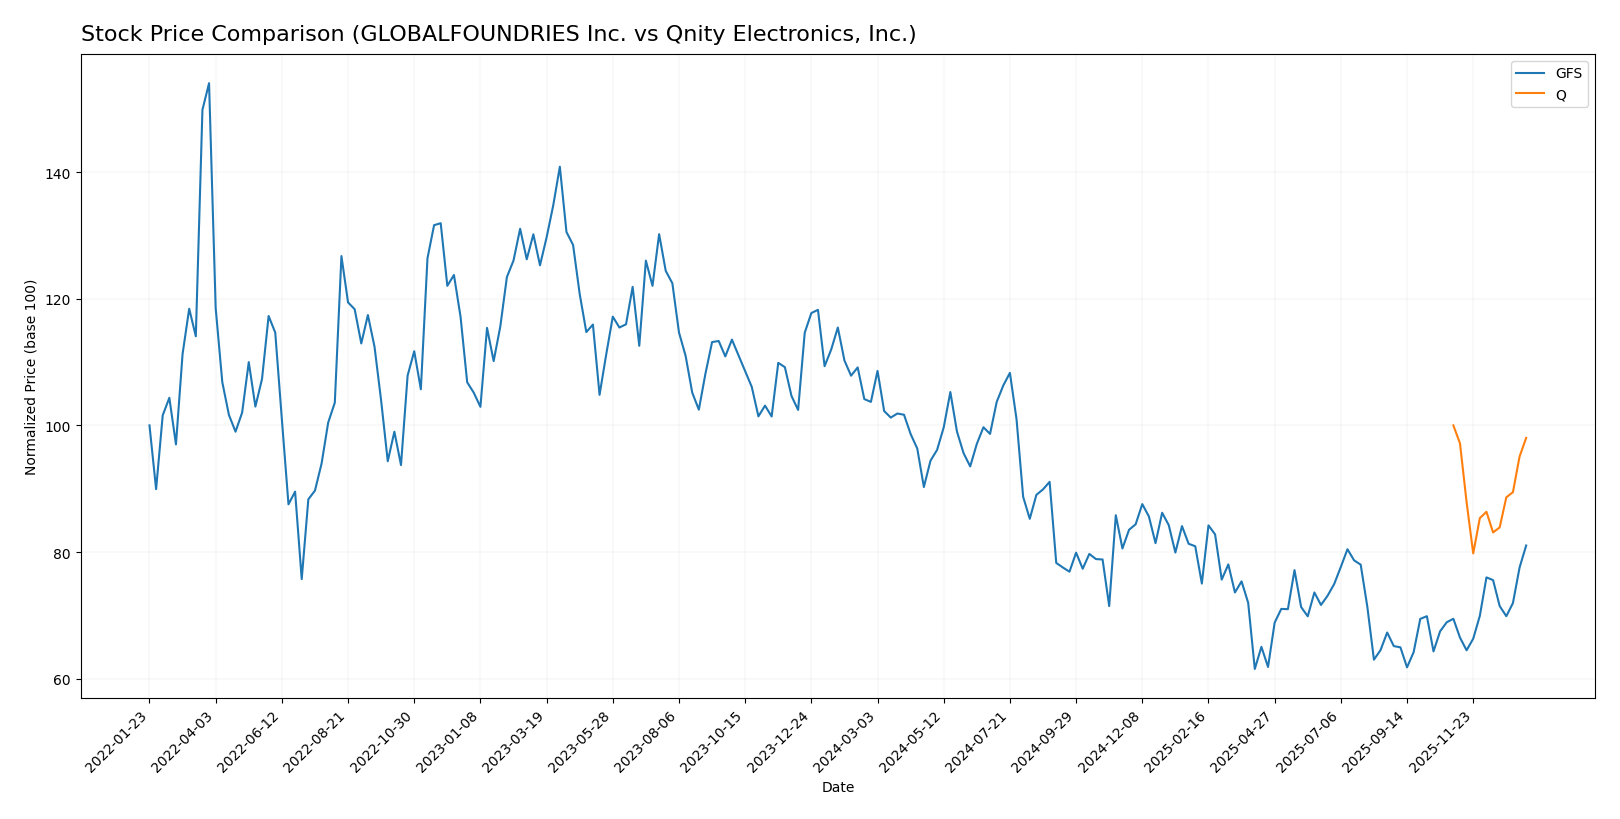
The stock prices of GLOBALFOUNDRIES Inc. (GFS) and Qnity Electronics, Inc. (Q) have shown contrasting dynamics over the past 12 months, with GFS experiencing a pronounced bearish trend marked by acceleration, while Q’s movement remained close to neutral with stable conditions.
Trend Analysis
GLOBALFOUNDRIES Inc. (GFS) exhibited a bearish trend over the past year with a -21.86% price change and accelerating decline, hitting a low of 31.54 and a high of 55.66. Recent months show a rebound with a +16.66% gain.
Qnity Electronics, Inc. (Q) recorded a near-neutral trend with a -1.98% price change over the last 12 months, displaying stability and a relatively narrow price range between 75.8 and 95.0, with no acceleration in trend.
Comparing the two, Qnity Electronics delivered the highest market performance, as GFS’s substantial overall decline outweighed its recent recovery.
Target Prices
Here is the current target price consensus from verified analysts for selected semiconductor companies.
| Company | Target High | Target Low | Consensus |
|---|---|---|---|
| GLOBALFOUNDRIES Inc. | 40 | 37 | 38.5 |
| Qnity Electronics, Inc. | 117 | 92 | 105.89 |
Analysts expect Qnity Electronics shares to appreciate significantly above the current price of $93.12, while GLOBALFOUNDRIES trades slightly above its consensus target of $38.5, indicating differing risk-reward profiles.
Analyst Opinions Comparison
This section compares analysts’ ratings and grades for GLOBALFOUNDRIES Inc. and Qnity Electronics, Inc.:
Rating Comparison
GLOBALFOUNDRIES Inc. Rating
- Rating: C+, considered very favorable overall
- Discounted Cash Flow Score: 3, moderate valuation outlook
- ROE Score: 1, very unfavorable profitability from equity
- ROA Score: 1, very unfavorable asset utilization
- Debt To Equity Score: 3, moderate financial risk
- Overall Score: 2, moderate overall financial standing
Qnity Electronics, Inc. Rating
- Rating: B+, considered very favorable overall
- Discounted Cash Flow Score: 4, favorable valuation outlook
- ROE Score: 3, moderate profitability from equity
- ROA Score: 4, favorable asset utilization
- Debt To Equity Score: 3, moderate financial risk
- Overall Score: 3, moderate overall financial standing
Which one is the best rated?
Based strictly on the provided data, Qnity Electronics, Inc. holds a higher rating (B+) and better scores in discounted cash flow, ROE, ROA, and overall score compared to GLOBALFOUNDRIES Inc., which has a C+ rating and lower profitability and asset utilization scores.
Scores Comparison
Below is a comparison of the Altman Z-Score and Piotroski Score for GLOBALFOUNDRIES Inc. and Qnity Electronics, Inc.:
GLOBALFOUNDRIES Inc. Scores
- Altman Z-Score: 2.61, indicating moderate bankruptcy risk in the grey zone.
- Piotroski Score: 6, showing average financial strength and value potential.
Qnity Electronics, Inc. Scores
- No data available
- No data available
Which company has the best scores?
GLOBALFOUNDRIES Inc. has measurable scores with an Altman Z-Score in the grey zone and an average Piotroski Score. Qnity Electronics, Inc. has no available score data for comparison.
Grades Comparison
Here is the grades comparison for GLOBALFOUNDRIES Inc. and Qnity Electronics, Inc.:
GLOBALFOUNDRIES Inc. Grades
The table below summarizes recent grades for GLOBALFOUNDRIES Inc. from reputable grading companies.
| Grading Company | Action | New Grade | Date |
|---|---|---|---|
| Wedbush | Downgrade | Neutral | 2025-12-31 |
| B of A Securities | Maintain | Underperform | 2025-12-04 |
| Evercore ISI Group | Maintain | Outperform | 2025-11-13 |
| JP Morgan | Maintain | Neutral | 2025-11-13 |
| Citigroup | Maintain | Neutral | 2025-11-13 |
| Wedbush | Maintain | Outperform | 2025-11-13 |
| B of A Securities | Downgrade | Underperform | 2025-10-13 |
| Deutsche Bank | Maintain | Buy | 2025-08-06 |
| Morgan Stanley | Maintain | Equal Weight | 2025-08-06 |
| Wedbush | Maintain | Outperform | 2025-08-06 |
GLOBALFOUNDRIES shows a mixed trend with multiple maintained Outperform and Neutral grades but recent downgrades to Neutral and Underperform.
Qnity Electronics, Inc. Grades
The table below provides the latest grades for Qnity Electronics, Inc. from established grading firms.
| Grading Company | Action | New Grade | Date |
|---|---|---|---|
| RBC Capital | Maintain | Outperform | 2025-11-25 |
| Mizuho | Maintain | Outperform | 2025-11-20 |
Qnity Electronics maintains consistent Outperform ratings from both grading companies.
Which company has the best grades?
Qnity Electronics holds stronger and more consistent Outperform grades, while GLOBALFOUNDRIES has a wider range including Neutral and Underperform. This contrast may influence investor confidence and portfolio positioning.
Strengths and Weaknesses
The table below compares key strengths and weaknesses of GLOBALFOUNDRIES Inc. (GFS) and Qnity Electronics, Inc. (Q) based on diversification, profitability, innovation, global presence, and market share.
| Criterion | GLOBALFOUNDRIES Inc. (GFS) | Qnity Electronics, Inc. (Q) |
|---|---|---|
| Diversification | Moderate (main revenue from Water Fabrication at $6.1B in 2024, plus Engineering services at $652M) | Limited product range, focused on electronics |
| Profitability | Unfavorable: Negative net margin (-3.93%) and ROIC (-1.47%) indicating value destruction | Slightly favorable: Positive net margin (15.99%), ROIC (5.92%) stable but no strong growth |
| Innovation | Growing ROIC trend suggests improving operational efficiency | Stable ROIC, no clear innovation-driven growth |
| Global presence | Significant global footprint as a semiconductor foundry | Smaller footprint, less international exposure |
| Market Share | Competes in a highly competitive market with fluctuating returns | Stable niche player with steady market position |
Key takeaways: GLOBALFOUNDRIES shows improving profitability trends but still destroys value overall, facing challenges in efficiency and margins. Qnity Electronics maintains stable profitability with moderate financial health, though lacks strong market expansion or innovation momentum. Investors should weigh GFS’s recovery potential against Q’s steadier but less dynamic profile.
Risk Analysis
Below is a comparative table outlining key risk metrics for GLOBALFOUNDRIES Inc. (GFS) and Qnity Electronics, Inc. (Q) based on the most recent data from 2024.
| Metric | GLOBALFOUNDRIES Inc. (GFS) | Qnity Electronics, Inc. (Q) |
|---|---|---|
| Market Risk | High beta of 1.485 indicates elevated market volatility exposure | Beta of 0 suggests minimal market volatility exposure |
| Debt level | Debt-to-equity ratio 0.22; Debt to assets 13.81% (favorable) | Very low debt with debt-to-equity 0.02; debt to assets 1.56% (favorable) |
| Regulatory Risk | Moderate; operates globally with semiconductor industry regulation | Moderate; semiconductor materials sector with evolving regulations |
| Operational Risk | Unfavorable asset turnover and fixed asset turnover suggest operational inefficiencies | Moderate operational efficiency; fixed asset turnover favorable |
| Environmental Risk | Standard semiconductor industry environmental concerns, no specific red flags | Similar industry risks; no current adverse issues reported |
| Geopolitical Risk | Exposed due to global operations and supply chain sensitivities | Lower geopolitical risk, primarily US-based operations |
Synthesis: GLOBALFOUNDRIES faces higher market risk and operational inefficiencies, with financial ratios signaling caution—negative margins and weak returns highlight vulnerability. Qnity Electronics shows stronger financial stability and lower debt, with less market volatility risk, making operational and market risks more manageable. The most impactful risks are GFS’s operational inefficiency and market sensitivity, while Q’s main risks lie in regulatory shifts and maintaining growth.
Which Stock to Choose?
GLOBALFOUNDRIES Inc. (GFS) shows a mixed financial profile with a declining income in 2024, unfavorable profitability ratios including negative net margin (-3.93%) and ROE (-2.46%), low debt levels, and a very favorable credit rating of C+. Its ROIC is below WACC, indicating value destruction despite a recent growth in profitability.
Qnity Electronics, Inc. (Q) presents favorable income metrics with a 15.99% net margin and positive EBIT margin of 20.72% in 2024. It maintains low debt, a slightly favorable overall ratio evaluation, and a very favorable B+ rating. Q’s ROIC roughly matches WACC, suggesting stable but limited competitive advantage.
For investors prioritizing growth, Q might appear more attractive given its stronger profitability and favorable income statement, whereas risk-tolerant investors could interpret GFS’s improving ROIC trend as a potential turnaround despite current challenges. The choice largely depends on the investor’s risk appetite and focus on stability versus recovery potential.
Disclaimer: Investment carries a risk of loss of initial capital. The past performance is not a reliable indicator of future results. Be sure to understand risks before making an investment decision.
Go Further
I encourage you to read the complete analyses of GLOBALFOUNDRIES Inc. and Qnity Electronics, Inc. to enhance your investment decisions: