The semiconductor industry remains a cornerstone of modern technology, driving innovation and economic growth worldwide. GLOBALFOUNDRIES Inc. (GFS) and Onto Innovation Inc. (ONTO) are two prominent players in this sector, each specializing in different yet complementary aspects of semiconductor manufacturing and process control. This article will analyze their market positions and innovation strategies to help you decide which company may offer the most compelling investment opportunity.
Table of contents
Companies Overview
I will begin the comparison between GLOBALFOUNDRIES Inc. and Onto Innovation Inc. by providing an overview of these two companies and their main differences.
GLOBALFOUNDRIES Overview
GLOBALFOUNDRIES Inc. is a semiconductor foundry based in Malta, New York, focused on manufacturing integrated circuits that power a wide range of electronic devices. Founded in 2009, it offers wafer fabrication services and technologies, producing microprocessors, microcontrollers, and power management units among other semiconductor devices. The company operates globally with about 13,000 employees and a market cap of approximately 23B USD.
Onto Innovation Overview
Onto Innovation Inc., headquartered in Wilmington, Massachusetts, designs and manufactures process control tools for semiconductor and advanced packaging device manufacturers. Established in 1940, it provides macro defect inspection, optical metrology, lithography systems, and process control software. The company employs around 1,551 people and holds a market cap near 10.7B USD, serving various industrial and scientific applications worldwide.
Key similarities and differences
Both companies operate within the semiconductor industry and provide technology solutions crucial to semiconductor manufacturing. GLOBALFOUNDRIES primarily focuses on wafer fabrication and integrated circuit production, while Onto Innovation specializes in process control tools and software for defect inspection and yield management. GLOBALFOUNDRIES is significantly larger in workforce and market capitalization, reflecting differing scales and core business models.
Income Statement Comparison
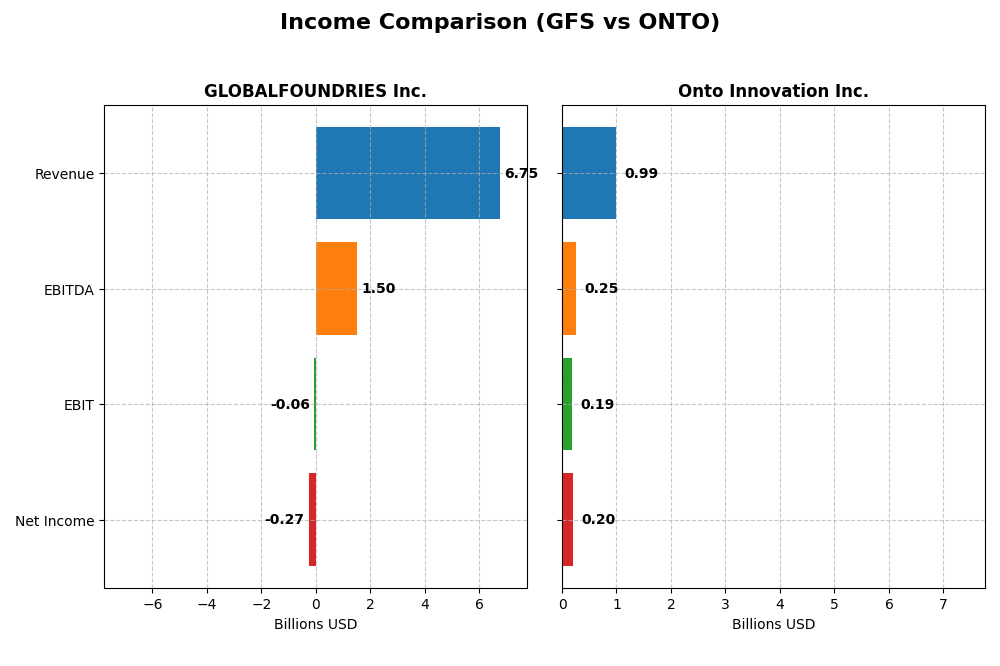
The table below compares the latest fiscal year income statement metrics for GLOBALFOUNDRIES Inc. and Onto Innovation Inc., giving a snapshot of their financial performance in 2024.
| Metric | GLOBALFOUNDRIES Inc. | Onto Innovation Inc. |
|---|---|---|
| Market Cap | 23B | 11B |
| Revenue | 6.75B | 987M |
| EBITDA | 1.50B | 249M |
| EBIT | -64M | 187M |
| Net Income | -265M | 202M |
| EPS | -0.48 | 4.09 |
| Fiscal Year | 2024 | 2024 |
Income Statement Interpretations
GLOBALFOUNDRIES Inc.
GLOBALFOUNDRIES showed a mixed income trend from 2020 to 2024, with revenue growing overall by 39.15% but declining by 8.69% in the last year. Net income followed a similar pattern, increasing 80.37% across the period but turning negative in 2024. Gross margin remained relatively stable and favorable at 24.46%, yet EBIT and net margins deteriorated in 2024, indicating pressures on profitability.
Onto Innovation Inc.
Onto Innovation experienced consistent growth in revenue and net income over 2020-2024, with a 77.42% and 550.02% increase respectively. Margins improved significantly, reflected in a strong gross margin of 52.19% and net margin of 20.43%. The most recent year showed acceleration in growth rates, including a 21.01% revenue rise and 65.04% EPS growth, supporting robust profitability gains.
Which one has the stronger fundamentals?
Onto Innovation’s income statement displays stronger fundamentals with favorable growth trends, expanding margins, and solid profitability across all key metrics. In contrast, GLOBALFOUNDRIES shows overall revenue and net income growth but faced recent declines and negative margins, signaling challenges in sustaining profitability. The financials suggest Onto Innovation holds a more consistently positive income profile.
Financial Ratios Comparison
The following table presents a side-by-side comparison of key financial ratios for GLOBALFOUNDRIES Inc. (GFS) and Onto Innovation Inc. (ONTO) based on their most recent fiscal year data from 2024.
| Ratios | GLOBALFOUNDRIES Inc. (GFS) | Onto Innovation Inc. (ONTO) |
|---|---|---|
| ROE | -2.46% | 10.47% |
| ROIC | -1.47% | 8.77% |
| P/E | -89.54 | 41.76 |
| P/B | 2.20 | 4.37 |
| Current Ratio | 2.11 | 8.69 |
| Quick Ratio | 1.57 | 7.00 |
| D/E (Debt-to-Equity) | 0.22 | 0.01 |
| Debt-to-Assets | 13.81% | 0.72% |
| Interest Coverage | -1.48 | 0 |
| Asset Turnover | 0.40 | 0.47 |
| Fixed Asset Turnover | 0.82 | 7.16 |
| Payout Ratio | 0 | 0 |
| Dividend Yield | 0 | 0 |
Interpretation of the Ratios
GLOBALFOUNDRIES Inc.
GLOBALFOUNDRIES shows a mixed financial profile with more unfavorable ratios including negative net margin (-3.93%) and return on equity (-2.46%), indicating profitability challenges. The company’s current and quick ratios are favorable, suggesting liquidity strength. GLOBALFOUNDRIES does not pay dividends, likely due to ongoing reinvestment needs and profitability issues, with no share buybacks noted.
Onto Innovation Inc.
Onto Innovation presents a stronger profitability profile with a favorable net margin of 20.43%, though return on equity (10.47%) and return on invested capital (8.77%) are neutral. Liquidity ratios are mixed: a very high current ratio is unfavorable, but quick ratio is favorable. Onto Innovation does not pay dividends, possibly prioritizing growth and R&D investments over distributions or buybacks.
Which one has the best ratios?
Comparing the two, Onto Innovation has a more favorable profitability profile and balanced liquidity, despite some unfavorable valuations and a high current ratio. GLOBALFOUNDRIES faces more significant profitability and efficiency challenges with a largely unfavorable ratio set. Overall, Onto Innovation’s ratios suggest a relatively stronger financial position.
Strategic Positioning
This section compares the strategic positioning of GLOBALFOUNDRIES Inc. and Onto Innovation Inc. regarding Market position, Key segments, and Exposure to technological disruption:
GLOBALFOUNDRIES Inc.
- Large semiconductor foundry with 13K employees, facing typical competitive pressures in fabrication services.
- Key segments include wafer fabrication (~$6B) and engineering services (~$650M) driving revenue growth.
- Exposure to disruption mainly from advancements in semiconductor manufacturing technologies impacting wafer fabs.
Onto Innovation Inc.
- Smaller process control tools provider with 1.5K employees, operating in niche semiconductor equipment markets.
- Focuses on systems/software (~$850M), parts, and services, supporting yield management and device packaging.
- Faces disruption from evolving metrology and inspection technologies critical to semiconductor production quality.
GLOBALFOUNDRIES Inc. vs Onto Innovation Inc. Positioning
GLOBALFOUNDRIES operates a diversified fabrication business with a broad semiconductor device range, while Onto Innovation concentrates on specialized process control tools and software. GLOBALFOUNDRIES’ scale offers volume, whereas Onto Innovation targets precision and innovation in niche segments.
Which has the best competitive advantage?
Both companies show slightly unfavorable MOATs, shedding value despite growing ROIC trends. GLOBALFOUNDRIES and Onto Innovation face challenges in efficiently using invested capital, indicating limited durable competitive advantages based on current MOAT evaluations.
Stock Comparison
The past year showed contrasting stock price movements: GLOBALFOUNDRIES Inc. (GFS) experienced a sustained bearish trend with accelerating decline, while Onto Innovation Inc. (ONTO) displayed a strong bullish trend with accelerating gains.

Trend Analysis
GLOBALFOUNDRIES Inc. (GFS) stock declined 21.86% over the past 12 months, indicating a bearish trend with accelerating price drops. The price ranged from a high of 55.66 to a low of 31.54, with moderate volatility (std dev 6.45).
Onto Innovation Inc. (ONTO) gained 22.07% over the last year, reflecting a bullish trend with accelerating upward momentum. Price volatility was high (std dev 42.61), with prices moving between 88.5 and 233.14.
Comparing the two, Onto Innovation outperformed GLOBALFOUNDRIES with a positive 22.07% gain versus GFS’s 21.86% loss, delivering the highest market performance over the analyzed period.
Target Prices
Analysts provide clear target price ranges indicating mixed expectations for these semiconductor companies.
| Company | Target High | Target Low | Consensus |
|---|---|---|---|
| GLOBALFOUNDRIES Inc. | 40 | 37 | 38.5 |
| Onto Innovation Inc. | 200 | 160 | 178 |
GLOBALFOUNDRIES’ consensus target price of 38.5 is slightly below its current price of 41.53, suggesting limited upside or potential correction. Onto Innovation shows a consensus target of 178, well below its current 217.85 price, indicating expectations of downward adjustment.
Analyst Opinions Comparison
This section compares analysts’ ratings and grades for GLOBALFOUNDRIES Inc. (GFS) and Onto Innovation Inc. (ONTO):
Rating Comparison
GFS Rating
- Rating: C+ with a very favorable status reflecting overall financial standing.
- Discounted Cash Flow Score: 3, moderate valuation based on future cash flows.
- ROE Score: 1, very unfavorable efficiency in generating profit from equity.
- ROA Score: 1, very unfavorable asset utilization to generate earnings.
- Debt To Equity Score: 3, moderate financial risk from debt levels.
- Overall Score: 2, moderate overall financial standing.
ONTO Rating
- Rating: B+ with a very favorable status indicating stronger financial health.
- Discounted Cash Flow Score: 3, moderate valuation based on future cash flows.
- ROE Score: 3, moderate efficiency in generating profit from equity.
- ROA Score: 4, favorable asset utilization to generate earnings.
- Debt To Equity Score: 4, favorable financial risk with lower reliance on debt.
- Overall Score: 3, moderate overall financial standing but higher than GFS.
Which one is the best rated?
Based strictly on the data, ONTO holds a stronger position with a B+ rating, higher ROE, ROA, and debt-to-equity scores compared to GFS’s C+ rating and weaker profitability metrics. ONTO’s overall score is also higher, indicating better analyst sentiment.
Scores Comparison
Here is a comparison of the financial health scores for GLOBALFOUNDRIES Inc. and Onto Innovation Inc.:
GLOBALFOUNDRIES Inc. Scores
- Altman Z-Score: 2.61, indicating moderate bankruptcy risk in the grey zone.
- Piotroski Score: 6, reflecting average financial strength.
Onto Innovation Inc. Scores
- Altman Z-Score: 34.16, indicating very low bankruptcy risk in the safe zone.
- Piotroski Score: 4, reflecting average financial strength.
Which company has the best scores?
Onto Innovation shows a significantly stronger Altman Z-Score, placing it well within the safe zone, while GLOBALFOUNDRIES is in the grey zone. Both have average Piotroski Scores, with GLOBALFOUNDRIES slightly higher. Overall, Onto Innovation has the better score profile based on the provided data.
Grades Comparison
Here is a detailed comparison of the latest grades assigned to GLOBALFOUNDRIES Inc. and Onto Innovation Inc.:
GLOBALFOUNDRIES Inc. Grades
The following table summarizes recent stock grades issued by recognized financial institutions for GLOBALFOUNDRIES Inc.:
| Grading Company | Action | New Grade | Date |
|---|---|---|---|
| Wedbush | Downgrade | Neutral | 2025-12-31 |
| B of A Securities | Maintain | Underperform | 2025-12-04 |
| Evercore ISI Group | Maintain | Outperform | 2025-11-13 |
| JP Morgan | Maintain | Neutral | 2025-11-13 |
| Citigroup | Maintain | Neutral | 2025-11-13 |
| Wedbush | Maintain | Outperform | 2025-11-13 |
| B of A Securities | Downgrade | Underperform | 2025-10-13 |
| Deutsche Bank | Maintain | Buy | 2025-08-06 |
| Morgan Stanley | Maintain | Equal Weight | 2025-08-06 |
| Wedbush | Maintain | Outperform | 2025-08-06 |
GLOBALFOUNDRIES Inc. shows a mixed trend with multiple neutral and outperform ratings but also downgrades to underperform, indicating some analyst caution.
Onto Innovation Inc. Grades
The table below lists recent grades assigned to Onto Innovation Inc. by reputable grading firms:
| Grading Company | Action | New Grade | Date |
|---|---|---|---|
| Stifel | Maintain | Hold | 2026-01-14 |
| Needham | Maintain | Buy | 2026-01-06 |
| Jefferies | Maintain | Buy | 2025-12-15 |
| B. Riley Securities | Maintain | Buy | 2025-11-18 |
| Needham | Maintain | Buy | 2025-11-18 |
| Evercore ISI Group | Maintain | Outperform | 2025-11-05 |
| Oppenheimer | Maintain | Outperform | 2025-10-14 |
| Stifel | Maintain | Hold | 2025-10-13 |
| B. Riley Securities | Maintain | Buy | 2025-10-10 |
| Jefferies | Upgrade | Buy | 2025-09-23 |
Onto Innovation Inc. maintains a generally positive grade profile with consistent buy and outperform ratings, reflecting sustained analyst confidence.
Which company has the best grades?
Onto Innovation Inc. has received more consistent buy and outperform grades compared to GLOBALFOUNDRIES Inc., which has a mix including several neutral and underperform ratings. This suggests Onto Innovation may currently enjoy higher analyst confidence, potentially influencing investor sentiment positively.
Strengths and Weaknesses
Below is a comparison of key strengths and weaknesses for GLOBALFOUNDRIES Inc. (GFS) and Onto Innovation Inc. (ONTO) based on the most recent financial and operational data.
| Criterion | GLOBALFOUNDRIES Inc. (GFS) | Onto Innovation Inc. (ONTO) |
|---|---|---|
| Diversification | Moderate: Focus on Water Fabrication (6.1B USD) and Engineering Services (652M USD) | High: Diverse revenue streams with Systems & Software (850M USD), Parts (77M USD), and Services (60M USD) |
| Profitability | Weak: Negative net margin (-3.93%), ROIC -1.47%, value destroying | Strong: Positive net margin (20.43%), ROIC 8.77%, but still slightly below WACC |
| Innovation | Moderate: Growing ROIC trend indicates improving efficiency | High: Significant ROIC growth (344%), strong fixed asset turnover (7.16) |
| Global presence | Established manufacturing footprint worldwide | Specialized technology provider with growing global reach |
| Market Share | Large in water fabrication segment but challenged by profitability | Smaller market cap but expanding market share via innovation |
Key takeaways: GFS shows scale advantages in water fabrication but suffers from ongoing profitability challenges, while ONTO demonstrates robust profitability growth and innovation, though with a smaller revenue base. Careful risk management favors ONTO’s growth trajectory despite valuation concerns.
Risk Analysis
Below is a comparative table highlighting key risks associated with GLOBALFOUNDRIES Inc. (GFS) and Onto Innovation Inc. (ONTO) based on the latest 2024 data.
| Metric | GLOBALFOUNDRIES Inc. (GFS) | Onto Innovation Inc. (ONTO) |
|---|---|---|
| Market Risk | High beta (1.485) indicates above-average volatility | High beta (1.461) also suggests elevated volatility |
| Debt Level | Moderate debt-to-equity ratio at 0.22, favorable leverage | Very low debt-to-equity ratio at 0.01, low financial risk |
| Regulatory Risk | Semiconductor industry faces evolving regulations globally | Similar regulatory exposure in semiconductor equipment sector |
| Operational Risk | Larger workforce (13K employees) increases complexity | Smaller scale (1.5K employees), potentially lower operational complexity |
| Environmental Risk | Industry subject to environmental compliance; no dividend yield highlights reinvestment | Also exposed to environmental compliance; no dividend yield |
| Geopolitical Risk | US-based with global operations, sensitive to trade tensions | US-based, exposure to international market uncertainties |
Synthesis: GFS carries higher market volatility and operational risks with moderate leverage, while ONTO’s very low debt and strong operational scores position it more conservatively. The semiconductor sector’s regulatory and geopolitical risks remain significant for both, especially amid ongoing global supply chain challenges.
Which Stock to Choose?
GLOBALFOUNDRIES Inc. (GFS) shows a declining income trend in 2024 with a -8.69% revenue drop and negative profitability metrics, including a -3.93% net margin. Financial ratios reveal 57.14% unfavorable indicators, but debt levels remain low and liquidity ratios favorable. The overall rating is moderate (C+), with a slightly unfavorable MOAT due to ROIC below WACC despite improving profitability.
Onto Innovation Inc. (ONTO) posts strong income growth of 21.01% in 2024, with a favorable 20.43% net margin and mostly positive financial ratios, though some valuation multiples appear stretched. Debt is minimal with excellent liquidity. The company holds a moderate rating (B+) and a slightly unfavorable MOAT, reflecting ROIC below WACC but a solid upward trend in profitability.
Investors prioritizing growth and strong recent income performance might find Onto Innovation’s favorable income and liquidity profiles appealing, while those focused on risk management could consider GLOBALFOUNDRIES’ lower debt and stable financial ratios despite weaker profitability. The choice might depend on tolerance for valuation levels and preference between growth potential and financial stability.
Disclaimer: Investment carries a risk of loss of initial capital. The past performance is not a reliable indicator of future results. Be sure to understand risks before making an investment decision.
Go Further
I encourage you to read the complete analyses of GLOBALFOUNDRIES Inc. and Onto Innovation Inc. to enhance your investment decisions: