In the fast-evolving semiconductor industry, ON Semiconductor Corporation and GLOBALFOUNDRIES Inc. stand out as key players shaping the future of technology. Both companies serve critical roles in chip manufacturing and innovation, with overlapping markets in power solutions and wafer fabrication. This comparison explores their strategies and growth potential to help investors identify which company offers the most compelling opportunity in 2026. Let’s dive into a detailed analysis to guide your investment decision.

Table of contents
Companies Overview
I will begin the comparison between ON Semiconductor Corporation and GLOBALFOUNDRIES Inc. by providing an overview of these two companies and their main differences.
ON Semiconductor Corporation Overview
ON Semiconductor Corporation focuses on providing intelligent sensing and power solutions worldwide, with a strong emphasis on enabling electrification in the automotive industry. The company develops a wide range of semiconductor products, including analog, discrete, and integrated solutions that support power switching, signal conditioning, and voltage regulation. Headquartered in Scottsdale, AZ, ON operates through three segments and serves diverse end-markets, with a market cap of $24.7B as of 2026.
GLOBALFOUNDRIES Inc. Overview
GLOBALFOUNDRIES Inc. is a semiconductor foundry that manufactures integrated circuits used in electronic devices globally. Its product portfolio includes microprocessors, power management units, and various semiconductor devices, alongside wafer fabrication services. Based in Malta, NY, the company was founded in 2009 and went public in 2021. GLOBALFOUNDRIES employs 13K people and has a market cap of $23B in 2026, positioning it as a key player in semiconductor manufacturing.
Key similarities and differences
Both companies operate in the semiconductor industry and are listed on NASDAQ, with similar market capitalizations near $24B. ON Semiconductor emphasizes intelligent power and sensing solutions with diversified end-markets, while GLOBALFOUNDRIES specializes in foundry services and semiconductor manufacturing. ON’s business model involves product development across multiple segments, whereas GLOBALFOUNDRIES focuses primarily on wafer fabrication and integrated circuit manufacturing.
Income Statement Comparison
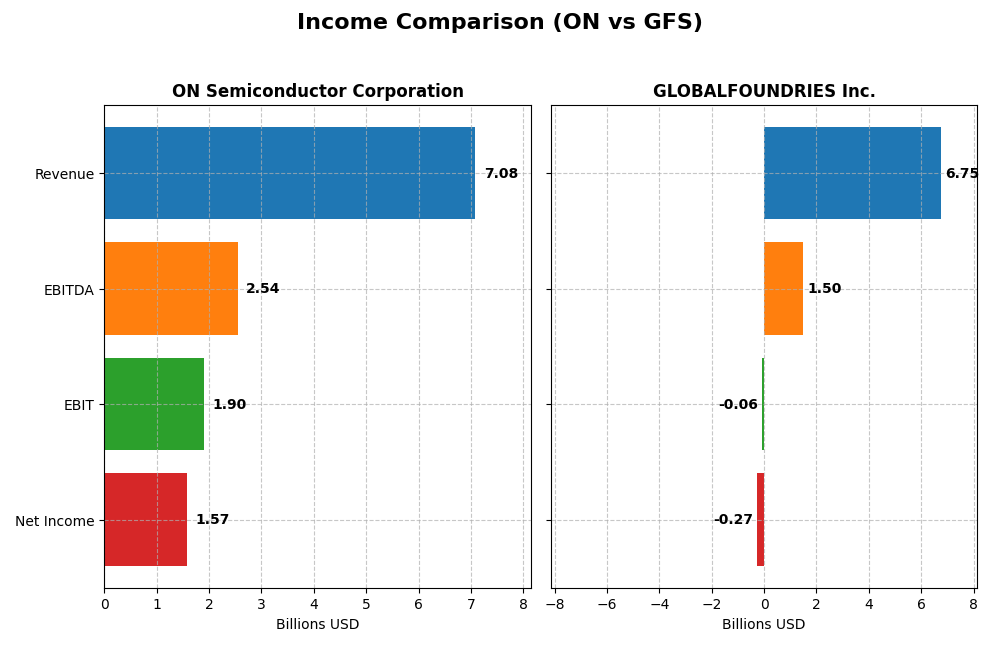
This table compares key income statement metrics for ON Semiconductor Corporation and GLOBALFOUNDRIES Inc. for the fiscal year 2024, presenting a clear snapshot of their financial performance.
| Metric | ON Semiconductor Corporation | GLOBALFOUNDRIES Inc. |
|---|---|---|
| Market Cap | 24.7B | 23.0B |
| Revenue | 7.08B | 6.75B |
| EBITDA | 2.54B | 1.50B |
| EBIT | 1.90B | -64M |
| Net Income | 1.57B | -265M |
| EPS | 3.68 | -0.48 |
| Fiscal Year | 2024 | 2024 |
Income Statement Interpretations
ON Semiconductor Corporation
ON Semiconductor has shown overall revenue growth of 34.77% and a net income increase of 571.56% from 2020 to 2024. Margins remain strong, with a 45.41% gross margin and a favorable 22.21% net margin in 2024. However, the most recent year saw a 14.19% revenue decline and a 16.07% net margin contraction, indicating short-term pressure despite solid long-term trends.
GLOBALFOUNDRIES Inc.
GLOBALFOUNDRIES reported a 39.15% revenue growth and an 80.37% net income increase over 2020-2024, but margins are mixed. The 2024 gross margin stands at 24.46%, yet the net margin is negative at -3.93%. The latest year reflected an 8.69% revenue decline and a sharper net margin drop of 128.45%, signaling operational challenges despite positive overall growth.
Which one has the stronger fundamentals?
ON Semiconductor exhibits stronger fundamentals with favorable gross, EBIT, and net margins and significant long-term net income growth. Despite recent declines, its profitability metrics outperform GLOBALFOUNDRIES, which faces negative EBIT and net margins in 2024. ON’s better margin stability and higher income growth suggest more robust income statement fundamentals.
Financial Ratios Comparison
The table below presents a side-by-side comparison of key financial ratios for ON Semiconductor Corporation and GLOBALFOUNDRIES Inc. based on the most recent fiscal year 2024 data.
| Ratios | ON Semiconductor Corporation | GLOBALFOUNDRIES Inc. |
|---|---|---|
| ROE | 17.9% | -2.5% |
| ROIC | 11.9% | -1.5% |
| P/E | 17.1 | -89.5 |
| P/B | 3.06 | 2.20 |
| Current Ratio | 5.06 | 2.11 |
| Quick Ratio | 3.38 | 1.57 |
| D/E (Debt-to-Equity) | 0.38 | 0.22 |
| Debt-to-Assets | 23.9% | 13.8% |
| Interest Coverage | 28.4 | -1.48 |
| Asset Turnover | 0.50 | 0.40 |
| Fixed Asset Turnover | 1.61 | 0.82 |
| Payout Ratio | 0 | 0 |
| Dividend Yield | 0 | 0 |
Interpretation of the Ratios
ON Semiconductor Corporation
ON Semiconductor shows generally strong financial ratios, with favorable net margin at 22.21% and return on equity at 17.88%, indicating profitable operations and efficient equity use. Its current ratio is high at 5.06, which is considered unfavorable, suggesting excess current assets. The company does not pay dividends, likely focusing on reinvestment and growth instead.
GLOBALFOUNDRIES Inc.
GLOBALFOUNDRIES presents weak profitability ratios, with a negative net margin of -3.93% and negative return on equity at -2.46%, reflecting operational challenges. However, liquidity and solvency ratios like current ratio at 2.11 and debt-to-equity at 0.22 are favorable. The company does not pay dividends, possibly prioritizing reinvestment or managing losses.
Which one has the best ratios?
ON Semiconductor has the better overall ratio profile, with half of its key ratios favorable and strong profitability metrics, despite a few weaknesses. GLOBALFOUNDRIES faces multiple unfavorable ratios, especially in profitability and interest coverage, outweighing its limited favorable liquidity and solvency metrics.
Strategic Positioning
This section compares the strategic positioning of ON Semiconductor Corporation and GLOBALFOUNDRIES Inc., focusing on market position, key segments, and exposure to technological disruption:
ON Semiconductor Corporation
- Positioned as a diversified semiconductor player with competitive pressure in power, sensing, and analog markets.
- Key segments include Power Solutions, Intelligent Sensing, and Analog Solutions driving diversified revenue streams.
- Moderate exposure to technological disruption through development of advanced sensing and power semiconductor technologies.
GLOBALFOUNDRIES Inc.
- Positioned as a foundry specialist facing competition in wafer fabrication and semiconductor manufacturing.
- Revenue mainly driven by wafer fabrication and engineering services, concentrated on foundry operations.
- Exposure to disruption primarily through wafer fabrication technologies and semiconductor device manufacturing.
ON Semiconductor Corporation vs GLOBALFOUNDRIES Inc. Positioning
ON Semiconductor has a diversified strategic approach across multiple semiconductor segments, providing varied revenue drivers. GLOBALFOUNDRIES focuses on foundry services with concentration in wafer fabrication. Diversification offers risk spread, while concentration may optimize operational focus.
Which has the best competitive advantage?
ON Semiconductor shows a slightly favorable moat with growing profitability, indicating improving competitive positioning. GLOBALFOUNDRIES displays a slightly unfavorable moat, shedding value despite improving ROIC trends, suggesting weaker competitive advantage.
Stock Comparison
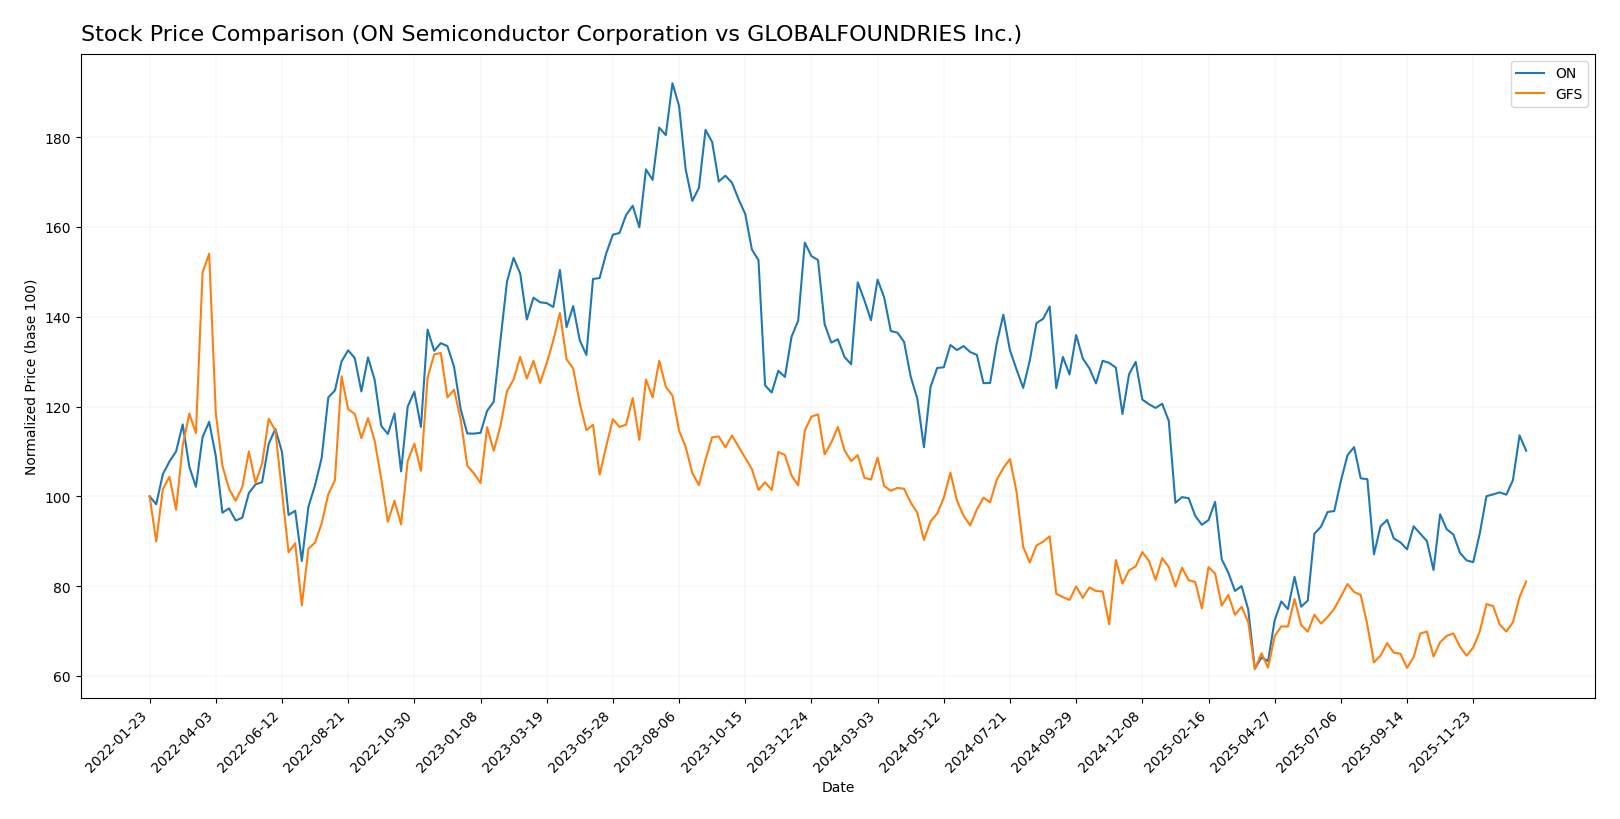
The stock prices of ON Semiconductor Corporation and GLOBALFOUNDRIES Inc. have experienced notable bearish trends over the past 12 months, with recent signs of recovery in the final quarter, marked by increased buyer activity and price upticks.
Trend Analysis
ON Semiconductor Corporation’s stock showed a bearish trend over the past year with a -20.88% price change and accelerating decline, hitting a low of 33.7; however, recent weeks reveal a 20.37% rebound with reduced volatility.
GLOBALFOUNDRIES Inc. also presented a bearish trend, declining -21.86% over 12 months with accelerating losses and moderate volatility; its recent trend shows a 16.66% gain but at a slower upward slope than ON.
Comparing both, ON Semiconductor outperformed GLOBALFOUNDRIES in recent market performance, delivering a higher price rebound in the last months despite deeper annual declines for both stocks.
Target Prices
The current analyst consensus provides a clear outlook on target prices for leading semiconductor companies ON Semiconductor Corporation and GLOBALFOUNDRIES Inc.
| Company | Target High | Target Low | Consensus |
|---|---|---|---|
| ON Semiconductor Corporation | 64 | 51 | 58.33 |
| GLOBALFOUNDRIES Inc. | 40 | 37 | 38.5 |
Analysts expect ON Semiconductor’s price to be slightly below its current price of 60.28 USD, indicating a modest correction or consolidation. GLOBALFOUNDRIES’ consensus target is below its current 41.53 USD price, suggesting potential downside or valuation adjustment.
Analyst Opinions Comparison
This section compares analysts’ ratings and grades for ON Semiconductor Corporation and GLOBALFOUNDRIES Inc.:
Rating Comparison
ON Semiconductor Corporation Rating
- Rating: B-, considered Very Favorable
- Discounted Cash Flow Score: 3, Moderate
- Return on Equity Score: 2, Moderate
- Return on Assets Score: 3, Moderate
- Debt To Equity Score: 2, Moderate
- Overall Score: 2, Moderate
GLOBALFOUNDRIES Inc. Rating
- Rating: C+, considered Very Favorable
- Discounted Cash Flow Score: 3, Moderate
- Return on Equity Score: 1, Very Unfavorable
- Return on Assets Score: 1, Very Unfavorable
- Debt To Equity Score: 3, Moderate
- Overall Score: 2, Moderate
Which one is the best rated?
Based strictly on the provided data, ON Semiconductor holds a better rating (B-) and stronger ROE and ROA scores compared to GLOBALFOUNDRIES’ lower scores in these areas, despite both sharing moderate overall and DCF scores.
Scores Comparison
Here is a comparison of the Altman Z-Score and Piotroski Score for ON Semiconductor Corporation and GLOBALFOUNDRIES Inc.:
ON Scores
- Altman Z-Score: 4.84, indicating a safe zone with low bankruptcy risk.
- Piotroski Score: 6, reflecting average financial strength.
GFS Scores
- Altman Z-Score: 2.61, placing the company in the grey zone with moderate bankruptcy risk.
- Piotroski Score: 6, reflecting average financial strength.
Which company has the best scores?
ON Semiconductor has a stronger Altman Z-Score, firmly in the safe zone, while GFS remains in the grey zone. Both companies share the same Piotroski Score, indicating similar average financial strength.
Grades Comparison
Here is a summary of the recent grades assigned to ON Semiconductor Corporation and GLOBALFOUNDRIES Inc.:
ON Semiconductor Corporation Grades
The table below shows recent grades from multiple reputable grading companies for ON Semiconductor Corporation:
| Grading Company | Action | New Grade | Date |
|---|---|---|---|
| Piper Sandler | Maintain | Overweight | 2026-01-07 |
| Truist Securities | Maintain | Hold | 2025-12-19 |
| Morgan Stanley | Maintain | Equal Weight | 2025-11-24 |
| Truist Securities | Maintain | Hold | 2025-11-04 |
| Baird | Maintain | Neutral | 2025-11-04 |
| Rosenblatt | Maintain | Neutral | 2025-11-04 |
| Morgan Stanley | Maintain | Equal Weight | 2025-11-04 |
| TD Cowen | Maintain | Buy | 2025-11-04 |
| UBS | Maintain | Neutral | 2025-10-27 |
| B of A Securities | Maintain | Neutral | 2025-09-05 |
ON Semiconductor’s grades predominantly reflect a neutral to moderately positive outlook, with no recent downgrades and several “Hold,” “Neutral,” and “Overweight” ratings.
GLOBALFOUNDRIES Inc. Grades
The following table presents recent grades from established grading firms for GLOBALFOUNDRIES Inc.:
| Grading Company | Action | New Grade | Date |
|---|---|---|---|
| Wedbush | Downgrade | Neutral | 2025-12-31 |
| B of A Securities | Maintain | Underperform | 2025-12-04 |
| Evercore ISI Group | Maintain | Outperform | 2025-11-13 |
| JP Morgan | Maintain | Neutral | 2025-11-13 |
| Citigroup | Maintain | Neutral | 2025-11-13 |
| Wedbush | Maintain | Outperform | 2025-11-13 |
| B of A Securities | Downgrade | Underperform | 2025-10-13 |
| Deutsche Bank | Maintain | Buy | 2025-08-06 |
| Morgan Stanley | Maintain | Equal Weight | 2025-08-06 |
| Wedbush | Maintain | Outperform | 2025-08-06 |
GLOBALFOUNDRIES exhibits mixed ratings, with some downgrades to “Neutral” and “Underperform” but also several “Outperform” and “Buy” ratings, indicating varied analyst perspectives.
Which company has the best grades?
ON Semiconductor Corporation has generally received more stable and moderately positive grades, mostly clustered around “Hold,” “Neutral,” and “Overweight,” whereas GLOBALFOUNDRIES shows more grade volatility with some downgrades and higher variability. This suggests ON may be perceived as a steadier option, potentially affecting investor confidence and risk tolerance differently between the two.
Strengths and Weaknesses
Below is a comparative overview of key strengths and weaknesses for ON Semiconductor Corporation (ON) and GLOBALFOUNDRIES Inc. (GFS) based on the most recent data available in 2026.
| Criterion | ON Semiconductor Corporation (ON) | GLOBALFOUNDRIES Inc. (GFS) |
|---|---|---|
| Diversification | Highly diversified product lines: Power Solutions (3.35B), Analog Solutions (2.61B), Intelligent Sensing (1.13B) in 2024 | Concentrated mainly in Water Fabrication (6.10B) and Engineering Services (652M) in 2024 |
| Profitability | Favorable net margin (22.21%), ROIC (11.88%) above WACC (10.17%), indicating slightly favorable profitability | Negative net margin (-3.93%), negative ROIC (-1.47%) below WACC (10.35%), indicating value destruction |
| Innovation | Growing ROIC trend (+156%), reflecting improving operational efficiency and innovation | Also showing growing ROIC trend (+90%), but still below WACC, indicating struggles to turn innovation into profits |
| Global presence | Strong multinational presence with broad market segments including automotive, industrial, and medical | Global footprint focused on semiconductor fabrication services, less diversified geographically |
| Market Share | Solid market share in power and analog semiconductor segments, benefiting from broad product portfolio | Significant player in foundry sector but market share impacted by profitability challenges |
Key takeaways: ON Semiconductor demonstrates a stronger and more balanced business model with diversified revenue streams and improving profitability. GLOBALFOUNDRIES, while growing operationally, faces challenges in profitability and market concentration, requiring cautious risk management for investors.
Risk Analysis
Below is a comparative table highlighting key risk factors for ON Semiconductor Corporation (ON) and GLOBALFOUNDRIES Inc. (GFS) based on their latest financial and operational data for 2024.
| Metric | ON Semiconductor Corporation (ON) | GLOBALFOUNDRIES Inc. (GFS) |
|---|---|---|
| Market Risk | High beta at 1.543, indicating greater volatility vs. market | Beta at 1.485, also above market average, moderate volatility |
| Debt level | Moderate debt-to-equity ratio of 0.38, favorable leverage | Lower debt-to-equity at 0.22, favorable but weaker interest coverage (-0.44) |
| Regulatory Risk | Moderate, with exposure to automotive electrification policies | Moderate, foundry sector faces export controls and tech regulations |
| Operational Risk | Exposure to supply chain disruptions; 26.4K employees suggest scale complexity | Smaller workforce (13K) but reliance on advanced manufacturing processes |
| Environmental Risk | Focus on sustainable energy solutions; potential regulatory benefits | Energy-intensive manufacturing may face stricter environmental scrutiny |
| Geopolitical Risk | US-based with global customer base; moderate exposure to trade tensions | US-based but with global supply chain; sensitive to export restrictions |
The most significant risks lie in market volatility and operational complexities for both companies. ON’s higher beta signals greater price swings, while GFS’s negative interest coverage and modest Altman Z-score in the grey zone raise caution about financial stability. Geopolitical factors, especially export controls impacting semiconductor manufacturing, remain critical considerations for GLOBALFOUNDRIES. Investors should weigh these risks alongside each company’s growth prospects and financial health.
Which Stock to Choose?
ON Semiconductor Corporation shows a favorable income statement with strong profitability and growing returns despite a recent revenue decline. Its financial ratios are slightly favorable, with low debt and solid interest coverage, supported by a very favorable rating and safe-zone Altman Z-Score.
GLOBALFOUNDRIES Inc. faces challenges with an unfavorable income statement marked by negative margins and declining profitability. Financial ratios are mostly unfavorable, though debt levels remain low. The company holds a slightly unfavorable moat status, a moderate rating, and a grey-zone Altman Z-Score.
Investors with a risk-tolerant or growth-oriented profile might view ON Semiconductor’s improving profitability and stable financial footing as appealing, while risk-averse investors focusing on capital preservation may perceive GLOBALFOUNDRIES’ current challenges and moderate rating as signals to monitor cautiously.
Disclaimer: Investment carries a risk of loss of initial capital. The past performance is not a reliable indicator of future results. Be sure to understand risks before making an investment decision.
Go Further
I encourage you to read the complete analyses of ON Semiconductor Corporation and GLOBALFOUNDRIES Inc. to enhance your investment decisions: