NVIDIA Corporation and GLOBALFOUNDRIES Inc. are two prominent players in the semiconductor industry, each carving a unique path in technology innovation. NVIDIA excels in graphics processing and AI computing, while GLOBALFOUNDRIES focuses on advanced semiconductor manufacturing. Their overlapping influence on tech infrastructure and future markets makes this comparison vital. Join me as we analyze which company offers the most compelling investment opportunity today.
Table of contents
Companies Overview
I will begin the comparison between NVIDIA Corporation and GLOBALFOUNDRIES Inc. by providing an overview of these two companies and their main differences.
NVIDIA Overview
NVIDIA Corporation, headquartered in Santa Clara, California, is a leading technology company specializing in graphics, compute, and networking solutions. Founded in 1993, NVIDIA offers products for gaming, professional visualization, datacenter, and automotive markets. Its portfolio includes GeForce GPUs, AI platforms, and autonomous vehicle solutions, serving diverse clients such as OEMs, cloud providers, and automotive manufacturers.
GLOBALFOUNDRIES Overview
GLOBALFOUNDRIES Inc., based in Malta, New York, operates as a semiconductor foundry focused on manufacturing integrated circuits worldwide. Since its establishment in 2009, the company provides wafer fabrication services and produces devices like microprocessors, RF modems, and power management units. It caters to a broad range of electronic applications, emphasizing mainstream semiconductor manufacturing technologies.
Key similarities and differences
Both companies operate in the semiconductor industry, with a technology focus and US headquarters. NVIDIA emphasizes design and development of GPUs and AI computing platforms, targeting end-user markets such as gaming and automotive. In contrast, GLOBALFOUNDRIES concentrates on manufacturing and fabrication services, producing semiconductor components for various electronic devices. Their business models differ between product innovation and foundry manufacturing.
Income Statement Comparison
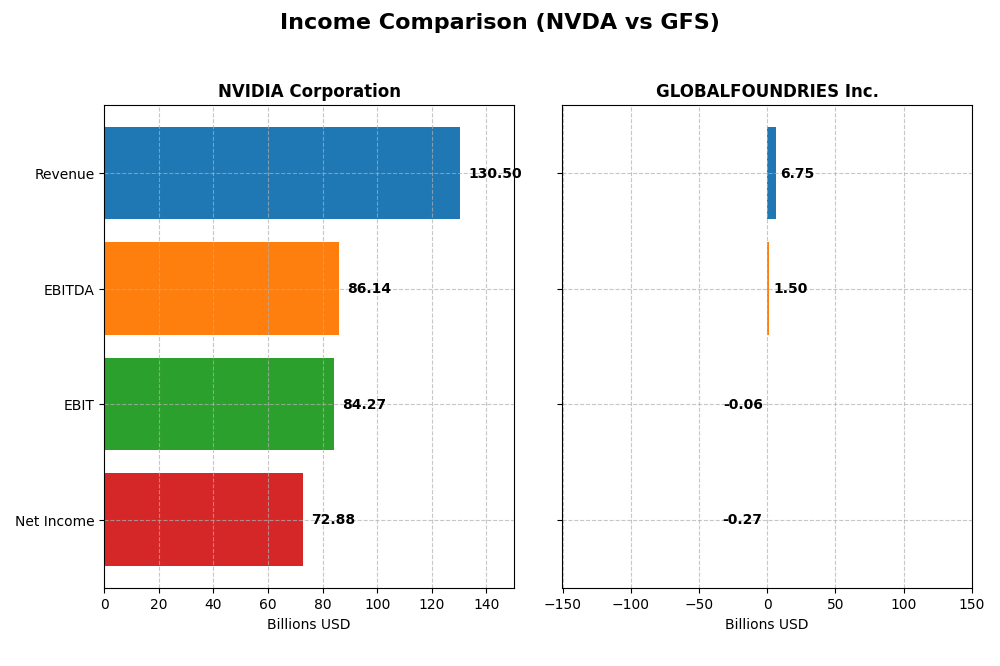
This table presents a side-by-side comparison of key income statement metrics for NVIDIA Corporation and GLOBALFOUNDRIES Inc. for their most recent fiscal years.
| Metric | NVIDIA Corporation | GLOBALFOUNDRIES Inc. |
|---|---|---|
| Market Cap | 4.46T | 22.9B |
| Revenue | 130.5B | 6.75B |
| EBITDA | 86.1B | 1.50B |
| EBIT | 84.3B | -64M |
| Net Income | 72.9B | -265M |
| EPS | 2.97 | -0.48 |
| Fiscal Year | 2025 | 2024 |
Income Statement Interpretations
NVIDIA Corporation
From 2021 to 2025, NVIDIA’s revenue surged from $16.7B to $130.5B, with net income growing impressively from $4.3B to $72.9B. Margins remained strong, with a gross margin near 75% and net margin improving to 55.85%. The latest year showed exceptional growth, with revenue and net income more than doubling, reflecting robust operational efficiency and margin expansion.
GLOBALFOUNDRIES Inc.
GLOBALFOUNDRIES experienced overall revenue growth from $4.9B in 2020 to $6.75B in 2024, but net income remained negative recently, with a loss of $265M in 2024. Gross margin held at a modest 24.46%, however, EBIT and net margins were negative, indicating ongoing profitability challenges. The latest year showed declining revenue and profit margins, signaling operational difficulties.
Which one has the stronger fundamentals?
NVIDIA demonstrates stronger fundamentals with consistent and significant revenue and net income growth, alongside high and improving margins. In contrast, GLOBALFOUNDRIES struggles with negative earnings and shrinking margins despite some revenue growth over the period. NVIDIA’s favorable income statement metrics outweigh the unfavorable trends seen at GLOBALFOUNDRIES.
Financial Ratios Comparison
The table below presents key financial ratios for NVIDIA Corporation and GLOBALFOUNDRIES Inc. for their most recent fiscal years, illustrating profitability, liquidity, valuation, leverage, and efficiency metrics.
| Ratios | NVIDIA Corporation (2025) | GLOBALFOUNDRIES Inc. (2024) |
|---|---|---|
| ROE | 91.9% | -2.46% |
| ROIC | 75.3% | -1.47% |
| P/E | 39.9 | -89.5 |
| P/B | 36.7 | 2.20 |
| Current Ratio | 4.44 | 2.11 |
| Quick Ratio | 3.88 | 1.57 |
| D/E (Debt-to-Equity) | 0.13 | 0.22 |
| Debt-to-Assets | 9.2% | 13.8% |
| Interest Coverage | 329.8 | -1.48 |
| Asset Turnover | 1.17 | 0.40 |
| Fixed Asset Turnover | 16.16 | 0.82 |
| Payout Ratio | 1.1% | 0% |
| Dividend Yield | 0.029% | 0% |
Interpretation of the Ratios
NVIDIA Corporation
NVIDIA shows a strong financial profile with favorable net margin (55.85%), ROE (91.87%), and ROIC (75.28%), indicating excellent profitability and capital efficiency. However, high valuation multiples such as a P/E of 39.9 and P/B of 36.66, plus an elevated current ratio of 4.44, raise some concerns. The company pays a modest dividend with a low yield of 0.03%, reflecting a cautious payout supported by strong free cash flow and moderate share repurchases.
GLOBALFOUNDRIES Inc.
GLOBALFOUNDRIES faces challenges with negative net margin (-3.93%), ROE (-2.46%), and ROIC (-1.47%), signaling unprofitable operations and weak returns. Favorable liquidity ratios like a current ratio of 2.11 contrast with poor interest coverage (-0.44) and low asset turnover (0.4). The company does not pay dividends, likely reflecting ongoing reinvestment and a growth or restructuring phase, with no significant share buyback activity noted.
Which one has the best ratios?
Based on the ratio evaluations, NVIDIA exhibits a predominantly favorable financial position with strong profitability and capital efficiency metrics despite some valuation concerns. In contrast, GLOBALFOUNDRIES shows mostly unfavorable profitability and efficiency ratios, alongside liquidity and coverage weaknesses. Therefore, NVIDIA has the more robust ratio profile as of the latest fiscal year data.
Strategic Positioning
This section compares the strategic positioning of NVIDIA Corporation and GLOBALFOUNDRIES Inc. in terms of market position, key segments, and exposure to technological disruption:
NVIDIA Corporation
- Leading semiconductor company with strong competitive pressure and global presence.
- Focuses on Data Center, Gaming, Automotive, and Professional Visualization segments.
- Exposed to disruption through advanced AI platforms, autonomous driving, and cloud.
GLOBALFOUNDRIES Inc.
- Smaller market cap foundry facing moderate competitive pressure worldwide.
- Concentrates on wafer fabrication and engineering prefabrication services.
- Faces disruption risks mainly in wafer fabrication technologies.
NVIDIA Corporation vs GLOBALFOUNDRIES Inc. Positioning
NVIDIA pursues a diversified strategy across multiple high-growth segments like AI and gaming, offering broad exposure but higher beta risk. GLOBALFOUNDRIES maintains a concentrated foundry focus, limiting diversification but specializing in semiconductor manufacturing services.
Which has the best competitive advantage?
NVIDIA shows a very favorable moat with high ROIC above WACC and growing profitability, indicating a durable competitive advantage. GLOBALFOUNDRIES has a slightly unfavorable moat due to negative ROIC versus WACC despite improving profitability.
Stock Comparison
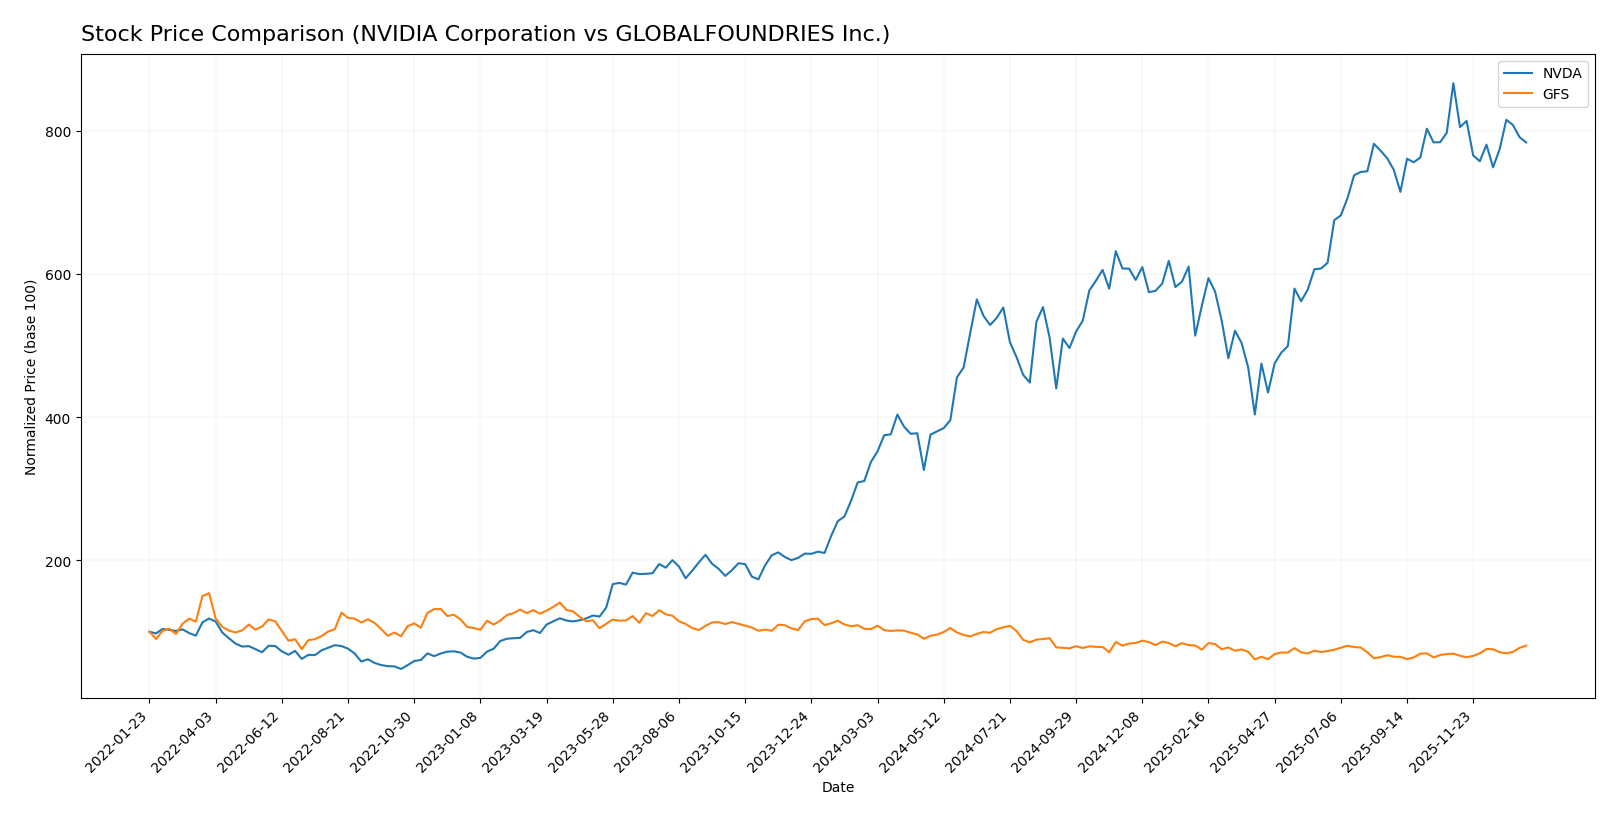
The past year saw NVIDIA Corporation’s stock soar by 132.35%, reflecting a strong bullish trend with decelerating momentum, while GLOBALFOUNDRIES Inc. experienced a 22.2% decline, indicating a bearish trend despite accelerating movement.
Trend Analysis
NVIDIA’s stock showed a robust 132.35% increase over the past 12 months, confirming a bullish trend with deceleration in price growth. The stock reached a high of 202.49 and a low of 76.2, with significant volatility (std deviation 32.46).
GLOBALFOUNDRIES’ stock declined by 22.2% over the same period, marking a bearish trend with accelerating loss. The price fluctuated between 31.54 and 55.66, exhibiting moderate volatility (std deviation 6.45).
Comparing the two, NVIDIA delivered the highest market performance with strong gains, whereas GLOBALFOUNDRIES showed a sustained downward trend despite recent short-term recovery.
Target Prices
The current analyst consensus presents a range of target prices reflecting diverse outlooks for these semiconductor companies.
| Company | Target High | Target Low | Consensus |
|---|---|---|---|
| NVIDIA Corporation | 352 | 140 | 264.34 |
| GLOBALFOUNDRIES Inc. | 40 | 37 | 38.5 |
Analysts expect NVIDIA’s stock to appreciate significantly above its current price of 183.14 USD, while GLOBALFOUNDRIES’ consensus target is slightly below its current price of 41.35 USD. This indicates stronger growth optimism for NVIDIA compared to GLOBALFOUNDRIES.
Analyst Opinions Comparison
This section compares analysts’ ratings and financial scores for NVIDIA Corporation and GLOBALFOUNDRIES Inc.:
Rating Comparison
NVIDIA Corporation Rating
- Rating: B+, indicating a very favorable overall assessment.
- Discounted Cash Flow Score: Moderate valuation with score of 3.
- ROE Score: Very favorable efficiency with top score of 5.
- ROA Score: Very favorable asset utilization at score of 5.
- Debt To Equity Score: Moderate financial risk, scoring 3.
- Overall Score: Moderate overall financial standing, scoring 3.
GLOBALFOUNDRIES Inc. Rating
- Rating: C+, reflecting a very favorable overall assessment.
- Discounted Cash Flow Score: Also moderate at 3.
- ROE Score: Very unfavorable, scoring only 1.
- ROA Score: Very unfavorable, with a score of 1.
- Debt To Equity Score: Moderate financial risk, also scoring 3.
- Overall Score: Moderate overall financial standing, scoring 2.
Which one is the best rated?
NVIDIA holds a better overall rating (B+) compared to GLOBALFOUNDRIES (C+). It notably outperforms in ROE and ROA scores, indicating stronger profitability and asset use, while both have similar DCF and debt-to-equity scores.
Scores Comparison
Here is a comparison of the Altman Z-Score and Piotroski Score for NVIDIA Corporation and GLOBALFOUNDRIES Inc.:
NVDA Scores
- Altman Z-Score: 68.04, indicating safe zone and very low bankruptcy risk.
- Piotroski Score: 6, showing average financial strength and investment quality.
GFS Scores
- Altman Z-Score: 2.61, indicating grey zone with moderate bankruptcy risk.
- Piotroski Score: 6, showing average financial strength and investment quality.
Which company has the best scores?
Based on the provided data, NVDA has a significantly higher Altman Z-Score, placing it in the safe zone, while GFS is in the grey zone. Both companies share the same average Piotroski Score of 6. NVDA’s scores suggest stronger financial stability compared to GFS.
Grades Comparison
Here is the grades comparison for NVIDIA Corporation and GLOBALFOUNDRIES Inc.:
NVIDIA Corporation Grades
The following table summarizes recent analyst grades for NVIDIA Corporation:
| Grading Company | Action | New Grade | Date |
|---|---|---|---|
| Mizuho | Maintain | Outperform | 2026-01-09 |
| Truist Securities | Maintain | Buy | 2025-12-29 |
| Stifel | Maintain | Buy | 2025-12-29 |
| B of A Securities | Maintain | Buy | 2025-12-26 |
| Baird | Maintain | Outperform | 2025-12-26 |
| Bernstein | Maintain | Outperform | 2025-12-26 |
| Truist Securities | Maintain | Buy | 2025-12-19 |
| Tigress Financial | Maintain | Strong Buy | 2025-12-18 |
| Morgan Stanley | Maintain | Overweight | 2025-12-01 |
| Deutsche Bank | Maintain | Hold | 2025-11-20 |
NVIDIA’s grades show a strong buy-side consensus, with multiple “Buy” and “Outperform” ratings and one “Strong Buy,” indicating broad analyst confidence.
GLOBALFOUNDRIES Inc. Grades
The following table summarizes recent analyst grades for GLOBALFOUNDRIES Inc.:
| Grading Company | Action | New Grade | Date |
|---|---|---|---|
| Wedbush | Downgrade | Neutral | 2025-12-31 |
| B of A Securities | Maintain | Underperform | 2025-12-04 |
| Evercore ISI Group | Maintain | Outperform | 2025-11-13 |
| JP Morgan | Maintain | Neutral | 2025-11-13 |
| Citigroup | Maintain | Neutral | 2025-11-13 |
| Wedbush | Maintain | Outperform | 2025-11-13 |
| B of A Securities | Downgrade | Underperform | 2025-10-13 |
| Deutsche Bank | Maintain | Buy | 2025-08-06 |
| Morgan Stanley | Maintain | Equal Weight | 2025-08-06 |
| Wedbush | Maintain | Outperform | 2025-08-06 |
GLOBALFOUNDRIES shows a mixed rating trend with several downgrades to Neutral and Underperform, tempered by some Outperform and Buy ratings, reflecting analyst caution.
Which company has the best grades?
NVIDIA Corporation has generally received more favorable and consistent grades, predominantly “Buy” and “Outperform,” compared to GLOBALFOUNDRIES which exhibits mixed ratings and several downgrades. This difference may influence investors’ perception of relative growth prospects and risk profiles.
Strengths and Weaknesses
Below is a comparative overview of key strengths and weaknesses for NVIDIA Corporation (NVDA) and GLOBALFOUNDRIES Inc. (GFS) based on the most recent financial and operational data.
| Criterion | NVIDIA Corporation (NVDA) | GLOBALFOUNDRIES Inc. (GFS) |
|---|---|---|
| Diversification | Highly diversified across Data Center (115B), Gaming (11.35B), Automotive (1.7B), and Professional Visualization segments | Less diversified; primarily focused on Water Fabrication (6.1B) and Engineering Services (652M) |
| Profitability | Very high net margin (55.85%), ROIC (75.28%), ROE (91.87%) | Negative net margin (-3.93%), ROIC (-1.47%), and ROE (-2.46%) indicating loss-making status |
| Innovation | Strong innovation with growing ROIC (+339%), maintaining durable competitive advantage | Improving ROIC trend (+90%), but still value-destructive with slightly unfavorable moat |
| Global presence | Strong global presence supported by leading data center and gaming markets | Moderate global footprint, mainly in semiconductor fabrication services |
| Market Share | Leading market share in GPUs and AI chips, dominant in data center segment | Smaller market share, niche in fabrication services with limited scale compared to NVDA |
In summary, NVIDIA exhibits robust profitability, strong diversification, and a durable competitive moat, making it a value-creating market leader. GLOBALFOUNDRIES shows improving profitability trends but remains unprofitable and less diversified, signaling higher investment risk.
Risk Analysis
Below is a comparison of key risks for NVIDIA Corporation (NVDA) and GLOBALFOUNDRIES Inc. (GFS) based on the most recent data available.
| Metric | NVIDIA Corporation (NVDA) | GLOBALFOUNDRIES Inc. (GFS) |
|---|---|---|
| Market Risk | High beta (2.31) indicates strong volatility sensitivity | Moderate beta (1.49), less volatile than NVDA |
| Debt level | Low debt-to-equity (0.13), favorable leverage | Moderate debt-to-equity (0.22), manageable but higher risk |
| Regulatory Risk | Moderate, with global exposure to US-China trade tensions | Moderate, with semiconductor industry regulations impacting operations |
| Operational Risk | Advanced tech dependency, high innovation pace | Manufacturing complexity and capacity constraints |
| Environmental Risk | Moderate, semiconductor production impact under scrutiny | Moderate, similar industry environmental challenges |
| Geopolitical Risk | High, given exposure to China and Taiwan markets | High, with global supply chain and geopolitical tensions |
The most impactful risks are NVIDIA’s market volatility and geopolitical exposure, particularly in Asia, which could affect supply chains and sales. GLOBALFOUNDRIES faces operational and financial challenges reflected by weaker profitability and being in the “grey zone” for bankruptcy risk, suggesting higher caution. Both companies are exposed to semiconductor industry regulatory and environmental pressures but manage debt well enough to mitigate financial distress risks.
Which Stock to Choose?
NVIDIA Corporation (NVDA) shows a strong income evolution with a 114.2% revenue growth in one year and a 682.6% increase over five years. Its profitability is high, with a 55.85% net margin and excellent returns on equity (91.87%) and invested capital (75.28%). The company maintains low debt levels and a very favorable credit rating of B+, supported by a very favorable moat indicating durable competitive advantage and growing ROIC.
GLOBALFOUNDRIES Inc. (GFS) displays weaker income performance, with a negative 8.69% revenue growth in the last year but a 39.15% increase over five years. Profitability is challenged, reflected in a -3.93% net margin and negative returns on equity (-2.46%) and invested capital (-1.47%). Debt remains moderate, and the rating is a moderate C+ with an unfavorable overall income statement and a slightly unfavorable moat, though ROIC is improving.
For investors prioritizing growth and strong profitability, NVDA’s very favorable rating and durable competitive advantage may appear more attractive. Conversely, investors with a tolerance for risk who seek potential turnaround opportunities might view GFS’s improving ROIC and moderate rating as a sign of possible recovery, despite current weaknesses.
Disclaimer: Investment carries a risk of loss of initial capital. The past performance is not a reliable indicator of future results. Be sure to understand risks before making an investment decision.
Go Further
I encourage you to read the complete analyses of NVIDIA Corporation and GLOBALFOUNDRIES Inc. to enhance your investment decisions: