Home > Comparison > Technology > GFS vs NVEC
The strategic rivalry between GLOBALFOUNDRIES Inc. and NVE Corporation shapes the semiconductor industry’s future. GLOBALFOUNDRIES operates as a capital-intensive foundry with broad wafer fabrication capabilities. In contrast, NVE Corporation focuses on niche spintronic sensor technology with a lean operational model. This analysis pits scale and manufacturing breadth against specialized innovation. I will determine which trajectory offers a superior risk-adjusted profile for a diversified technology portfolio.
Table of contents
Companies Overview
GLOBALFOUNDRIES and NVE Corporation shape critical niches in the semiconductor industry, influencing technology’s backbone globally.
GLOBALFOUNDRIES Inc.: Leading Semiconductor Foundry
GLOBALFOUNDRIES operates as a major semiconductor foundry, fabricating integrated circuits essential to diverse electronics. It generates revenue by manufacturing microprocessors, baseband processors, and power management units, among others. In 2026, it focuses strategically on mainstream wafer fabrication and advancing its technology to meet broad market demands.
NVE Corporation: Spintronics Innovator
NVE Corporation pioneers in spintronics-based sensors and couplers, specializing in data acquisition and transmission devices. Its revenue stems from supplying factory automation and medical device markets with magnetic and metallic detection products. The 2026 strategy emphasizes expanding spintronic solutions for industrial IoT and licensing cutting-edge memory technology.
Strategic Collision: Similarities & Divergences
Both firms operate in semiconductors but diverge sharply: GLOBALFOUNDRIES pursues a broad manufacturing model, while NVE hones a niche in spintronics innovation. Their primary competition lies in embedding advanced technologies into evolving electronics ecosystems. This contrast defines their unique investment profiles—GLOBALFOUNDRIES with scale and diversification, NVE with specialized tech leadership.
Income Statement Comparison
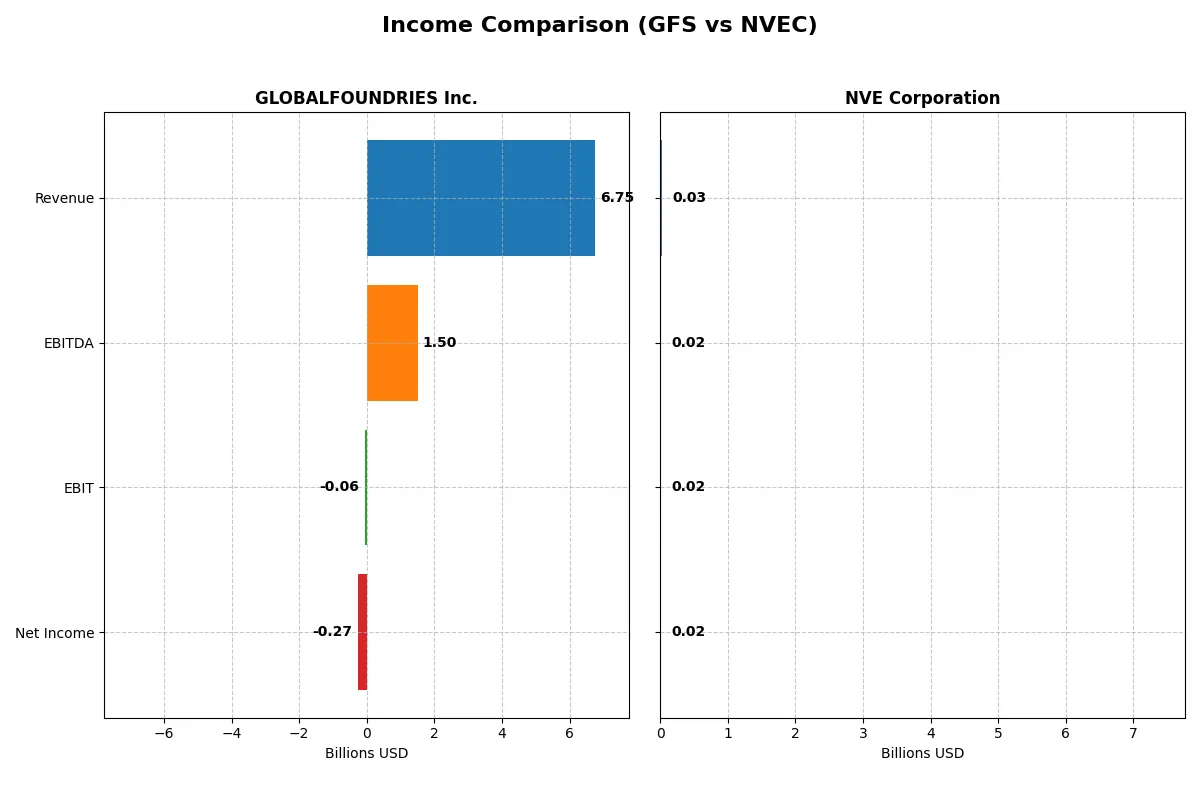
This data dissects the core profitability and scalability of both corporate engines to reveal who dominates the bottom line:
| Metric | GLOBALFOUNDRIES Inc. (GFS) | NVE Corporation (NVEC) |
|---|---|---|
| Revenue | 6.75B | 25.9M |
| Cost of Revenue | 5.10B | 4.24M |
| Operating Expenses | 1.87B | 5.64M |
| Gross Profit | 1.65B | 21.6M |
| EBITDA | 1.50B | 16.3M |
| EBIT | -64M | 16.0M |
| Interest Expense | 145M | 0 |
| Net Income | -265M | 15.1M |
| EPS | -0.48 | 3.12 |
| Fiscal Year | 2024 | 2025 |
Income Statement Analysis: The Bottom-Line Duel
The following income statement comparison reveals the true efficiency and profitability of each company’s operational engine over recent years.
GLOBALFOUNDRIES Inc. Analysis
GLOBALFOUNDRIES saw revenues peak at 8.1B in 2022 before declining to 6.75B in 2024. Net income followed a similar trajectory, swinging from a 1.45B profit in 2022 to a 265M loss in 2024. Gross margins remain moderate at 24.5%, but negative EBIT and net margins in 2024 highlight operational struggles and deteriorating profitability momentum.
NVE Corporation Analysis
NVE Corporation maintains strong revenue growth, reaching nearly 26M in 2025 despite a recent 13% drop from 2024. Net income remains robust at 15M with a stellar net margin above 58%. Its consistent high gross and EBIT margins above 60% demonstrate exceptional operational efficiency and sustained profitability momentum, despite minor recent growth setbacks.
Margin Dominance vs. Scale Pressure
NVE Corporation clearly outperforms GLOBALFOUNDRIES on margin strength and consistent profitability. While GLOBALFOUNDRIES struggles with shrinking revenue and negative net income, NVE’s high margins and positive net income growth underline superior efficiency. For investors prioritizing financial stability and margin power, NVE’s profile is more compelling.
Financial Ratios Comparison
These vital ratios act as a diagnostic tool to expose the underlying fiscal health, valuation premiums, and capital efficiency of the companies analyzed:
| Ratios | GLOBALFOUNDRIES Inc. (GFS) | NVE Corporation (NVEC) |
|---|---|---|
| ROE | -2.46% (2024) | 24.19% (2025) |
| ROIC | -1.47% (2024) | 21.14% (2025) |
| P/E | -89.54 (2024) | 20.46 (2025) |
| P/B | 2.20 (2024) | 4.95 (2025) |
| Current Ratio | 2.11 (2024) | 28.40 (2025) |
| Quick Ratio | 1.57 (2024) | 22.03 (2025) |
| D/E (Debt-to-Equity) | 0.22 (2024) | 0.01 (2025) |
| Debt-to-Assets | 13.81% (2024) | 1.43% (2025) |
| Interest Coverage | -1.48 (2024) | 0 (2025) |
| Asset Turnover | 0.40 (2024) | 0.40 (2025) |
| Fixed Asset Turnover | 0.82 (2024) | 8.91 (2025) |
| Payout ratio | 0% (2024) | 128% (2025) |
| Dividend yield | 0% (2024) | 6.28% (2025) |
| Fiscal Year | 2024 | 2025 |
Efficiency & Valuation Duel: The Vital Signs
Financial ratios act as a company’s DNA, revealing hidden risks and operational strengths essential for investment analysis.
GLOBALFOUNDRIES Inc.
GLOBALFOUNDRIES shows negative profitability with ROE at -2.46% and unfavorable margins, signaling operational struggles. Its P/E is negative, indicating losses but a favorable valuation metric. The company carries no dividends, focusing on reinvestment, notably in R&D, which consumes 7.35% of revenue, aiming for future growth despite current inefficiencies.
NVE Corporation
NVE Corporation delivers robust profitability with a 24.19% ROE and strong margins at 58.22%. Its P/E of 20.46 suggests a fair valuation amid high growth expectations. NVEC returns cash through a 6.28% dividend yield while maintaining excellent capital efficiency and low debt, reflecting disciplined capital allocation and solid shareholder returns.
Operational Struggles vs. Strong Profitability
NVEC’s strong returns, disciplined capital structure, and shareholder payouts offer a healthier risk-reward balance than GLOBALFOUNDRIES, which faces profitability and operational challenges. Investors preferring operational safety and steady income may lean toward NVEC’s profile, while those betting on turnaround potential might watch GLOBALFOUNDRIES closely.
Which one offers the Superior Shareholder Reward?
GLOBALFOUNDRIES (GFS) does not pay dividends and shows no buyback activity, focusing its cash flow on reinvestment and capex, with a free cash flow per share of $1.98 in 2024. In contrast, NVE Corporation (NVEC) delivers a robust 4.5–6.3% dividend yield with payout ratios slightly above 100%, signaling aggressive shareholder returns. NVEC’s buyback activity is not explicitly stated but its cash flow coverage ratios imply strong free cash flow generation ($2.7/share) supporting dividends sustainably. I find NVEC’s yield and consistent free cash flow coverage more attractive for total return investors in 2026. Its distribution model balances rewarding shareholders and maintaining growth, whereas GFS’s lack of payouts and volatile margins raise sustainability concerns. Therefore, I prefer NVEC for superior shareholder reward this year.
Comparative Score Analysis: The Strategic Profile
The radar chart reveals the fundamental DNA and trade-offs of GLOBALFOUNDRIES Inc. and NVE Corporation, highlighting their core financial strengths and valuation traits:
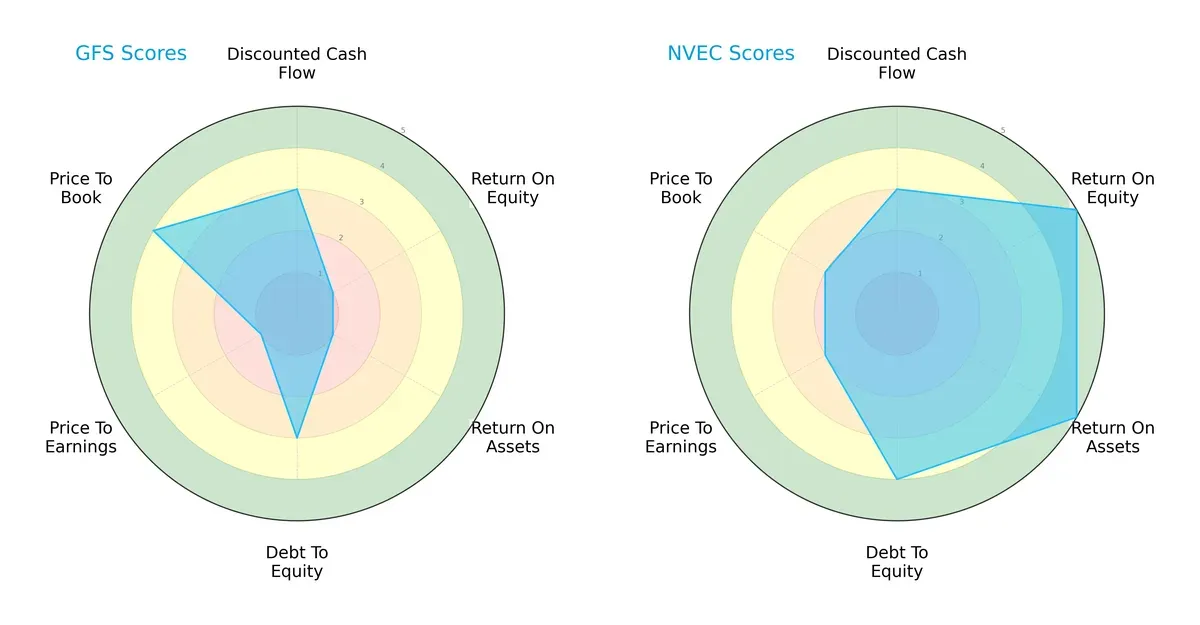
NVE leads with superior profitability scores, boasting a very favorable ROE and ROA of 5 each, compared to GLOBALFOUNDRIES’ very unfavorable 1 scores. GLOBALFOUNDRIES shows strength in valuation with a high P/B score of 4 but struggles with poor earnings efficiency and P/E at 1. NVE delivers a more balanced profile with moderate DCF and debt management, while GLOBALFOUNDRIES relies heavily on favorable book value metrics.
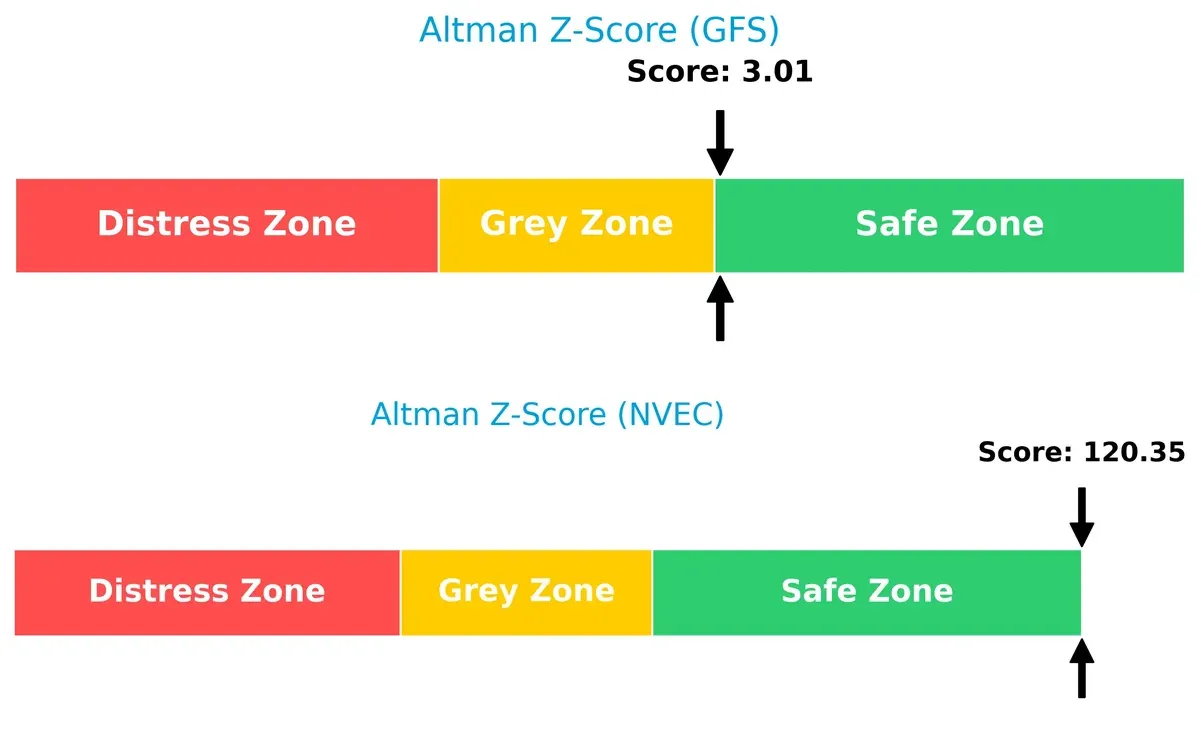
Bankruptcy Risk: Solvency Showdown
NVE’s Altman Z-Score of 120.35 vastly outperforms GLOBALFOUNDRIES’ 3.01, placing both in the safe zone but signaling NVE’s exceptional long-term solvency and resilience in volatile cycles:
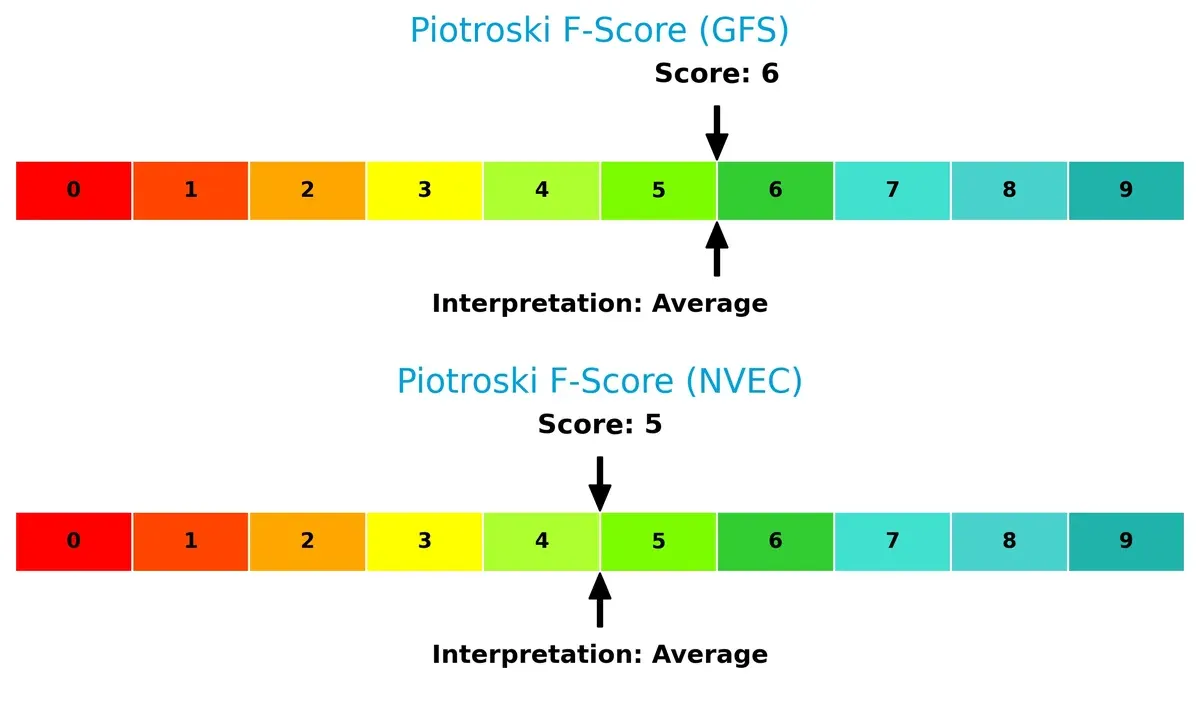
Financial Health: Quality of Operations
GLOBALFOUNDRIES and NVE both show average Piotroski F-Scores of 6 and 5, respectively, indicating stable but not peak operational health. Neither firm presents immediate red flags, though GLOBALFOUNDRIES edges slightly ahead:
How are the two companies positioned?
This section dissects the operational DNA of GFS and NVEC by comparing their revenue distribution and internal dynamics. The ultimate goal is to confront their economic moats and reveal which model offers the most resilient competitive advantage today.
Revenue Segmentation: The Strategic Mix
This visual comparison dissects how GLOBALFOUNDRIES Inc. and NVE Corporation diversify their income streams and where their primary sector bets lie:
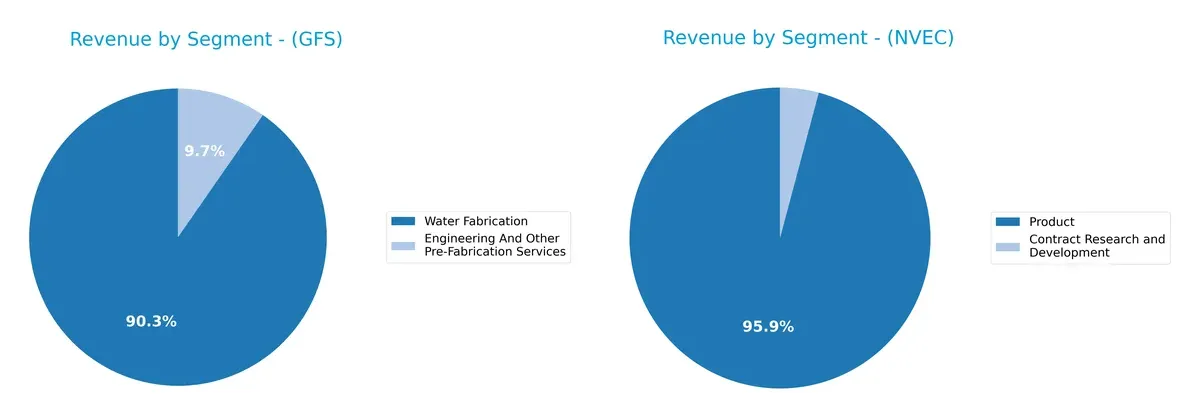
GLOBALFOUNDRIES anchors its revenues in Water Fabrication, generating $6.1B in 2024, dwarfing its $652M Engineering Services. NVE leans heavily on Product sales with $25.9M, while Contract R&D remains marginal at $1.1M. GLOBALFOUNDRIES shows sector concentration risk but commands infrastructure dominance. NVE’s narrower scope pivots on product innovation, exposing it to market cyclicality but benefiting from focused R&D leverage.
Strengths and Weaknesses Comparison
This table compares the Strengths and Weaknesses of GLOBALFOUNDRIES Inc. (GFS) and NVE Corporation (NVEC):
GFS Strengths
- Diverse revenue streams from engineering services and water fabrication
- Strong presence in the US, Europe, and other regions
- Favorable liquidity with current ratio 2.11 and low debt-to-assets 13.81%
NVEC Strengths
- High profitability with net margin 58.22% and ROIC 21.14%
- Exceptional fixed asset turnover at 8.91
- Low debt and strong interest coverage with infinite ratio
- Global sales exposure including US, Europe, Asia Pacific
GFS Weaknesses
- Negative profitability metrics: net margin -3.93%, ROE -2.46%, ROIC -1.47%
- Unfavorable interest coverage at -0.44
- Low asset turnover 0.4 and fixed asset turnover 0.82
- No dividend yield
NVEC Weaknesses
- Extremely high current ratio 28.4, potentially inefficient asset use
- Unfavorable price-to-book at 4.95
- Asset turnover 0.4 below industry norms
Overall, GFS exhibits solid diversification and healthy liquidity but struggles with profitability and asset efficiency. NVEC excels in profitability and capital efficiency yet shows potential overcapitalization with a very high current ratio. Both companies face distinct operational challenges shaping their strategic focus.
The Moat Duel: Analyzing Competitive Defensibility
A structural moat is the fortress shielding long-term profits from ruthless competition erosion. Here’s how GLOBALFOUNDRIES and NVE Corporation stack up:
GLOBALFOUNDRIES Inc.: Scale and Manufacturing Expertise Moat
GLOBALFOUNDRIES leverages a cost advantage moat through large-scale semiconductor fabrication. Despite a current negative ROIC vs. WACC, its improving profitability hints at potential moat strengthening via new tech investments in 2026.
NVE Corporation: Innovation-Driven Spintronics Moat
NVE’s moat stems from intangible assets and specialization in spintronic technology. It commands high ROIC well above WACC, showcasing efficient capital use and a robust profit engine, with promising expansion into industrial IoT markets ahead.
Verdict: Cost Scale vs. Technological Specialization
NVE’s innovation moat is deeper and more durable, with consistent value creation and margin dominance. GLOBALFOUNDRIES shows promise but currently sheds value, making NVE better positioned to defend its market share in 2026.
Which stock offers better returns?
Both GLOBALFOUNDRIES Inc. and NVE Corporation experienced significant price declines over the past year, with recent months showing a notable but uneven recovery in trading dynamics.
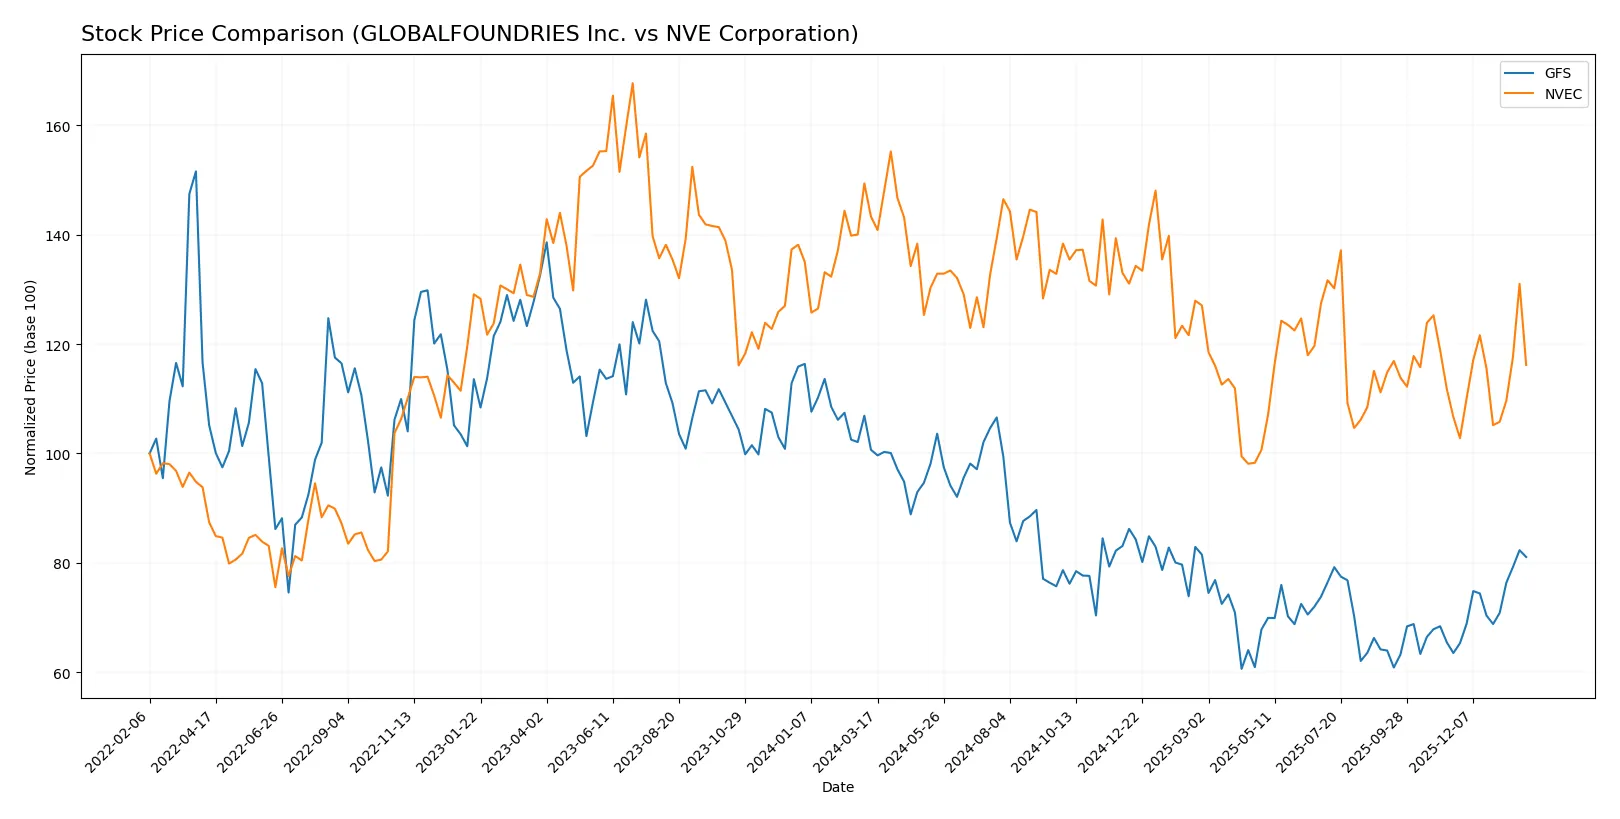
Trend Comparison
GLOBALFOUNDRIES Inc. shows a bearish trend over 12 months with a -19.48% price change, accelerating downwards despite a strong recent rebound of +27.69%. Volatility remains moderate with a 6.18 std deviation.
NVE Corporation also exhibits a bearish 12-month trend at -18.93%, accelerating down. Its recent recovery is milder at +8.94%, with higher volatility reflected by a 7.6 std deviation.
Comparing both, GLOBALFOUNDRIES had a sharper decline but a stronger recent recovery than NVE. GLOBALFOUNDRIES delivered the highest short-term market performance despite the longer-term bearish trend.
Target Prices
Analysts provide a cautious target consensus for GLOBALFOUNDRIES Inc., reflecting tempered optimism.
| Company | Target Low | Target High | Consensus |
|---|---|---|---|
| GLOBALFOUNDRIES Inc. | 37 | 40 | 38.5 |
The target consensus for GLOBALFOUNDRIES stands below its current price of 42.2, signaling potential downside risk. No verified target price data is available for NVE Corporation.

Don’t Let Luck Decide Your Entry Point
Optimize your entry points with our advanced ProRealTime indicators. You’ll get efficient buy signals with precise price targets for maximum performance. Start outperforming now!
How do institutions grade them?
The following summarizes the latest institutional grades assigned to these companies:
GLOBALFOUNDRIES Inc. Grades
This table lists recent grades and recommendations from established financial institutions.
| Grading Company | Action | New Grade | Date |
|---|---|---|---|
| Citigroup | Maintain | Neutral | 2026-01-15 |
| Wedbush | Downgrade | Neutral | 2025-12-31 |
| B of A Securities | Maintain | Underperform | 2025-12-04 |
| Citigroup | Maintain | Neutral | 2025-11-13 |
| Evercore ISI Group | Maintain | Outperform | 2025-11-13 |
| JP Morgan | Maintain | Neutral | 2025-11-13 |
| Wedbush | Maintain | Outperform | 2025-11-13 |
| B of A Securities | Downgrade | Underperform | 2025-10-13 |
| Wedbush | Maintain | Outperform | 2025-08-06 |
| Morgan Stanley | Maintain | Equal Weight | 2025-08-06 |
Which company has the best grades?
GLOBALFOUNDRIES Inc. has multiple recent grades from reputable firms, mainly neutral or outperform, with some downgrades to underperform. NVE Corporation has no available institutional grades. Investors may view GLOBALFOUNDRIES’s mixed grades as a signal to monitor closely for risks and opportunities.
Risks specific to each company
The following categories identify critical pressure points and systemic threats facing GLOBALFOUNDRIES Inc. and NVE Corporation in the competitive and regulatory environment of 2026:
1. Market & Competition
GLOBALFOUNDRIES Inc.
- Faces intense competition in mainstream semiconductor foundry; negative margins indicate pricing pressure.
NVE Corporation
- Operates in niche spintronics market with strong margins but limited scale and market breadth.
2. Capital Structure & Debt
GLOBALFOUNDRIES Inc.
- Maintains moderate leverage (D/E 0.22) with some interest coverage concerns (negative coverage).
NVE Corporation
- Extremely low leverage (D/E 0.01) and strong interest coverage reduce financial risk significantly.
3. Stock Volatility
GLOBALFOUNDRIES Inc.
- Higher beta (1.485) suggests elevated stock price volatility relative to market.
NVE Corporation
- Lower beta (1.196) indicates more stable price movements compared to GFS.
4. Regulatory & Legal
GLOBALFOUNDRIES Inc.
- Subject to complex semiconductor export controls and IP litigation risk.
NVE Corporation
- Faces regulatory scrutiny mainly in medical device compliance and IoT-related standards.
5. Supply Chain & Operations
GLOBALFOUNDRIES Inc.
- Large-scale manufacturing exposes it to global supply chain disruptions and raw material price swings.
NVE Corporation
- Smaller scale with specialized components; supply risk exists but is more manageable.
6. ESG & Climate Transition
GLOBALFOUNDRIES Inc.
- High energy consumption and emissions require significant investment to meet climate targets.
NVE Corporation
- Smaller footprint enables easier transition but may face scrutiny on resource sourcing.
7. Geopolitical Exposure
GLOBALFOUNDRIES Inc.
- Global operations expose it to US-China tensions and export restrictions impacting sales and supply.
NVE Corporation
- Primarily US-based with less direct exposure but indirect effects through global IoT deployment.
Which company shows a better risk-adjusted profile?
NVE Corporation’s low leverage, strong profitability, and niche market focus create a more resilient risk profile. GLOBALFOUNDRIES struggles with negative profitability and interest coverage, raising financial stability concerns. Recent data shows GFS’s negative interest coverage and unfavorable profitability ratios, signaling heightened risk. Conversely, NVEC’s robust net margin (58.2%) and Altman Z-score (>120) affirm its sound financial health. Thus, NVEC offers a superior risk-adjusted investment opportunity under current market conditions.
Final Verdict: Which stock to choose?
GLOBALFOUNDRIES Inc. (GFS) stands out for its significant asset base and improving profitability trajectory, hinting at a potential turnaround. Its key vulnerability lies in value destruction with a ROIC below WACC, demanding close monitoring. GFS might suit investors seeking cyclical exposure with a tolerance for operational risks.
NVE Corporation (NVEC) boasts a clear strategic moat, illustrated by its robust ROIC exceeding WACC and strong cash flow generation. Its remarkably low leverage and high profitability offer a safety cushion compared to GFS. NVEC aligns well with portfolios focused on durable growth and quality earnings.
If you prioritize stable value creation and financial strength, NVEC is the compelling choice due to its consistent economic moat and superior returns. However, if you seek potential rebound plays with cyclical upside, GFS offers a scenario worth watching despite its fundamental challenges. Both profiles require vigilance given sector volatility.
Disclaimer: Investment carries a risk of loss of initial capital. The past performance is not a reliable indicator of future results. Be sure to understand risks before making an investment decision.
Go Further
I encourage you to read the complete analyses of GLOBALFOUNDRIES Inc. and NVE Corporation to enhance your investment decisions: