In the rapidly evolving semiconductor industry, GLOBALFOUNDRIES Inc. (GFS) and Nova Ltd. (NVMI) stand out as key players driving innovation and technological progress. While GLOBALFOUNDRIES focuses on large-scale integrated circuit manufacturing, Nova specializes in precision process control systems essential for chip production. This article compares their market positions and strategies to help you identify which company offers the most compelling investment opportunity today.

Table of contents
Companies Overview
I will begin the comparison between GLOBALFOUNDRIES Inc. and Nova Ltd. by providing an overview of these two companies and their main differences.
GLOBALFOUNDRIES Inc. Overview
GLOBALFOUNDRIES Inc. operates as a global semiconductor foundry, manufacturing integrated circuits that power various electronic devices. Its product range includes microprocessors, mobile application processors, network processors, and power management units among others. Founded in 2009 and based in Malta, New York, the company positions itself as a key player in wafer fabrication services and semiconductor technology innovation.
Nova Ltd. Overview
Nova Ltd. specializes in designing and producing process control systems for semiconductor manufacturing, serving customers worldwide including in Israel, Taiwan, and the US. Its metrology platforms support several manufacturing steps such as lithography and chemical mechanical planarization. Incorporated in 1993 and headquartered in Rehovot, Israel, Nova caters to logic, foundries, and memory manufacturers, focusing on precision measurement technology.
Key similarities and differences
Both GLOBALFOUNDRIES and Nova operate within the semiconductor industry but focus on different segments. GLOBALFOUNDRIES primarily manufactures semiconductor devices and offers wafer fabrication services, while Nova provides process control and metrology systems essential for semiconductor manufacturing. GLOBALFOUNDRIES has a larger workforce and market cap, reflecting its broader manufacturing scope compared to Nova’s specialized technology solutions.
Income Statement Comparison
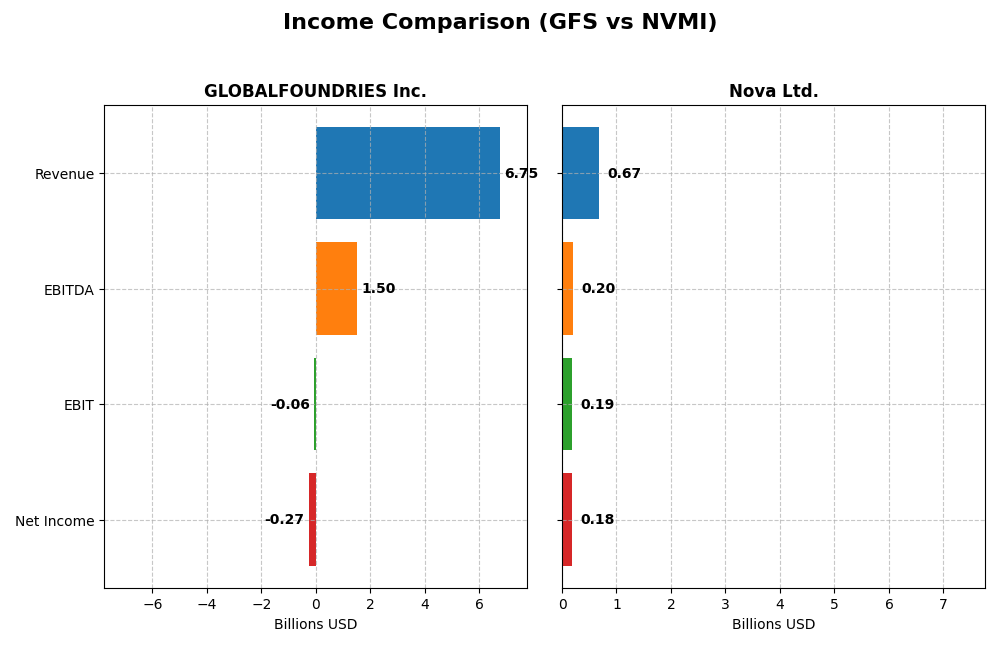
Below is a side-by-side comparison of the key income statement metrics for GLOBALFOUNDRIES Inc. and Nova Ltd. for the fiscal year 2024.
| Metric | GLOBALFOUNDRIES Inc. (GFS) | Nova Ltd. (NVMI) |
|---|---|---|
| Market Cap | 23B | 13B |
| Revenue | 6.75B | 672M |
| EBITDA | 1.50B | 205M |
| EBIT | -64M | 188M |
| Net Income | -265M | 184.9M |
| EPS | -0.48 | 6.31 |
| Fiscal Year | 2024 | 2024 |
Income Statement Interpretations
GLOBALFOUNDRIES Inc.
GLOBALFOUNDRIES showed overall revenue growth of 39.15% from 2020 to 2024, with net income increasing by 80.37%. However, its gross margin remained modest at 24.46%, and recent performance in 2024 deteriorated with an 8.69% revenue decline and a negative net margin of -3.93%. The EBIT margin turned unfavorable, reflecting operational challenges.
Nova Ltd.
Nova Ltd. experienced strong revenue growth of 149.59% over the 2020-2024 period, with net income surging 283.58%. Its gross margin is robust at 57.57%, and in 2024, revenue grew 29.83% alongside a net margin of 27.33%. EBIT margin improved by 20.23%, indicating solid operating profitability and margin expansion.
Which one has the stronger fundamentals?
Nova Ltd. demonstrates stronger fundamentals with high and improving margins, significant revenue and net income growth, and a favorable income statement evaluation overall. GLOBALFOUNDRIES, despite growth over the longer term, faces margin compression and recent declines in profitability, reflected in an unfavorable global income statement opinion.
Financial Ratios Comparison
Below is a comparison of key financial ratios for GLOBALFOUNDRIES Inc. (GFS) and Nova Ltd. (NVMI) based on their most recent fiscal year, 2024.
| Ratios | GLOBALFOUNDRIES Inc. (GFS) | Nova Ltd. (NVMI) |
|---|---|---|
| ROE | -2.46% | 19.81% |
| ROIC | -1.47% | 13.39% |
| P/E | -89.54 | 31.20 |
| P/B | 2.20 | 6.18 |
| Current Ratio | 2.11 | 2.32 |
| Quick Ratio | 1.57 | 1.92 |
| D/E (Debt to Equity) | 0.22 | 0.25 |
| Debt-to-Assets | 13.8% | 17.0% |
| Interest Coverage | -1.48 | 116.20 |
| Asset Turnover | 0.40 | 0.48 |
| Fixed Asset Turnover | 0.82 | 5.06 |
| Payout Ratio | 0 | 0 |
| Dividend Yield | 0 | 0 |
Interpretation of the Ratios
GLOBALFOUNDRIES Inc.
GLOBALFOUNDRIES shows several unfavorable profitability ratios, including a negative net margin of -3.93% and negative returns on equity and invested capital, indicating operational challenges. However, liquidity ratios like a current ratio of 2.11 and low debt levels are favorable. The company does not pay dividends, reflecting a possible reinvestment or growth strategy, as no payouts or buybacks are reported.
Nova Ltd.
Nova Ltd. displays strong profitability with a 27.33% net margin and 19.81% return on equity, supported by a favorable interest coverage ratio of 116.2. Liquidity remains robust with a current ratio of 2.32, though valuation multiples like P/E and P/B are high and less favorable. Nova Ltd. also does not pay dividends, likely prioritizing reinvestment or R&D given its sector focus.
Which one has the best ratios?
Comparing both, Nova Ltd. presents a more favorable overall ratio profile with stronger profitability and coverage ratios. GLOBALFOUNDRIES’ ratios are predominantly unfavorable, especially in profitability and efficiency, despite solid liquidity and leverage metrics. Therefore, Nova Ltd. holds the advantage in this ratios comparison based on the provided data.
Strategic Positioning
This section compares the strategic positioning of GLOBALFOUNDRIES Inc. and Nova Ltd., including market position, key segments, and exposure to technological disruption:
GLOBALFOUNDRIES Inc.
- Large market cap of 23B USD with significant competitive pressure in semiconductor foundry services.
- Key segments include wafer fabrication (6.1B USD) and engineering/pre-fabrication services (652M USD) driving revenue.
- Exposure to technological disruption through semiconductor manufacturing innovations affecting integrated circuit production.
Nova Ltd.
- Smaller market cap of 13B USD focused on niche process control systems amid competitive semiconductor industry.
- Revenue driven solely by process control product sales totaling 538M USD, serving multiple semiconductor manufacturing steps.
- Faces technological disruption risks related to evolving metrology and process control technologies in semiconductor fabrication.
GLOBALFOUNDRIES Inc. vs Nova Ltd. Positioning
GLOBALFOUNDRIES operates a diversified foundry business with large-scale fabrication services, while Nova Ltd. concentrates on specialized metrology products. GLOBALFOUNDRIES benefits from scale but faces broad industry competition; Nova focuses on niche technological solutions with a smaller workforce.
Which has the best competitive advantage?
GLOBALFOUNDRIES shows a slightly unfavorable moat, shedding value despite rising ROIC, indicating weak competitive advantage. Nova Ltd. has a slightly favorable moat with growing ROIC, suggesting improving profitability but not yet a strong moat.
Stock Comparison
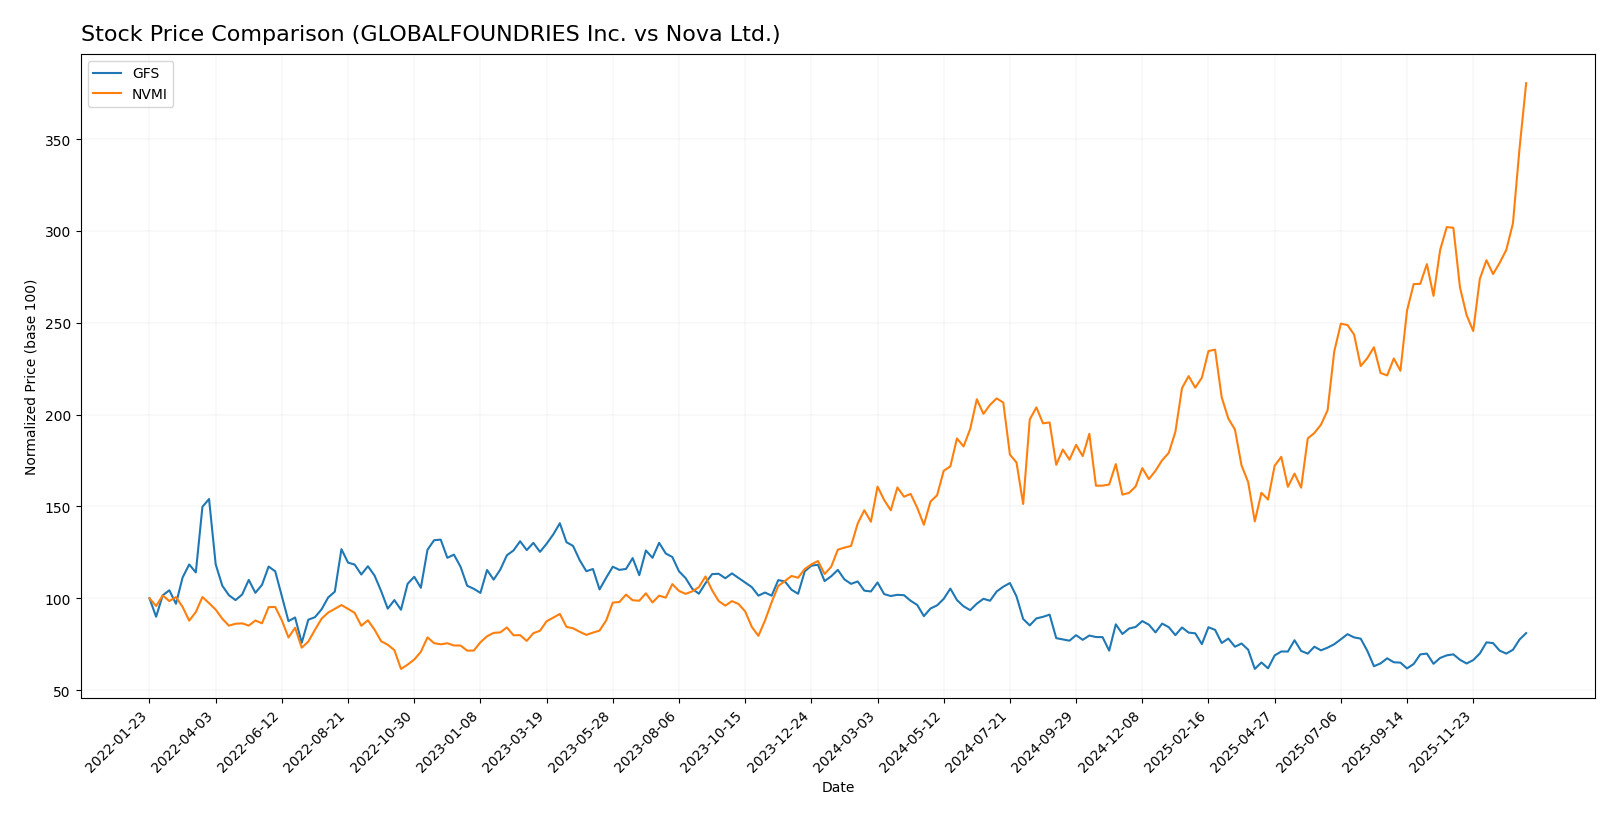
The stock price movements of GLOBALFOUNDRIES Inc. and Nova Ltd. over the past 12 months reveal contrasting trading dynamics, with GLOBALFOUNDRIES showing a notable decline and Nova Ltd. experiencing strong gains and acceleration in price appreciation.
Trend Analysis
GLOBALFOUNDRIES Inc. (GFS) exhibited a bearish trend over the past year with a price decline of 21.86%, accompanied by accelerating downside momentum and moderate volatility (std deviation 6.45). The stock’s highest and lowest prices ranged from 55.66 to 31.54.
Nova Ltd. (NVMI) demonstrated a bullish trend with a 168.54% price increase over the same period, supported by accelerating upward momentum and high volatility (std deviation 55.86). The stock traded between 159.92 and 434.55.
Comparing both, Nova Ltd. delivered the highest market performance with a substantially stronger price increase and acceleration, while GLOBALFOUNDRIES faced a significant bearish correction.
Target Prices
The current analyst consensus presents clear target price ranges for GLOBALFOUNDRIES Inc. and Nova Ltd.
| Company | Target High | Target Low | Consensus |
|---|---|---|---|
| GLOBALFOUNDRIES Inc. | 40 | 37 | 38.5 |
| Nova Ltd. | 390 | 335 | 362.5 |
Analysts expect GLOBALFOUNDRIES shares to trade slightly below the current price of $41.53, indicating cautious optimism. Nova Ltd.’s consensus target at $362.5 is substantially lower than its current price of $434.55, suggesting potential downside risk.
Analyst Opinions Comparison
This section compares analysts’ ratings and grades for GLOBALFOUNDRIES Inc. (GFS) and Nova Ltd. (NVMI):
Rating Comparison
GFS Rating
- Rating: C+ with a very favorable status.
- Discounted Cash Flow Score: 3, moderate.
- ROE Score: 1, very unfavorable.
- ROA Score: 1, very unfavorable.
- Debt To Equity Score: 3, moderate.
- Overall Score: 2, moderate.
NVMI Rating
- Rating: B- with a very favorable status.
- Discounted Cash Flow Score: 3, moderate.
- ROE Score: 4, favorable.
- ROA Score: 5, very favorable.
- Debt To Equity Score: 1, very unfavorable.
- Overall Score: 3, moderate.
Which one is the best rated?
Based strictly on the provided data, NVMI has a higher rating (B- vs. C+) and superior scores in ROE and ROA. However, GFS has a better debt-to-equity score. Overall, NVMI is better rated in most financial performance metrics.
Scores Comparison
The comparison of GLOBALFOUNDRIES Inc. (GFS) and Nova Ltd. (NVMI) scores is as follows:
GFS Scores
- Altman Z-Score: 2.6, placing it in the grey zone, indicating moderate bankruptcy risk.
- Piotroski Score: 6, categorized as average financial strength.
NVMI Scores
- Altman Z-Score: 7.8, in the safe zone, indicating low bankruptcy risk.
- Piotroski Score: 7, categorized as strong financial strength.
Which company has the best scores?
Based strictly on the provided data, NVMI outperforms GFS with a significantly higher Altman Z-Score in the safe zone and a stronger Piotroski Score, indicating better financial stability and strength.
Grades Comparison
Here is a comparison of recent grades assigned to GLOBALFOUNDRIES Inc. and Nova Ltd.:
GLOBALFOUNDRIES Inc. Grades
The latest grading updates and actions from various firms for GLOBALFOUNDRIES Inc. are shown below:
| Grading Company | Action | New Grade | Date |
|---|---|---|---|
| Wedbush | Downgrade | Neutral | 2025-12-31 |
| B of A Securities | Maintain | Underperform | 2025-12-04 |
| Evercore ISI Group | Maintain | Outperform | 2025-11-13 |
| JP Morgan | Maintain | Neutral | 2025-11-13 |
| Citigroup | Maintain | Neutral | 2025-11-13 |
| Wedbush | Maintain | Outperform | 2025-11-13 |
| B of A Securities | Downgrade | Underperform | 2025-10-13 |
| Deutsche Bank | Maintain | Buy | 2025-08-06 |
| Morgan Stanley | Maintain | Equal Weight | 2025-08-06 |
| Wedbush | Maintain | Outperform | 2025-08-06 |
The grades for GLOBALFOUNDRIES show a mixed trend with recent downgrades to Neutral and Underperform, although some firms maintain Outperform and Buy ratings.
Nova Ltd. Grades
Below is the summary of recent grades and rating actions for Nova Ltd.:
| Grading Company | Action | New Grade | Date |
|---|---|---|---|
| B of A Securities | Maintain | Buy | 2026-01-13 |
| Jefferies | Maintain | Buy | 2025-12-15 |
| Evercore ISI Group | Maintain | Outperform | 2025-11-07 |
| Benchmark | Maintain | Buy | 2025-11-07 |
| Cantor Fitzgerald | Maintain | Overweight | 2025-06-24 |
| B of A Securities | Maintain | Buy | 2025-06-24 |
| Benchmark | Maintain | Buy | 2025-05-09 |
| Citigroup | Maintain | Buy | 2025-05-09 |
| B of A Securities | Maintain | Buy | 2025-04-16 |
| Cantor Fitzgerald | Maintain | Overweight | 2025-03-14 |
Nova Ltd.’s grades consistently reflect a strong Buy and Outperform consensus with no recent downgrades.
Which company has the best grades?
Nova Ltd. holds the better grades overall, with a consistent pattern of Buy and Outperform ratings from multiple reputable firms. GLOBALFOUNDRIES Inc. shows more varied ratings and some recent downgrades, which may indicate greater uncertainty or risk perception among analysts. This difference could influence investor sentiment and portfolio weighting decisions.
Strengths and Weaknesses
The table below compares key strengths and weaknesses of GLOBALFOUNDRIES Inc. (GFS) and Nova Ltd. (NVMI) based on recent financial and operational data.
| Criterion | GLOBALFOUNDRIES Inc. (GFS) | Nova Ltd. (NVMI) |
|---|---|---|
| Diversification | Moderately diversified: Engineering services and water fabrication, with water fabrication dominating revenue (~6.1B USD in 2024) | Less diversified: single product line with 538M USD revenue in 2024 |
| Profitability | Unfavorable profitability: negative net margin (-3.93%) and negative ROIC (-1.47%) | Favorable profitability: strong net margin (27.33%) and ROIC (13.39%) |
| Innovation | Moderate innovation: improving ROIC trend but still value-destroying overall | Growing profitability suggests innovation and efficient capital use |
| Global presence | Large scale with multi-billion revenue but struggling with value creation | Smaller scale but efficiently managed with favorable financial ratios |
| Market Share | Large revenue base but negative returns indicate competitive pressure | Smaller revenue but positive growth and strong financial health |
Key takeaways: GLOBALFOUNDRIES shows significant scale but struggles with profitability and value creation despite improving ROIC. Nova Ltd. demonstrates strong profitability and efficient capital use, though with a narrower product base. Investors should weigh growth potential against current profitability challenges.
Risk Analysis
Below is a comparative table summarizing key risk factors for GLOBALFOUNDRIES Inc. (GFS) and Nova Ltd. (NVMI) based on the most recent data for 2024-2026:
| Metric | GLOBALFOUNDRIES Inc. (GFS) | Nova Ltd. (NVMI) |
|---|---|---|
| Market Risk | High beta 1.485; volatile semiconductor sector | Higher beta 1.832; highly cyclical industry exposure |
| Debt level | Low debt-to-equity 0.22; favorable leverage | Moderate debt-to-equity 0.25; manageable but higher risk |
| Regulatory Risk | Moderate; US tech regulations, export controls | Elevated; operates in Israel with geopolitical tensions |
| Operational Risk | Medium; large scale manufacturing complexity | Medium; specialized process controls, sensitive to tech shifts |
| Environmental Risk | Moderate; semiconductor manufacturing impact | Moderate; industry-standard environmental compliance |
| Geopolitical Risk | Low to moderate; US-based but global supply chains | High; Israeli base with regional geopolitical instability |
In synthesis, Nova Ltd. carries the highest geopolitical risk due to its location, which could impact operations and supply chains. GLOBALFOUNDRIES faces significant market risk from semiconductor volatility and unfavorable profitability metrics, despite healthier debt levels. Both companies have moderate operational and environmental risks typical for their industry. Caution is advised particularly with Nova’s geopolitical exposure and GFS’s negative profitability and coverage ratios, which could affect financial stability.
Which Stock to Choose?
GLOBALFOUNDRIES Inc. (GFS) shows a mixed income evolution with recent unfavorable net margin and declining revenue growth, despite positive overall period growth. Its financial ratios are mostly unfavorable, with negative profitability and low debt levels. The rating is moderate (C+), signaling caution.
Nova Ltd. (NVMI) displays strong income growth, favorable margins, and high profitability. Financial ratios are generally favorable, though some valuation metrics are high. Its rating is better (B-), supported by solid returns and growing profitability despite higher debt concerns.
Investors seeking growth and profitability might find NVMI more appealing given its favorable rating and robust income statement. Conversely, those cautious about valuation and financial stability could interpret GFS’s mixed signals as a sign to monitor further developments before deciding.
Disclaimer: Investment carries a risk of loss of initial capital. The past performance is not a reliable indicator of future results. Be sure to understand risks before making an investment decision.
Go Further
I encourage you to read the complete analyses of GLOBALFOUNDRIES Inc. and Nova Ltd. to enhance your investment decisions: