In the fast-evolving semiconductor industry, Monolithic Power Systems, Inc. (MPWR) and GLOBALFOUNDRIES Inc. (GFS) stand out as key players with distinct approaches. MPWR specializes in power electronics solutions, while GFS focuses on semiconductor manufacturing and wafer fabrication. Their overlapping markets and innovation strategies make them compelling options for investors seeking exposure to technology growth. This article will help you identify which company suits your portfolio best.
Table of contents
Companies Overview
I will begin the comparison between Monolithic Power Systems and GLOBALFOUNDRIES by providing an overview of these two companies and their main differences.
Monolithic Power Systems Overview
Monolithic Power Systems, Inc. focuses on designing and marketing semiconductor-based power electronics solutions, serving markets such as computing, automotive, and industrial sectors. The company specializes in DC to DC integrated circuits and lighting control ICs for various electronic systems. Headquartered in Kirkland, Washington, it operates globally, selling products through distributors and directly to manufacturers.
GLOBALFOUNDRIES Overview
GLOBALFOUNDRIES Inc. operates as a worldwide semiconductor foundry, manufacturing integrated circuits for diverse electronic applications. Its product portfolio includes microprocessors, RF modems, and power management units, alongside wafer fabrication services. Founded in 2009 and based in Malta, New York, GLOBALFOUNDRIES employs a larger workforce and focuses on enabling electronic devices across various industries.
Key similarities and differences
Both companies operate within the semiconductor industry and trade on NASDAQ, yet their business models differ. Monolithic Power Systems emphasizes power electronics ICs and controls, targeting specific electronic components and end markets. In contrast, GLOBALFOUNDRIES provides broad semiconductor manufacturing and foundry services, producing a wide range of integrated circuits. Workforce size and market capitalization also highlight their scale differences.
Income Statement Comparison
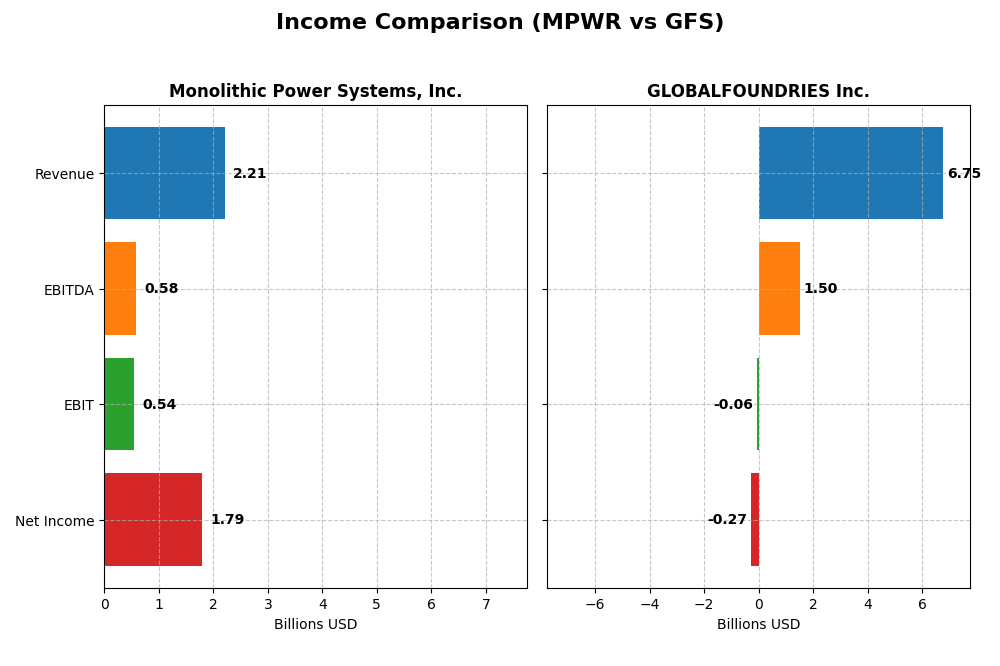
This table compares key income statement metrics for Monolithic Power Systems, Inc. and GLOBALFOUNDRIES Inc. for the fiscal year 2024.
| Metric | Monolithic Power Systems, Inc. | GLOBALFOUNDRIES Inc. |
|---|---|---|
| Market Cap | 48.4B | 23.0B |
| Revenue | 2.21B | 6.75B |
| EBITDA | 576M | 1.50B |
| EBIT | 539M | -64M |
| Net Income | 1.79B | -265M |
| EPS | 36.76 | -0.48 |
| Fiscal Year | 2024 | 2024 |
Income Statement Interpretations
Monolithic Power Systems, Inc.
Monolithic Power Systems showed strong revenue growth from 2020 to 2024, increasing from $844M to $2.21B, with net income surging from $164M to $1.79B. Margins improved significantly, with a gross margin of 55.32% and a net margin of 80.95% in 2024. The latest year saw revenue growth accelerate by 21.2%, while net margin expanded substantially, reflecting strong operational leverage.
GLOBALFOUNDRIES Inc.
GLOBALFOUNDRIES experienced revenue growth overall, rising from $4.85B in 2020 to $6.75B in 2024, but net income remained volatile, ending with a loss of $265M in 2024 versus a $1.02B profit in 2023. Gross margin held at 24.46%, but EBIT and net margins were negative in 2024, indicating operating challenges and margin compression. The recent year showed declines in revenue, gross profit, and earnings.
Which one has the stronger fundamentals?
Monolithic Power Systems presents stronger fundamentals with consistently favorable margin profiles, significant net income growth, and positive earnings momentum in 2024. In contrast, GLOBALFOUNDRIES shows margin pressure, negative profitability in the latest year, and unfavorable short-term income trends, despite overall growth since 2020. The financial trajectory favors Monolithic Power Systems in terms of income statement strength.
Financial Ratios Comparison
The table below presents a side-by-side comparison of key financial ratios for Monolithic Power Systems, Inc. (MPWR) and GLOBALFOUNDRIES Inc. (GFS) for the fiscal year 2024, highlighting their profitability, liquidity, leverage, efficiency, and dividend metrics.
| Ratios | Monolithic Power Systems, Inc. (MPWR) | GLOBALFOUNDRIES Inc. (GFS) |
|---|---|---|
| ROE | 56.8% | -2.5% |
| ROIC | 16.2% | -1.5% |
| P/E | 16.1 | -89.5 |
| P/B | 9.14 | 2.20 |
| Current Ratio | 5.31 | 2.11 |
| Quick Ratio | 3.89 | 1.57 |
| D/E (Debt-to-Equity) | 0.005 | 0.215 |
| Debt-to-Assets | 0.44% | 13.8% |
| Interest Coverage | 0 (no reported coverage) | -1.48 (negative coverage) |
| Asset Turnover | 0.61 | 0.40 |
| Fixed Asset Turnover | 4.17 | 0.82 |
| Payout Ratio | 13.5% | 0% |
| Dividend Yield | 0.84% | 0% |
Interpretation of the Ratios
Monolithic Power Systems, Inc.
Monolithic Power Systems exhibits mostly favorable financial ratios, with strong net margin at 80.95% and return on equity of 56.8%, indicating efficient profitability and shareholder value creation. However, its high price-to-book ratio of 9.14 and elevated current ratio of 5.31 are less favorable, suggesting possible overvaluation and excess liquidity. The company pays dividends, but the 0.84% yield is low, with cautious attention needed on payout sustainability.
GLOBALFOUNDRIES Inc.
GLOBALFOUNDRIES shows predominantly unfavorable ratios, including negative net margin at -3.93% and return on equity at -2.46%, reflecting operational and profitability challenges. Despite a solid current ratio of 2.11, asset turnover is weak at 0.4, signaling efficiency concerns. The company does not pay dividends, likely due to ongoing reinvestment and operational losses, prioritizing growth and capacity expansion over shareholder payouts.
Which one has the best ratios?
Based on the evaluations, Monolithic Power Systems holds a more favorable ratio profile with superior profitability metrics and financial stability. GLOBALFOUNDRIES faces significant profitability and operational hurdles, reflected in mostly unfavorable ratios. Thus, Monolithic Power Systems demonstrates stronger financial health relative to its peer in this comparison.
Strategic Positioning
This section compares the strategic positioning of MPWR and GFS, including market position, key segments, and exposure to technological disruption:
MPWR
- Larger market cap near $48.4B; faces competitive pressure in semiconductor power electronics.
- Focuses on DC to DC products and lighting control ICs driving revenue in multiple electronics markets.
- Faces technological disruption risks in integrated circuit innovation within power electronics.
GFS
- Smaller market cap about $23.0B; competes in semiconductor wafer fabrication globally.
- Relies mainly on wafer fabrication and engineering pre-fabrication services as key revenue drivers.
- Exposed to disruption through evolving wafer fabrication technologies and semiconductor manufacturing.
MPWR vs GFS Positioning
MPWR pursues a diversified product portfolio in power electronics across several end markets, while GFS concentrates on semiconductor manufacturing and wafer fabrication services, presenting distinct strategic advantages and operational focuses.
Which has the best competitive advantage?
MPWR demonstrates a very favorable moat with value creation and a growing ROIC, indicating a durable competitive advantage. GFS shows slightly unfavorable moat status due to value destruction despite improving profitability.
Stock Comparison
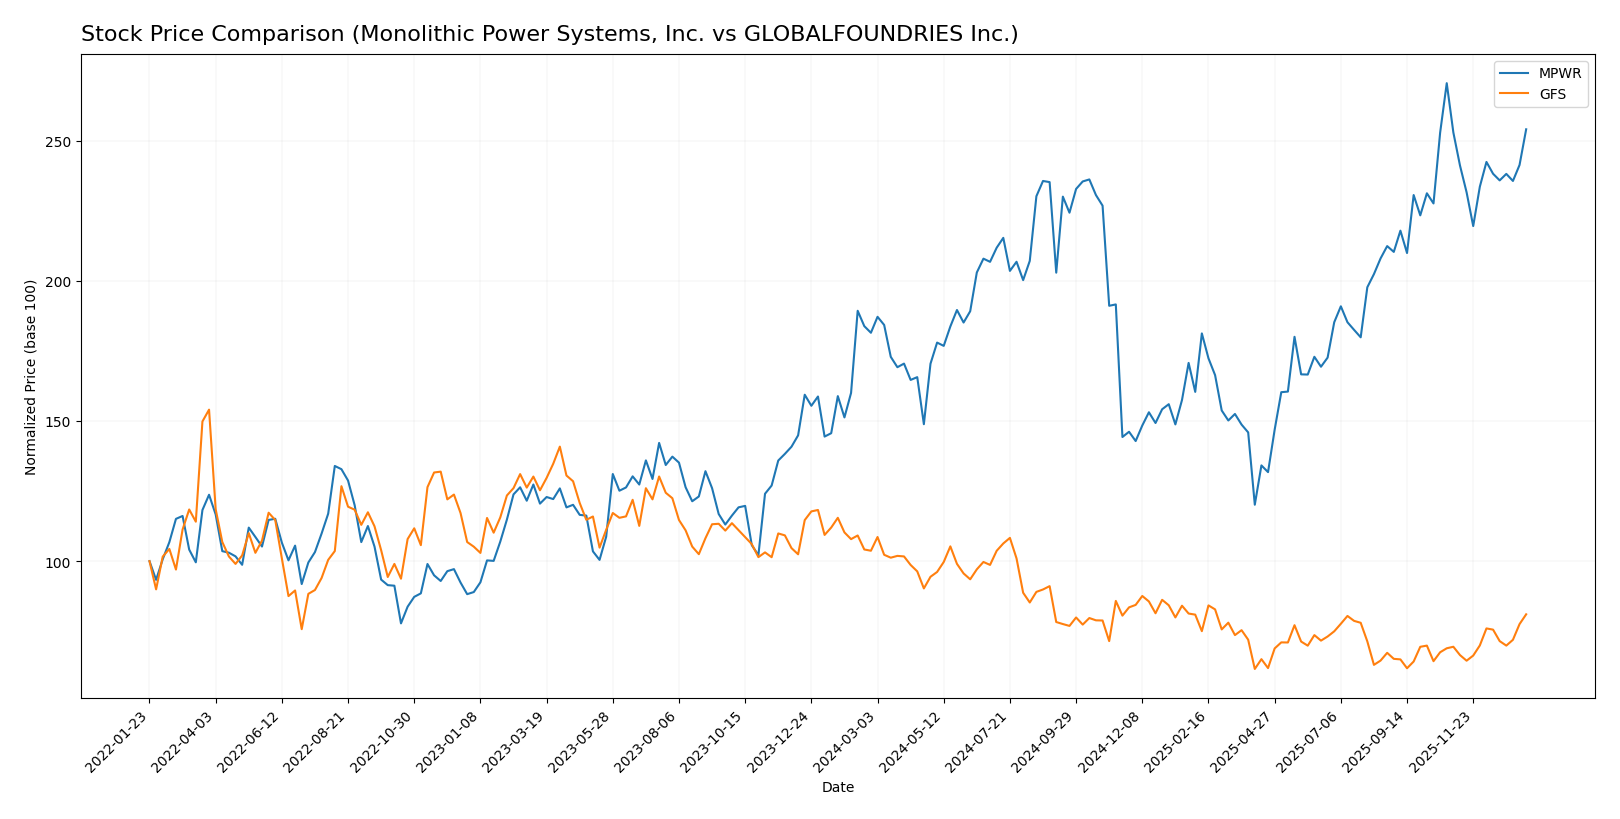
The past year highlighted divergent price movements and trading dynamics between Monolithic Power Systems, Inc. and GLOBALFOUNDRIES Inc., with MPWR showing strong gains while GFS experienced notable declines.
Trend Analysis
Monolithic Power Systems, Inc. (MPWR) exhibited a bullish trend with a 39.99% price increase over the past 12 months, marked by accelerating momentum and a high volatility level of 135.81. The stock reached a peak of 1074.91 and a low of 477.39.
GLOBALFOUNDRIES Inc. (GFS) showed a bearish trend with a 21.86% price decrease over the same period, also with accelerating trend characteristics but much lower volatility at 6.45. The highest and lowest prices were 55.66 and 31.54, respectively.
Comparing both, MPWR delivered the highest market performance with a substantial positive price change, contrasting with GFS’s significant decline over the past year.
Target Prices
Analysts present a clear consensus on target prices for Monolithic Power Systems, Inc. and GLOBALFOUNDRIES Inc.
| Company | Target High | Target Low | Consensus |
|---|---|---|---|
| Monolithic Power Systems, Inc. | 1375 | 1025 | 1187.5 |
| GLOBALFOUNDRIES Inc. | 40 | 37 | 38.5 |
The target consensus for Monolithic Power Systems significantly exceeds its current price of $1009.54, indicating strong growth expectations. GLOBALFOUNDRIES’ consensus target is slightly below its current price of $41.53, suggesting a more cautious outlook from analysts.
Analyst Opinions Comparison
This section compares analysts’ ratings and grades for Monolithic Power Systems, Inc. (MPWR) and GLOBALFOUNDRIES Inc. (GFS):
Rating Comparison
MPWR Rating
- Rating: A-, indicating a very favorable overall status
- Discounted Cash Flow Score: 3, moderate valuation view
- ROE Score: 5, very favorable profit generation from equity
- ROA Score: 5, very favorable asset utilization
- Debt To Equity Score: 5, very favorable financial risk
- Overall Score: 4, favorable financial standing
GFS Rating
- Rating: C+, indicating a very unfavorable overall status
- Discounted Cash Flow Score: 3, moderate valuation view
- ROE Score: 1, very unfavorable profit generation from equity
- ROA Score: 1, very unfavorable asset utilization
- Debt To Equity Score: 3, moderate financial risk
- Overall Score: 2, moderate financial standing
Which one is the best rated?
Based strictly on the provided data, MPWR is better rated with an A- rating and higher scores in ROE, ROA, debt to equity, and overall score. GFS shows weaker performance with a C+ rating and lower profitability and asset utilization scores.
Scores Comparison
Here is a comparison of the Altman Z-Score and Piotroski Score for both companies:
MPWR Scores
- Altman Z-Score: 46.83, indicating a safe zone, very low bankruptcy risk.
- Piotroski Score: 4, classified as average financial strength.
GFS Scores
- Altman Z-Score: 2.61, in the grey zone, moderate bankruptcy risk.
- Piotroski Score: 6, also indicating average financial strength.
Which company has the best scores?
MPWR shows a markedly higher Altman Z-Score, signaling stronger financial stability than GFS. Both companies have average Piotroski Scores, but MPWR’s exceptional Z-Score suggests a safer financial position overall.
Grades Comparison
Here is a comparison of recent grades assigned to Monolithic Power Systems, Inc. and GLOBALFOUNDRIES Inc.:
Monolithic Power Systems, Inc. Grades
The following table summarizes recent grades from notable grading companies for Monolithic Power Systems, Inc.:
| Grading Company | Action | New Grade | Date |
|---|---|---|---|
| Truist Securities | Maintain | Buy | 2025-12-19 |
| Citigroup | Maintain | Buy | 2025-11-03 |
| TD Cowen | Maintain | Buy | 2025-10-31 |
| Keybanc | Maintain | Overweight | 2025-10-31 |
| Rosenblatt | Maintain | Neutral | 2025-10-31 |
| Keybanc | Maintain | Overweight | 2025-10-23 |
| Wells Fargo | Maintain | Equal Weight | 2025-10-20 |
| Stifel | Maintain | Buy | 2025-10-17 |
| Wolfe Research | Upgrade | Outperform | 2025-10-14 |
| Citigroup | Maintain | Buy | 2025-10-03 |
Monolithic Power Systems, Inc. shows a predominantly positive rating trend with frequent “Buy” and “Overweight” grades and one recent upgrade to “Outperform.”
GLOBALFOUNDRIES Inc. Grades
The following table summarizes recent grades from notable grading companies for GLOBALFOUNDRIES Inc.:
| Grading Company | Action | New Grade | Date |
|---|---|---|---|
| Wedbush | Downgrade | Neutral | 2025-12-31 |
| B of A Securities | Maintain | Underperform | 2025-12-04 |
| Evercore ISI Group | Maintain | Outperform | 2025-11-13 |
| JP Morgan | Maintain | Neutral | 2025-11-13 |
| Citigroup | Maintain | Neutral | 2025-11-13 |
| Wedbush | Maintain | Outperform | 2025-11-13 |
| B of A Securities | Downgrade | Underperform | 2025-10-13 |
| Deutsche Bank | Maintain | Buy | 2025-08-06 |
| Morgan Stanley | Maintain | Equal Weight | 2025-08-06 |
| Wedbush | Maintain | Outperform | 2025-08-06 |
GLOBALFOUNDRIES Inc. exhibits mixed ratings, including downgrades to “Neutral” and “Underperform,” alongside some “Outperform” and “Buy” grades, indicating a more varied outlook.
Which company has the best grades?
Monolithic Power Systems, Inc. has received more consistently positive grades, predominantly “Buy” and “Overweight,” whereas GLOBALFOUNDRIES Inc. shows mixed ratings with notable downgrades. This may influence investors by indicating relatively stronger analyst confidence in Monolithic Power Systems, Inc.
Strengths and Weaknesses
Below is a comparative overview of key strengths and weaknesses for Monolithic Power Systems, Inc. (MPWR) and GLOBALFOUNDRIES Inc. (GFS) based on recent financial and operational data.
| Criterion | Monolithic Power Systems, Inc. (MPWR) | GLOBALFOUNDRIES Inc. (GFS) |
|---|---|---|
| Diversification | Focused on DC to DC and Lighting Control Products; steady growth in core segments (over $1.7B in DC to DC in 2023) | Heavy reliance on Water Fabrication ($6.1B in 2024) with smaller Engineering services segment; less diversified |
| Profitability | High net margin (80.95%), ROIC 16.22%, ROE 56.8%, creating value with growing profitability | Negative net margin (-3.93%), negative ROIC and ROE; shedding value though ROIC improving |
| Innovation | Demonstrates durable competitive advantage with growing ROIC and innovation in power management | Profitability challenges limit R&D capacity; improving ROIC trend may signal recovery potential |
| Global presence | Substantial global footprint through semiconductor power products | Large-scale global fabrication facilities but operational inefficiencies impact returns |
| Market Share | Strong niche market share in power conversion products, consistent revenue growth | Significant player in semiconductor fabrication but lagging profitability and asset turnover |
Key takeaways: MPWR shows strong profitability, efficient capital use, and steady innovation, making it a value-creating company with a favorable investment profile. GFS, while improving its profitability trend, currently struggles with negative returns and profitability, requiring cautious consideration due to value erosion risks.
Risk Analysis
The table below summarizes key risk metrics for Monolithic Power Systems, Inc. (MPWR) and GLOBALFOUNDRIES Inc. (GFS) as of 2024, highlighting market, financial, regulatory, operational, environmental, and geopolitical risks.
| Metric | Monolithic Power Systems (MPWR) | GLOBALFOUNDRIES (GFS) |
|---|---|---|
| Market Risk | Beta 1.46 (moderate volatility) | Beta 1.49 (moderate volatility) |
| Debt level | Very low debt-to-equity 0.01 | Low debt-to-equity 0.22 |
| Regulatory Risk | Moderate (global semiconductor regulations) | Moderate (foundry industry scrutiny) |
| Operational Risk | Low (diversified markets, strong asset turnover) | Elevated (lower asset turnover, negative margins) |
| Environmental Risk | Moderate (semiconductor manufacturing impact) | Moderate (foundry emissions and waste) |
| Geopolitical Risk | High (exposure to Asia, US-China tensions) | High (global supply chain, US-China tensions) |
Monolithic Power Systems shows strong financial stability with minimal debt and favorable profitability, reducing financial risk. GLOBALFOUNDRIES faces higher operational and profitability challenges, with a grey zone Altman Z-score and negative margins indicating moderate bankruptcy risk. Both companies share high geopolitical risks due to semiconductor supply chain sensitivities in Asia.
Which Stock to Choose?
Monolithic Power Systems, Inc. (MPWR) shows strong income growth with a 21.2% revenue increase in 2024, favorable profitability ratios including an 80.95% net margin, low debt levels, and a very favorable A- rating. Its financial ratios are largely positive, indicating efficient capital use and solid returns.
GLOBALFOUNDRIES Inc. (GFS) experienced a revenue decline of 8.69% in 2024, with unfavorable net margin and return on equity, moderate debt, and a C+ rating. Financial ratios reflect challenges in profitability and asset turnover, resulting in an overall unfavorable income statement evaluation.
For investors prioritizing competitive advantage and financial strength, MPWR’s very favorable rating and consistent income growth could be seen as appealing, while GFS’s improving profitability trend but overall unfavorable metrics might suggest a higher risk profile. Thus, preference might depend on an investor’s risk tolerance and strategy focus.
Disclaimer: Investment carries a risk of loss of initial capital. The past performance is not a reliable indicator of future results. Be sure to understand risks before making an investment decision.
Go Further
I encourage you to read the complete analyses of Monolithic Power Systems, Inc. and GLOBALFOUNDRIES Inc. to enhance your investment decisions: