Micron Technology, Inc. and GLOBALFOUNDRIES Inc. are two key players in the semiconductor industry, each shaping the future of electronic components through innovation and manufacturing expertise. While Micron focuses on memory and storage solutions, GLOBALFOUNDRIES specializes in semiconductor foundry services, creating a competitive yet complementary dynamic. This article will analyze both companies to help you decide which presents the most promising investment opportunity in 2026.
Table of contents
Companies Overview
I will begin the comparison between Micron Technology, Inc. and GLOBALFOUNDRIES Inc. by providing an overview of these two companies and their main differences.
Micron Technology, Inc. Overview
Micron Technology, Inc. designs, manufactures, and sells memory and storage products globally. It operates through four segments covering compute, mobile, storage, and embedded markets. Its product lineup includes DRAM, NAND, and NOR memory devices under Micron and Crucial brands. The company serves cloud, enterprise, client, graphics, networking, automotive, industrial, and consumer sectors, positioning itself as a leading memory and storage semiconductor supplier.
GLOBALFOUNDRIES Inc. Overview
GLOBALFOUNDRIES Inc. is a semiconductor foundry that manufactures integrated circuits and a broad range of semiconductor devices worldwide. Its portfolio includes microprocessors, application processors, network processors, RF modems, microcontrollers, and power management units. The company provides wafer fabrication services and technologies, supporting diverse electronic devices with a focus on foundry manufacturing, based in Malta, New York.
Key similarities and differences
Both companies operate in the semiconductor industry serving global technology markets, but their business models differ significantly. Micron focuses on producing memory and storage products with direct and channel sales, while GLOBALFOUNDRIES specializes in foundry services, manufacturing integrated circuits for various clients. Micron’s market cap stands at 373B USD with 48K employees, contrasting with GLOBALFOUNDRIES’ 23B USD market cap and 13K employees, reflecting their scale and operational focus.
Income Statement Comparison
Below is a side-by-side comparison of the most recent fiscal year income statement metrics for Micron Technology, Inc. and GLOBALFOUNDRIES Inc.

| Metric | Micron Technology, Inc. (MU) | GLOBALFOUNDRIES Inc. (GFS) |
|---|---|---|
| Market Cap | 373B | 23B |
| Revenue | 37.4B | 6.75B |
| EBITDA | 18.5B | 1.50B |
| EBIT | 10.1B | -64M |
| Net Income | 8.54B | -265M |
| EPS | 7.65 | -0.48 |
| Fiscal Year | 2025 | 2024 |
Income Statement Interpretations
Micron Technology, Inc.
Micron Technology demonstrated strong revenue growth from 2021 to 2025, increasing from $27.7B to $37.4B. Net income recovered sharply after a loss in 2023, reaching $8.54B in 2025. Margins notably improved, with a favorable net margin of 22.84% in the latest year. The 2025 fiscal year showed accelerated growth and margin expansion, reflecting robust operational efficiency.
GLOBALFOUNDRIES Inc.
GLOBALFOUNDRIES experienced moderate revenue growth over the 2020-2024 period, peaking at $6.75B in 2024 but declining 8.7% from the previous year. Net income fluctuated, ending in a loss of $265M in 2024. Margins were mixed, with a gross margin of 24.46% but an unfavorable net margin of -3.93%. The latest year reflected weakening profitability amid declining operational income.
Which one has the stronger fundamentals?
Micron Technology shows stronger fundamentals with consistent revenue and net income growth, along with favorable margins and profitability improvements. In contrast, GLOBALFOUNDRIES struggles with profitability and margin contraction despite revenue gains over the longer term. The comprehensive income statement evaluation favors Micron’s sustained earnings quality and margin resilience.
Financial Ratios Comparison
The table below presents a side-by-side comparison of key financial ratios for Micron Technology, Inc. (MU) and GLOBALFOUNDRIES Inc. (GFS) based on their most recent fiscal year data.
| Ratios | Micron Technology, Inc. (MU) FY 2025 | GLOBALFOUNDRIES Inc. (GFS) FY 2024 |
|---|---|---|
| ROE | 15.8% | -2.5% |
| ROIC | 12.1% | -1.5% |
| P/E | 15.9 | -89.5 |
| P/B | 2.51 | 2.20 |
| Current Ratio | 2.52 | 2.11 |
| Quick Ratio | 1.79 | 1.57 |
| D/E (Debt to Equity) | 0.28 | 0.22 |
| Debt-to-Assets | 18.5% | 13.8% |
| Interest Coverage | 20.7 | -1.48 |
| Asset Turnover | 0.45 | 0.40 |
| Fixed Asset Turnover | 0.79 | 0.82 |
| Payout Ratio | 6.1% | 0% |
| Dividend Yield | 0.38% | 0% |
Interpretation of the Ratios
Micron Technology, Inc.
Micron shows a majority of favorable ratios including strong net margin at 22.84% and robust ROE of 15.76%, signaling efficient profitability and shareholder returns. However, a high WACC and weak asset turnover ratios suggest operational and cost challenges. The company pays dividends with a modest yield of 0.38%, indicating cautious shareholder returns supported by free cash flow, though the yield is considered low.
GLOBALFOUNDRIES Inc.
GLOBALFOUNDRIES presents mostly unfavorable profitability ratios such as negative net margin (-3.93%) and ROE (-2.46%), reflecting operational difficulties. Its liquidity and leverage ratios are favorable, but negative interest coverage raises concern over debt servicing. The company does not pay dividends, likely due to its negative earnings and reinvestment focus in R&D, consistent with a growth or restructuring phase.
Which one has the best ratios?
Micron Technology exhibits a predominantly favorable ratio profile with profitable returns and solid liquidity, despite some operational inefficiencies. GLOBALFOUNDRIES faces more challenges with negative profitability and interest coverage, offset only by decent liquidity and leverage metrics. Overall, Micron’s ratios appear stronger compared to GLOBALFOUNDRIES’s more mixed and unfavorable financial indicators.
Strategic Positioning
This section compares the strategic positioning of Micron Technology, Inc. (MU) and GLOBALFOUNDRIES Inc. (GFS) focusing on Market position, Key segments, and Exposure to technological disruption:
Micron Technology, Inc.
- Large market cap of 373B with significant competitive pressure in semiconductors industry.
- Diverse segments including DRAM, NAND, Compute, Mobile, Storage, Embedded business units.
- Faces technological disruption in memory and storage technologies with evolving semiconductor demands.
GLOBALFOUNDRIES Inc.
- Smaller market cap of 23B, operating in a competitive semiconductor foundry sector.
- Focused on wafer fabrication and integrated circuit manufacturing services.
- Exposed to fabrication technology shifts affecting integrated circuit and microprocessor manufacturing.
Micron Technology, Inc. vs GLOBALFOUNDRIES Inc. Positioning
MU adopts a diversified approach with multiple product lines and business units, providing broad exposure across memory and storage markets. GFS has a concentrated focus on wafer fabrication and semiconductor foundry services, relying on specialized manufacturing capabilities. MU leverages scale and product diversity; GFS emphasizes niche fabrication expertise.
Which has the best competitive advantage?
Both companies are shedding value but show growing ROIC trends. MU’s slightly favorable moat indicates improving profitability, whereas GFS’s slightly unfavorable moat suggests continued value destruction despite rising profitability.
Stock Comparison
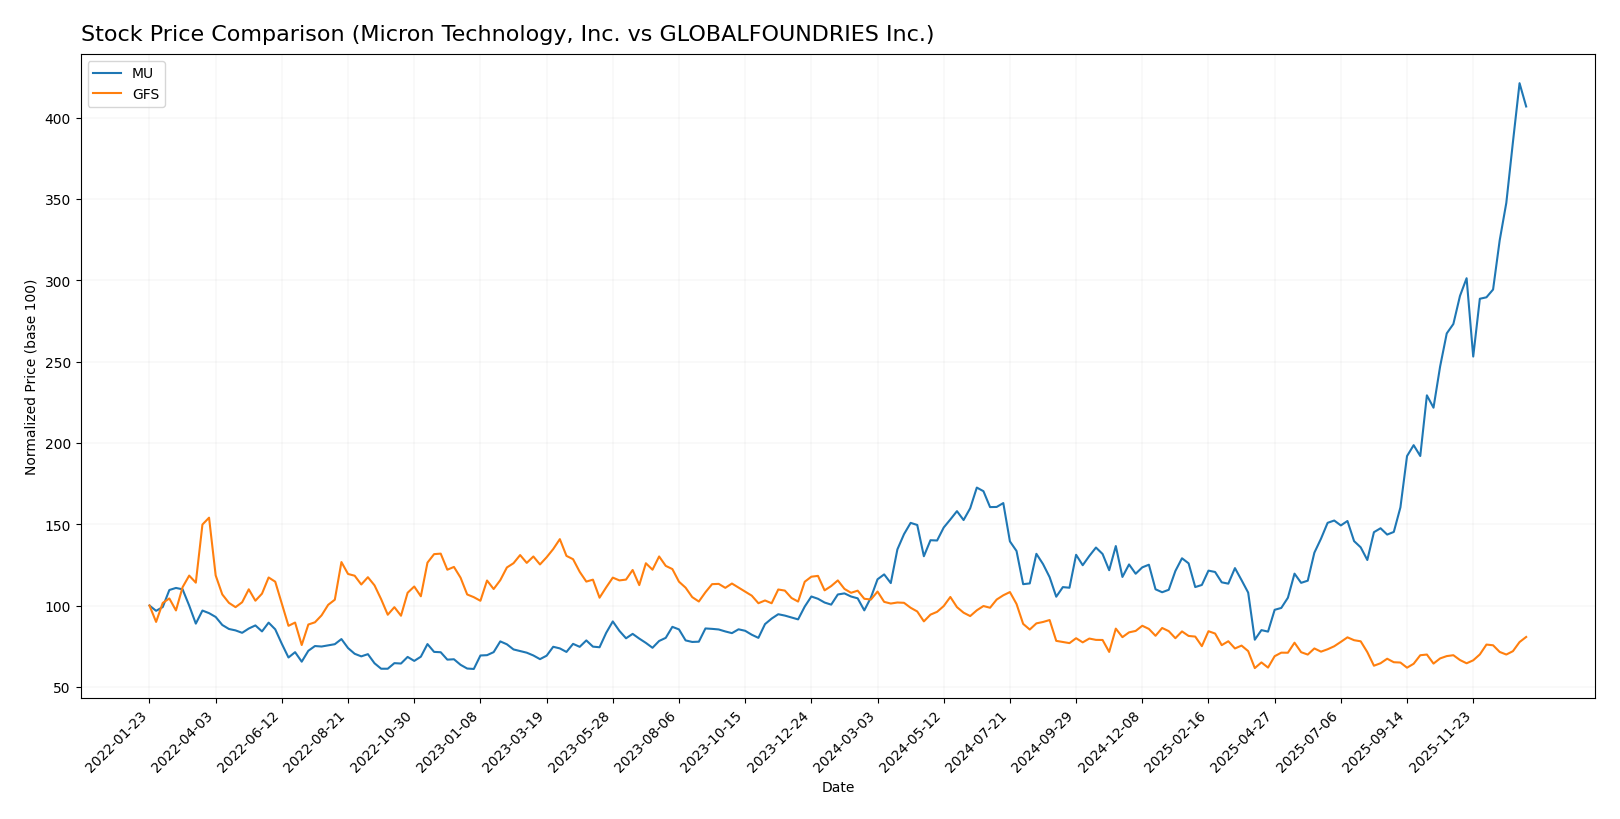
The stock price movements of Micron Technology, Inc. (MU) and GLOBALFOUNDRIES Inc. (GFS) over the past year reveal contrasting dynamics, with MU showing strong gains and GFS experiencing declines followed by modest recent recovery.
Trend Analysis
Micron Technology, Inc. (MU) exhibited a bullish trend over the past 12 months with a remarkable 287.62% price increase, showing acceleration and high volatility with a standard deviation of 57.56. The stock reached a high of 345.09 and a low of 64.72.
GLOBALFOUNDRIES Inc. (GFS) followed a bearish trend over the same period with a 22.2% price decline and accelerating movement. Volatility was low with a 6.45 standard deviation, with prices ranging from 31.54 to 55.66.
Comparing both stocks, MU delivered the highest market performance with a substantial positive return, while GFS recorded a negative overall trend despite recent moderate gains.
Target Prices
The target price consensus for Micron Technology, Inc. and GLOBALFOUNDRIES Inc. shows mixed but informative analyst expectations.
| Company | Target High | Target Low | Consensus |
|---|---|---|---|
| Micron Technology, Inc. | 450 | 190 | 328.22 |
| GLOBALFOUNDRIES Inc. | 40 | 37 | 38.5 |
Analyst consensus for Micron Technology suggests a moderate upside potential with targets ranging broadly, while GLOBALFOUNDRIES targets are close to the current price, indicating stable expectations. Micron’s consensus is slightly below its current price of 333.35 USD, and GLOBALFOUNDRIES’ consensus is below its current price of 41.35 USD.
Analyst Opinions Comparison
This section compares analysts’ ratings and grades for Micron Technology, Inc. and GLOBALFOUNDRIES Inc.:
Rating Comparison
MU Rating
- Rating: B, classified as Very Favorable.
- Discounted Cash Flow Score: 1, Very Unfavorable.
- Return on Equity Score: 4, Favorable.
- Return on Assets Score: 5, Very Favorable.
- Debt To Equity Score: 3, Moderate.
- Overall Score: 3, Moderate.
GFS Rating
- Rating: C+, classified as Very Favorable.
- Discounted Cash Flow Score: 3, Moderate.
- Return on Equity Score: 1, Very Unfavorable.
- Return on Assets Score: 1, Very Unfavorable.
- Debt To Equity Score: 3, Moderate.
- Overall Score: 2, Moderate.
Which one is the best rated?
Based strictly on provided data, MU holds a higher rating (B) than GFS (C+). MU scores better on return metrics and overall score, while GFS leads only in discounted cash flow. MU is better rated overall.
Scores Comparison
Here is a comparison of the financial health scores for Micron Technology, Inc. (MU) and GLOBALFOUNDRIES Inc. (GFS):
MU Scores
- Altman Z-Score: 10.5, indicating a safe zone status.
- Piotroski Score: 7, classified as strong financial health.
GFS Scores
- Altman Z-Score: 2.6, indicating a grey zone status.
- Piotroski Score: 6, considered average financial health.
Which company has the best scores?
Based strictly on the provided data, MU has higher scores in both the Altman Z-Score and Piotroski Score, indicating stronger financial stability and health compared to GFS.
Grades Comparison
Here is the comparison of the latest reliable grades assigned to Micron Technology, Inc. and GLOBALFOUNDRIES Inc.:
Micron Technology, Inc. Grades
The table below summarizes recent grades from reputable grading companies for Micron Technology, Inc.:
| Grading Company | Action | New Grade | Date |
|---|---|---|---|
| Keybanc | Maintain | Overweight | 2026-01-13 |
| B of A Securities | Maintain | Buy | 2026-01-13 |
| Lynx Global | Maintain | Buy | 2026-01-12 |
| Mizuho | Maintain | Outperform | 2026-01-09 |
| UBS | Maintain | Buy | 2026-01-07 |
| Piper Sandler | Maintain | Overweight | 2026-01-07 |
| Piper Sandler | Maintain | Overweight | 2025-12-18 |
| Barclays | Maintain | Overweight | 2025-12-18 |
| Keybanc | Maintain | Overweight | 2025-12-18 |
| Wolfe Research | Maintain | Outperform | 2025-12-18 |
Micron Technology’s grades consistently show a strong buy and overweight trend, indicating confidence from multiple grading firms.
GLOBALFOUNDRIES Inc. Grades
The table below summarizes recent grades from reputable grading companies for GLOBALFOUNDRIES Inc.:
| Grading Company | Action | New Grade | Date |
|---|---|---|---|
| Wedbush | Downgrade | Neutral | 2025-12-31 |
| B of A Securities | Maintain | Underperform | 2025-12-04 |
| Evercore ISI Group | Maintain | Outperform | 2025-11-13 |
| JP Morgan | Maintain | Neutral | 2025-11-13 |
| Citigroup | Maintain | Neutral | 2025-11-13 |
| Wedbush | Maintain | Outperform | 2025-11-13 |
| B of A Securities | Downgrade | Underperform | 2025-10-13 |
| Deutsche Bank | Maintain | Buy | 2025-08-06 |
| Morgan Stanley | Maintain | Equal Weight | 2025-08-06 |
| Wedbush | Maintain | Outperform | 2025-08-06 |
GLOBALFOUNDRIES shows a mixed pattern with several neutral and underperform grades and fewer strong buy signals, reflecting more cautious views.
Which company has the best grades?
Micron Technology has received consistently stronger grades, predominantly buy and overweight ratings, compared to GLOBALFOUNDRIES’ more mixed and cautious ratings. This difference suggests investors may perceive Micron as having better growth or stability prospects.
Strengths and Weaknesses
Below is a comparison of key strengths and weaknesses of Micron Technology, Inc. (MU) and GLOBALFOUNDRIES Inc. (GFS) based on their most recent financial and operational data.
| Criterion | Micron Technology, Inc. (MU) | GLOBALFOUNDRIES Inc. (GFS) |
|---|---|---|
| Diversification | Broad product mix including DRAM ($28.6B) and NAND ($8.5B) segments | Focused primarily on Water Fabrication ($6.1B) and Engineering Services ($0.65B) |
| Profitability | Favorable margins (Net Margin 22.8%, ROIC 12.1%), value creation improving | Unfavorable profitability (Net Margin -3.9%, ROIC -1.5%), value destroying but improving ROIC |
| Innovation | Strong investment in memory tech, growing ROIC indicating innovation payoff | Improving ROIC trend, but currently shedding value; innovation impact limited so far |
| Global presence | Significant global footprint with multiple business units (CNBU, EBU, MBU, SBU) | Primarily operating in fabrication services, less diversified geographically |
| Market Share | Large presence in DRAM and NAND markets, strong competitive position | Smaller market share, predominantly a contract foundry with niche segments |
Key takeaways: Micron Technology demonstrates strong profitability, diversification, and a growing competitive advantage, making it a more favorable investment option. GLOBALFOUNDRIES shows improving profitability trends but remains value destructive with narrower diversification and market presence, posing higher risk for investors.
Risk Analysis
Below is a comparative overview of key risks for Micron Technology, Inc. (MU) and GLOBALFOUNDRIES Inc. (GFS) for the most recent years.
| Metric | Micron Technology, Inc. (MU) | GLOBALFOUNDRIES Inc. (GFS) |
|---|---|---|
| Market Risk | High beta (1.503) indicates elevated market volatility exposure. | Similar beta (1.485) implies comparable market sensitivity. |
| Debt level | Low debt-to-equity (0.28) and debt-to-assets (18.45%) suggest manageable leverage. | Even lower debt-to-equity (0.22) and debt-to-assets (13.81%) show conservative leverage. |
| Regulatory Risk | Moderate, given global semiconductor regulations and trade policies. | Moderate, with potential impact from export controls and foundry-specific compliance. |
| Operational Risk | Unfavorable asset turnover (0.45) and fixed asset turnover (0.79) indicate operational efficiency challenges. | Slightly better fixed asset turnover (0.82) but similar operational inefficiencies. |
| Environmental Risk | Industry-wide risks related to semiconductor manufacturing waste and energy use. | Same industry risks; no specific differentiation. |
| Geopolitical Risk | Exposure to US-China tensions affecting semiconductor supply chain and sales. | Similar geopolitical pressures, especially as a US-based foundry dependent on global clients. |
Micron’s market risk is elevated due to its beta above 1.5, reflecting sensitivity to market swings. Its strong balance sheet lowers financial distress risk, supported by a safe Altman Z-Score above 10. GLOBALFOUNDRIES shows increased operational and profitability risks, reflected in a grey zone Altman Z-Score (~2.6) signaling moderate bankruptcy risk. Geopolitical tensions remain the most impactful risk for both, potentially disrupting supply chains and sales. Caution is advised, especially with GFS’s weaker profitability metrics and operational challenges.
Which Stock to Choose?
Micron Technology, Inc. (MU) shows a strong income evolution with a 48.85% revenue growth in 2025 and consistently favorable profitability metrics, including a 22.84% net margin. Its financial ratios are mostly favorable, with strong returns on equity (15.76%) and invested capital (12.12%), low debt levels, and a very favorable rating of B. The company’s economic moat is slightly favorable, indicating growing profitability despite value shedding concerns.
GLOBALFOUNDRIES Inc. (GFS) displays a less favorable income trajectory, with an 8.69% revenue decline in 2024 and negative net margin (-3.93%). Its financial ratios are largely unfavorable, reflecting weak returns and interest coverage, although it maintains low debt and a moderate rating of C+. The company’s moat is slightly unfavorable, signaling value destruction but improving profitability over time.
For investors, MU’s very favorable rating and strong income and financial ratio trends may appear more attractive for those seeking growth and quality. Conversely, GFS might be seen as more suitable for those with a tolerance for higher risk and potential recovery plays, given its improving yet still challenged profitability and financial standing.
Disclaimer: Investment carries a risk of loss of initial capital. The past performance is not a reliable indicator of future results. Be sure to understand risks before making an investment decision.
Go Further
I encourage you to read the complete analyses of Micron Technology, Inc. and GLOBALFOUNDRIES Inc. to enhance your investment decisions: