In the fast-evolving semiconductor industry, GLOBALFOUNDRIES Inc. (GFS) and Microchip Technology Incorporated (MCHP) stand out as key players with overlapping market presence and innovation-driven strategies. While GLOBALFOUNDRIES focuses on wafer fabrication and integrated circuit manufacturing, Microchip emphasizes embedded control solutions and diversified semiconductor products. This comparison will help investors identify which company offers the most promising potential for their portfolio in 2026. Let’s explore their strengths and opportunities.
Table of contents
Companies Overview
I will begin the comparison between GLOBALFOUNDRIES Inc. and Microchip Technology Incorporated by providing an overview of these two companies and their main differences.
GLOBALFOUNDRIES Inc. Overview
GLOBALFOUNDRIES Inc. operates globally as a semiconductor foundry, manufacturing integrated circuits that power a variety of electronic devices. Its product range includes microprocessors, mobile application processors, network processors, and other semiconductor technologies. Founded in 2009 and based in Malta, New York, the company positions itself as a key player in wafer fabrication services within the semiconductor industry.
Microchip Technology Incorporated Overview
Microchip Technology Incorporated develops and sells embedded control solutions worldwide, offering microcontrollers, microprocessors, and specialized chips for diverse industries such as automotive, industrial, and communications. Established in 1989 and headquartered in Chandler, Arizona, it also provides development tools, memory products, and subcontracting services in wafer foundry and assembly, addressing a broad embedded systems market.
Key similarities and differences
Both companies operate within the semiconductor sector and provide wafer fabrication services, but GLOBALFOUNDRIES primarily focuses on semiconductor foundry and integrated circuit manufacturing. In contrast, Microchip offers a wider product portfolio including microcontrollers, analog and timing products, and embedded memory, alongside development tools and engineering services. GLOBALFOUNDRIES is relatively younger and smaller in workforce compared to Microchip’s longer-established and more diversified business model.
Income Statement Comparison
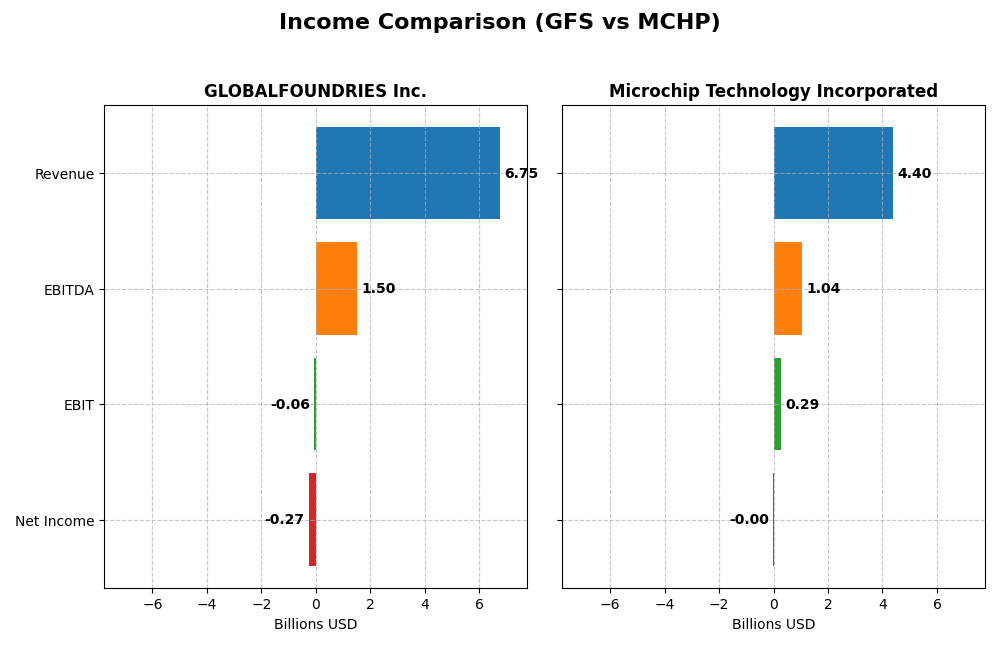
The table below compares key income statement metrics for GLOBALFOUNDRIES Inc. and Microchip Technology Incorporated for their most recent fiscal years, providing a snapshot of their financial performance.
| Metric | GLOBALFOUNDRIES Inc. (2024) | Microchip Technology Incorporated (2025) |
|---|---|---|
| Market Cap | 20.4B | 35.0B |
| Revenue | 6.75B | 4.40B |
| EBITDA | 1.50B | 1.04B |
| EBIT | -64M | 290M |
| Net Income | -265M | -0.5M |
| EPS | -0.48 | -0.005 |
| Fiscal Year | 2024 | 2025 |
Income Statement Interpretations
GLOBALFOUNDRIES Inc.
GLOBALFOUNDRIES showed a revenue increase of 39.15% from 2020 to 2024, with net income growing 80.37% over the same period. Margins fluctuated, with a favorable gross margin of 24.46% but an unfavorable negative net margin of -3.93% in 2024. The most recent year saw revenue decline by 8.69%, net income turning negative at -$265M, and margins deteriorating, signaling a slowdown.
Microchip Technology Incorporated
Microchip Technology experienced a revenue decrease of 19.06% from 2021 to 2025, with net income falling sharply by 100.14% overall. The company maintains a strong gross margin of 56.07%, yet its net margin slipped to slightly negative (-0.01%) in 2025. The latest fiscal year reflected a steep 42.35% revenue drop and an almost break-even net income, indicating significant margin pressure.
Which one has the stronger fundamentals?
Both companies faced unfavorable income statement evaluations in recent years, marked by declining revenues and negative net margins. GLOBALFOUNDRIES exhibited overall growth in revenue and net income across the period, albeit with a recent decline, while Microchip’s metrics have steadily worsened. Despite challenges, GLOBALFOUNDRIES shows relatively stronger fundamentals given its historical growth and higher margin resilience.
Financial Ratios Comparison
The table below presents a side-by-side comparison of key financial ratios for GLOBALFOUNDRIES Inc. (GFS) and Microchip Technology Incorporated (MCHP) based on their most recent fiscal year data.
| Ratios | GLOBALFOUNDRIES Inc. (GFS) 2024 | Microchip Technology Inc. (MCHP) 2025 |
|---|---|---|
| ROE | -2.46% | -0.007% |
| ROIC | -2.26% | -0.03% |
| P/E | -89.54 | -52021 |
| P/B | 2.20 | 3.67 |
| Current Ratio | 2.11 | 2.59 |
| Quick Ratio | 1.57 | 1.47 |
| D/E (Debt-to-Equity) | 0.22 | 0.80 |
| Debt-to-Assets | 13.81% | 36.85% |
| Interest Coverage | -1.48 | 1.18 |
| Asset Turnover | 0.40 | 0.29 |
| Fixed Asset Turnover | 0.82 | 3.72 |
| Payout Ratio | 0 | -1951.4 |
| Dividend Yield | 0 | 3.75% |
Interpretation of the Ratios
GLOBALFOUNDRIES Inc.
GLOBALFOUNDRIES shows several unfavorable ratios including negative net margin (-3.93%) and return on equity (-2.46%), indicating profitability and efficiency challenges. However, liquidity ratios like current ratio (2.11) and debt metrics are favorable, suggesting sound short-term financial health. The company does not pay dividends, likely focusing on reinvestment and growth given its negative earnings and cash flow variability.
Microchip Technology Incorporated
Microchip’s ratios present a mixed picture with negative net margin (-0.01%) and return on equity (-0.01%), signaling profitability issues. Liquidity looks solid with a current ratio of 2.59, though debt levels are moderate to high. The company pays dividends with a 3.75% yield, supported by share buybacks and free cash flow coverage, though some ratios hint at pressure on interest coverage and asset turnover.
Which one has the best ratios?
Microchip Technology holds a slightly more favorable overall ratio profile than GLOBALFOUNDRIES, with better dividend yield and some strong liquidity and asset efficiency metrics. However, both companies face profitability challenges and caution is warranted given their negative returns and interest coverage concerns. Neither stands out as definitively strong across all key financial ratios.
Strategic Positioning
This section compares the strategic positioning of GLOBALFOUNDRIES Inc. (GFS) and Microchip Technology Incorporated (MCHP) in terms of Market position, Key segments, and Exposure to technological disruption:
GLOBALFOUNDRIES Inc.
- Operates as a global semiconductor foundry facing competitive industry pressure.
- Focused on wafer fabrication and engineering services, primarily semiconductor manufacturing.
- Exposure to semiconductor technology advances with emphasis on wafer fabrication processes.
Microchip Technology Incorporated
- Manufactures diverse embedded control solutions competing globally in semiconductors.
- Offers microcontrollers, microprocessors, analog, memory, and licensing technology segments.
- Faces disruption risks from evolving embedded systems and memory technology innovations.
GLOBALFOUNDRIES Inc. vs Microchip Technology Incorporated Positioning
GFS has a concentrated strategy centered on foundry services and wafer fabrication, while MCHP pursues a diversified approach across embedded microcontrollers, analog products, and licensing. GFS’s focus may limit market segments but strengthens its foundry specialization, whereas MCHP’s breadth exposes it to multiple growth drivers but also varied competitive risks.
Which has the best competitive advantage?
Both companies are currently shedding value as their ROIC is below WACC. GFS shows a growing ROIC trend (Slightly Unfavorable), while MCHP’s declining ROIC trend makes its position Very Unfavorable, indicating GFS holds a marginally better competitive advantage based on MOAT evaluation.
Stock Comparison
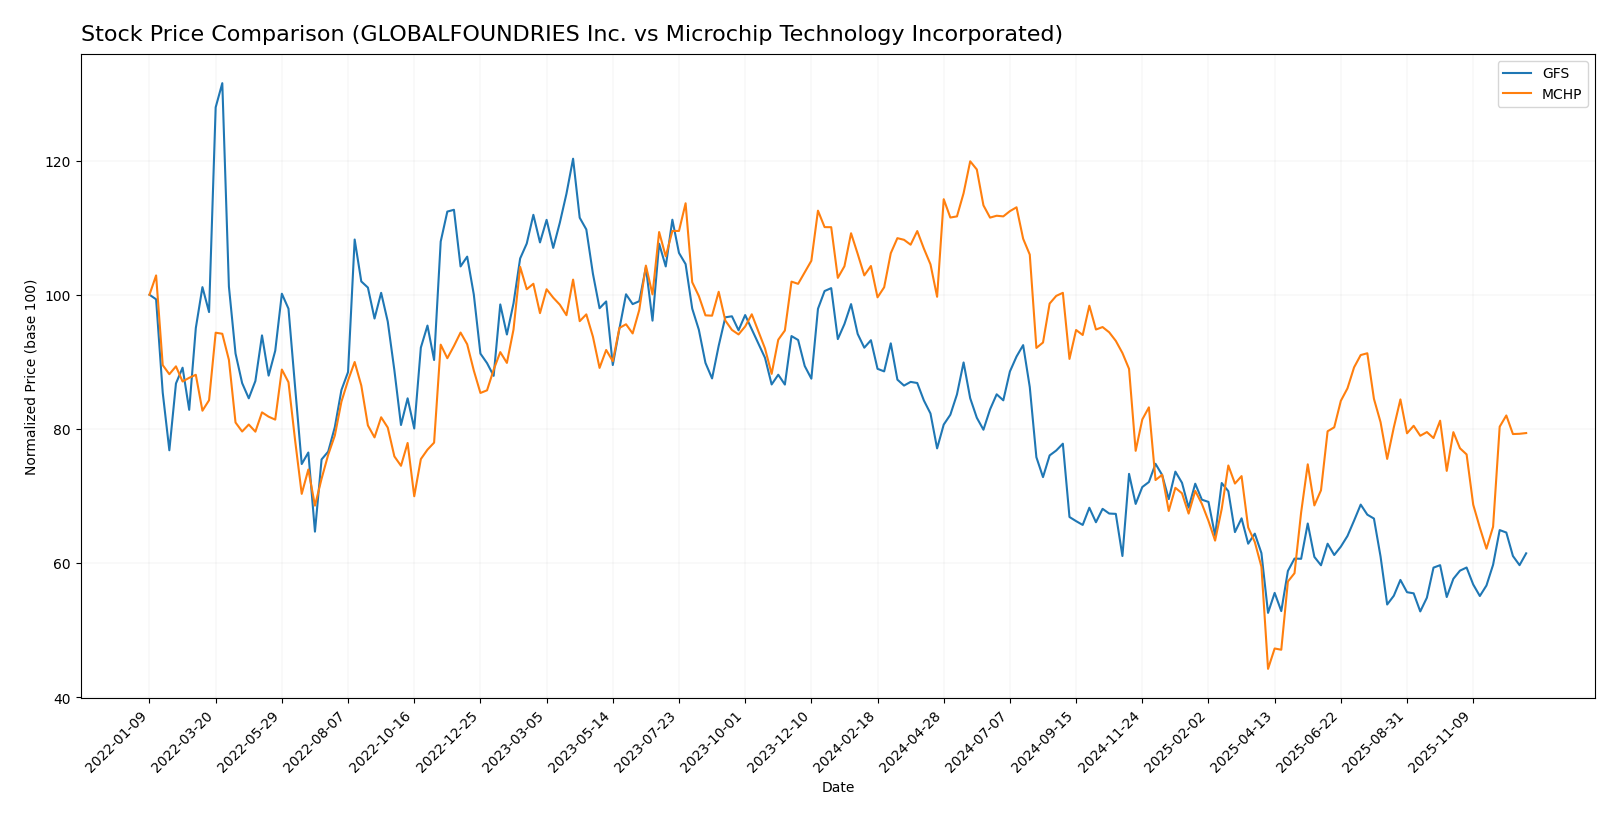
The stock prices of GLOBALFOUNDRIES Inc. and Microchip Technology Incorporated have shown significant bearish trends over the past 12 months, with recent fluctuations indicating varying momentum and trading dynamics.
Trend Analysis
GLOBALFOUNDRIES Inc. (GFS) experienced a 34.09% price decline over the past year, indicating a bearish trend with acceleration and a volatility standard deviation of 6.71. Recent weeks show a modest 6.59% recovery.
Microchip Technology Incorporated (MCHP) saw a 23.89% price drop in the same period, also bearish with acceleration and higher volatility at 14.5 standard deviation. Its recent trend is nearly neutral with a slight 0.17% decrease.
Comparing both, GLOBALFOUNDRIES Inc. has endured a steeper decline but shows a short-term rebound, while Microchip Technology’s performance remains less negative overall; thus, MCHP delivered the higher market performance over the year.
Target Prices
The target price consensus for GLOBALFOUNDRIES Inc. and Microchip Technology Incorporated reflects moderate upside potential according to analyst estimates.
| Company | Target High | Target Low | Consensus |
|---|---|---|---|
| GLOBALFOUNDRIES Inc. | 40 | 37 | 38.5 |
| Microchip Technology Incorporated | 85 | 60 | 73.83 |
Analysts expect GLOBALFOUNDRIES shares to rise slightly above the current price of $36.87, while Microchip Technology’s target consensus of $73.83 suggests a notable upside from its $65.03 trading price.
Analyst Opinions Comparison
This section compares analysts’ ratings and grades for GLOBALFOUNDRIES Inc. and Microchip Technology Incorporated:
Rating Comparison
GLOBALFOUNDRIES Inc. Rating
- Rating: C+, evaluated as Very Favorable overall
- Discounted Cash Flow Score: 3, indicating a Moderate valuation outlook
- ROE Score: 1, considered Very Unfavorable
- ROA Score: 1, marked Very Unfavorable
- Debt To Equity Score: 3, Moderate financial risk indicated
- Overall Score: 2, Moderate company financial standing
Microchip Technology Incorporated Rating
- Rating: C-, also Very Favorable overall
- Discounted Cash Flow Score: 3, showing a Moderate valuation outlook
- ROE Score: 1, also Very Unfavorable
- ROA Score: 1, similarly Very Unfavorable
- Debt To Equity Score: 1, very unfavorable financial risk
- Overall Score: 1, Very Unfavorable company financial standing
Which one is the best rated?
Based strictly on the provided data, GLOBALFOUNDRIES Inc. holds higher overall and debt-to-equity scores, suggesting a moderately better financial standing compared to Microchip Technology, which shows more unfavorable risk metrics.
Scores Comparison
The following table compares the Altman Z-Score and Piotroski Score of GLOBALFOUNDRIES Inc. and Microchip Technology Incorporated:
GLOBALFOUNDRIES Inc. Scores
- Altman Z-Score: 2.03, in the grey zone, indicating moderate bankruptcy risk
- Piotroski Score: 6, average financial strength
Microchip Technology Incorporated Scores
- Altman Z-Score: 3.60, in the safe zone, indicating low bankruptcy risk
- Piotroski Score: 3, very weak financial strength
Which company has the best scores?
Microchip Technology has a stronger Altman Z-Score indicating lower bankruptcy risk, but a weaker Piotroski Score compared to GLOBALFOUNDRIES. Each company shows strengths in different financial health aspects.
Grades Comparison
I present below the recent grading updates from reputable financial institutions for the two companies:
GLOBALFOUNDRIES Inc. Grades
This table summarizes recent grades assigned to GLOBALFOUNDRIES Inc. by established grading companies.
| Grading Company | Action | New Grade | Date |
|---|---|---|---|
| Wedbush | Downgrade | Neutral | 2025-12-31 |
| B of A Securities | Maintain | Underperform | 2025-12-04 |
| Citigroup | Maintain | Neutral | 2025-11-13 |
| Wedbush | Maintain | Outperform | 2025-11-13 |
| JP Morgan | Maintain | Neutral | 2025-11-13 |
| Evercore ISI Group | Maintain | Outperform | 2025-11-13 |
| B of A Securities | Downgrade | Underperform | 2025-10-13 |
| Deutsche Bank | Maintain | Buy | 2025-08-06 |
| Morgan Stanley | Maintain | Equal Weight | 2025-08-06 |
| Wedbush | Maintain | Outperform | 2025-08-06 |
Overall, GLOBALFOUNDRIES exhibits mixed grades with recent downgrades and several holds, reflecting cautious sentiment among analysts.
Microchip Technology Incorporated Grades
Below is a summary of recent grades from credible grading companies for Microchip Technology Incorporated.
| Grading Company | Action | New Grade | Date |
|---|---|---|---|
| Cantor Fitzgerald | Upgrade | Overweight | 2025-12-16 |
| B of A Securities | Maintain | Neutral | 2025-12-05 |
| Needham | Maintain | Buy | 2025-12-04 |
| Rosenblatt | Maintain | Buy | 2025-12-03 |
| Wells Fargo | Maintain | Equal Weight | 2025-11-07 |
| Citigroup | Maintain | Buy | 2025-11-07 |
| Cantor Fitzgerald | Maintain | Neutral | 2025-11-07 |
| Stifel | Maintain | Buy | 2025-11-07 |
| Truist Securities | Maintain | Hold | 2025-11-07 |
| Needham | Maintain | Buy | 2025-11-07 |
Microchip Technology displays predominantly positive grades, including multiple buy ratings and a recent upgrade, indicating favorable analyst views.
Which company has the best grades?
Microchip Technology Incorporated has generally received better grades than GLOBALFOUNDRIES Inc., with more buy and overweight ratings versus GLOBALFOUNDRIES’ neutral and underperform grades. This suggests stronger analyst confidence in Microchip’s prospects, which may influence investor sentiment and portfolio decisions.
Strengths and Weaknesses
Below is a comparison table highlighting key strengths and weaknesses of GLOBALFOUNDRIES Inc. (GFS) and Microchip Technology Incorporated (MCHP) based on their latest financial and operational metrics:
| Criterion | GLOBALFOUNDRIES Inc. (GFS) | Microchip Technology Inc. (MCHP) |
|---|---|---|
| Diversification | Moderate: Primarily Water Fabrication (6.1B USD in 2024), some Engineering Services (652M USD) | Moderate: Dominated by Semiconductor Products (4.3B USD in FY 2025), small Licensing segment (131M USD) |
| Profitability | Low: Negative net margin (-3.93%), ROIC -2.26%, shedding value but ROIC improving | Low: Near zero net margin (-0.01%), ROIC slightly negative (-0.03%), declining profitability |
| Innovation | Moderate: Growing ROIC trend suggests improving efficiency and potential innovation gains | Weak: Declining ROIC trend suggests challenges in sustaining competitive edge |
| Global presence | Strong: Large scale fabrication operations globally | Strong: Well-known semiconductor player with global market reach |
| Market Share | Significant in semiconductor fabrication, but facing value destruction | Established in semiconductor products, but profitability challenges impact growth |
Key takeaway: Both companies currently face profitability challenges with negative returns on invested capital. GLOBALFOUNDRIES shows signs of operational improvement with a growing ROIC trend, while Microchip’s profitability is declining. Investors should weigh GFS’s improving efficiency against MCHP’s market position but weakening financial health.
Risk Analysis
Below is a comparative table outlining key risks for GLOBALFOUNDRIES Inc. (GFS) and Microchip Technology Incorporated (MCHP) based on the most recent financial and market data:
| Metric | GLOBALFOUNDRIES Inc. (GFS) | Microchip Technology Inc. (MCHP) |
|---|---|---|
| Market Risk | High beta 1.48 indicates above-average volatility | High beta 1.46, similar elevated volatility |
| Debt level | Low debt-to-equity at 0.22, low debt-to-assets 13.8% | Moderate debt-to-equity 0.8, debt-to-assets 36.9% |
| Regulatory Risk | Moderate, semiconductor industry faces export controls | Moderate, global regulatory complexities in tech sector |
| Operational Risk | Negative net margin (-3.93%), low asset turnover | Nearly break-even net margin (-0.01%), low asset turnover |
| Environmental Risk | Standard for semiconductor fabs; energy and waste management critical | Similar industry exposure with focus on embedded systems |
| Geopolitical Risk | US-based but global supply chain exposure | US-based with significant international operations |
The most impactful risks are operational and market risks for both companies. GFS struggles with profitability and operational efficiency, reflected in unfavorable returns and coverage ratios, increasing financial vulnerability despite low debt. MCHP shows better financial stability but carries higher debt and faces weak profitability trends. Geopolitical tensions and semiconductor industry regulations continue to pose moderate risks. Investors should weigh operational performance and financial leverage carefully in risk management.
Which Stock to Choose?
GLOBALFOUNDRIES Inc. (GFS) shows a mixed income evolution with overall growth but recent declines, unfavorable net margin and ROE, low debt levels, and a C+ rating indicating moderate financial standing despite some operational challenges.
Microchip Technology Incorporated (MCHP) reveals a declining income trend, slightly unfavorable net margin and ROE, higher debt ratios, but a C- rating reflecting very favorable overall financial scores, albeit with risks linked to profitability and leverage.
Investors seeking companies with improving profitability and lower debt might find GFS’s growing ROIC and moderate rating more appealing, while those tolerant of higher leverage with a focus on market valuation metrics could interpret MCHP’s profile as slightly unfavorable but potentially interesting.
Disclaimer: Investment carries a risk of loss of initial capital. The past performance is not a reliable indicator of future results. Be sure to understand risks before making an investment decision.
Go Further
I encourage you to read the complete analyses of GLOBALFOUNDRIES Inc. and Microchip Technology Incorporated to enhance your investment decisions: