Home > Comparison > Technology > GFS vs MXL
The strategic rivalry between GLOBALFOUNDRIES Inc. and MaxLinear, Inc. shapes the semiconductor industry’s future. GLOBALFOUNDRIES operates a capital-intensive foundry model, manufacturing integrated circuits at scale. MaxLinear focuses on high-margin, mixed-signal SoC solutions for communications infrastructure. This head-to-head pits industrial scale against specialized innovation. This analysis will reveal which corporate path offers a superior risk-adjusted return for diversified portfolios amid evolving tech demands.
Table of contents
Companies Overview
GLOBALFOUNDRIES and MaxLinear are key players shaping the semiconductor industry landscape in 2026.
GLOBALFOUNDRIES Inc.: Semiconductor Foundry Powerhouse
GLOBALFOUNDRIES dominates as a semiconductor foundry, manufacturing integrated circuits crucial for electronic devices worldwide. Its core revenue stems from fabricating microprocessors, RF modems, and power management units. In 2026, the company’s strategic focus sharpens on enhancing wafer fabrication technologies to meet evolving industry demands and maintain its competitive edge.
MaxLinear, Inc.: Communications SoC Innovator
MaxLinear leads in providing high-performance analog and mixed-signal SoCs for connected homes and infrastructure. It generates revenue by integrating RF, digital processing, and power management in communication systems. The 2026 strategy emphasizes end-to-end platform solutions, targeting broadband modems, 4G/5G infrastructure, and fiber-optic networks to capitalize on growing connectivity needs.
Strategic Collision: Similarities & Divergences
Both companies prioritize semiconductor technologies but diverge in their business models: GLOBALFOUNDRIES focuses on foundry services, while MaxLinear develops integrated SoCs. Their primary battleground is the expanding market for communication and computing chips. GLOBALFOUNDRIES offers scale and manufacturing expertise; MaxLinear delivers specialized system solutions, defining distinct investment profiles in the semiconductor sector.
Income Statement Comparison
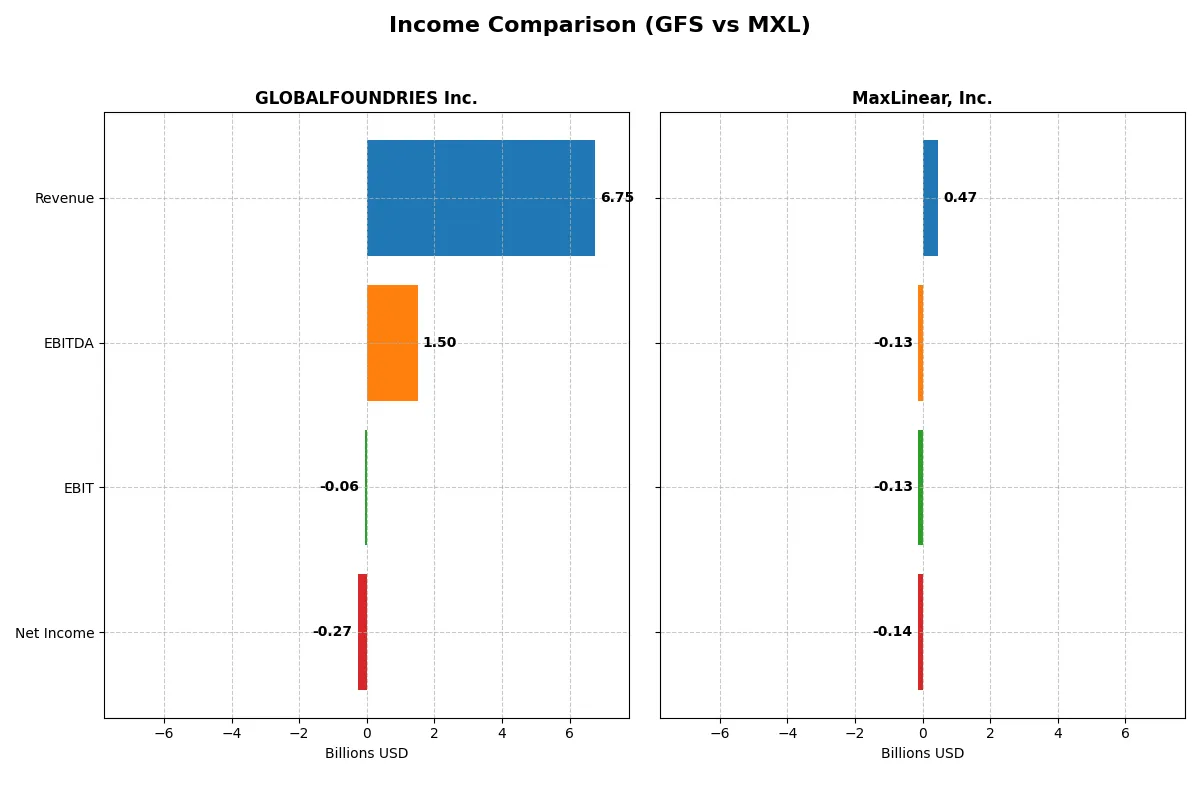
This data dissects the core profitability and scalability of both corporate engines to reveal who dominates the bottom line:
| Metric | GLOBALFOUNDRIES Inc. (GFS) | MaxLinear, Inc. (MXL) |
|---|---|---|
| Revenue | 6.75B | 467.6M |
| Cost of Revenue | 5.10B | 201.8M |
| Operating Expenses | 1.87B | 392.7M |
| Gross Profit | 1.65B | 265.8M |
| EBITDA | 1.50B | -130.8M |
| EBIT | -64.0M | -130.8M |
| Interest Expense | 145.0M | 10.1M |
| Net Income | -265.0M | -136.7M |
| EPS | -0.48 | -1.58 |
| Fiscal Year | 2024 | 2025 |
Income Statement Analysis: The Bottom-Line Duel
This income statement comparison reveals which company operates with greater efficiency and financial momentum in their core business engines.
GLOBALFOUNDRIES Inc. Analysis
GLOBALFOUNDRIES shows mixed results with revenue declining 8.7% to 6.75B in 2024 from 7.39B in 2023. Gross margin remains favorable at 24.5%, but net income swung to a loss of -265M in 2024 from a 1.02B profit in 2023, indicating margin pressure and deteriorating profitability. The recent negative EBIT and net margin signal operational challenges and shrinking bottom-line efficiency.
MaxLinear, Inc. Analysis
MaxLinear’s revenue climbed 29.7% to 468M in 2025, recovering from a trough in prior years. Gross margin is strong at 56.8%, yet the company reported a net loss of -137M in 2025, though improving from -245M in 2024. EBIT and net margin remain negative but show solid improvement, reflecting operational momentum despite ongoing profitability hurdles.
Verdict: Margin Strength vs. Scale Challenges
GLOBALFOUNDRIES commands larger revenue and has shown long-term growth, but recent earnings deterioration raises caution. MaxLinear excels in margin quality and recent revenue growth but struggles with sustained profitability. Investors prioritizing scale might lean toward GLOBALFOUNDRIES, while those valuing margin recovery and growth momentum may find MaxLinear’s profile more compelling.
Financial Ratios Comparison
These vital ratios act as a diagnostic tool to expose the underlying fiscal health, valuation premiums, and capital efficiency of the companies compared below:
| Ratios | GLOBALFOUNDRIES Inc. (GFS) | MaxLinear, Inc. (MXL) |
|---|---|---|
| ROE | -2.46% | -47.49% |
| ROIC | -1.47% | -24.31% |
| P/E | -89.54 | -6.74 |
| P/B | 2.20 | 3.20 |
| Current Ratio | 2.11 | 1.77 |
| Quick Ratio | 1.57 | 1.28 |
| D/E (Debt-to-Equity) | 0.22 | 0.29 |
| Debt-to-Assets | 13.81% | 17.23% |
| Interest Coverage | -1.48 | -15.52 |
| Asset Turnover | 0.40 | 0.42 |
| Fixed Asset Turnover | 0.82 | 4.65 |
| Payout ratio | 0 | 0 |
| Dividend yield | 0 | 0 |
| Fiscal Year | 2024 | 2024 |
Efficiency & Valuation Duel: The Vital Signs
Ratios act as a company’s DNA, uncovering hidden risks and operational strengths that raw numbers alone cannot reveal.
GLOBALFOUNDRIES Inc.
GLOBALFOUNDRIES shows weak profitability with a negative ROE of -2.46% and net margin of -3.93%, signaling operational challenges. Its valuation appears attractive, indicated by a favorable negative P/E, but the P/B ratio remains neutral at 2.2. The company does not pay dividends, focusing instead on maintaining a solid current ratio of 2.11 and conservative debt levels.
MaxLinear, Inc.
MaxLinear suffers from severe profitability deficits, with a ROE of -47.49% and net margin at -68.01%, reflecting considerable operational distress. Despite a favorable negative P/E, its valuation is stretched with a high P/B of 3.2. The firm pays no dividends and invests heavily in R&D, as indicated by a significant research-to-revenue ratio, while maintaining a decent current ratio of 1.77.
Profitability Struggles Amid Valuation Gaps
Both firms struggle with negative profitability and unfavorable global ratio evaluations, but GLOBALFOUNDRIES offers a more balanced risk profile with better liquidity and moderate leverage. MaxLinear’s valuation appears stretched given its deeper losses. Investors prioritizing operational stability might lean toward GLOBALFOUNDRIES, while those tolerating risk for growth exposure may consider MaxLinear’s profile.
Which one offers the Superior Shareholder Reward?
GLOBALFOUNDRIES (GFS) and MaxLinear (MXL) both skip dividends, focusing on reinvestment and buybacks. GFS’s free cash flow per share is positive at 1.98 in 2024, supporting moderate buybacks within a stable capital structure (debt/equity 0.22). MXL’s 2024 free cash flow is negative (-0.75), reflecting heavy reinvestment amid persistent losses and weaker cash flow. MXL’s debt ratios are higher and operating cash flow negative, signaling risk. GFS maintains a stronger balance sheet and operating cash flow, enabling sustainable buybacks that enhance shareholder value. I conclude GFS offers a superior total return profile in 2026 due to disciplined capital allocation and sustainable buybacks.
Comparative Score Analysis: The Strategic Profile
The radar chart reveals the fundamental DNA and trade-offs of GLOBALFOUNDRIES Inc. and MaxLinear, Inc., highlighting their financial strengths and weaknesses side by side:
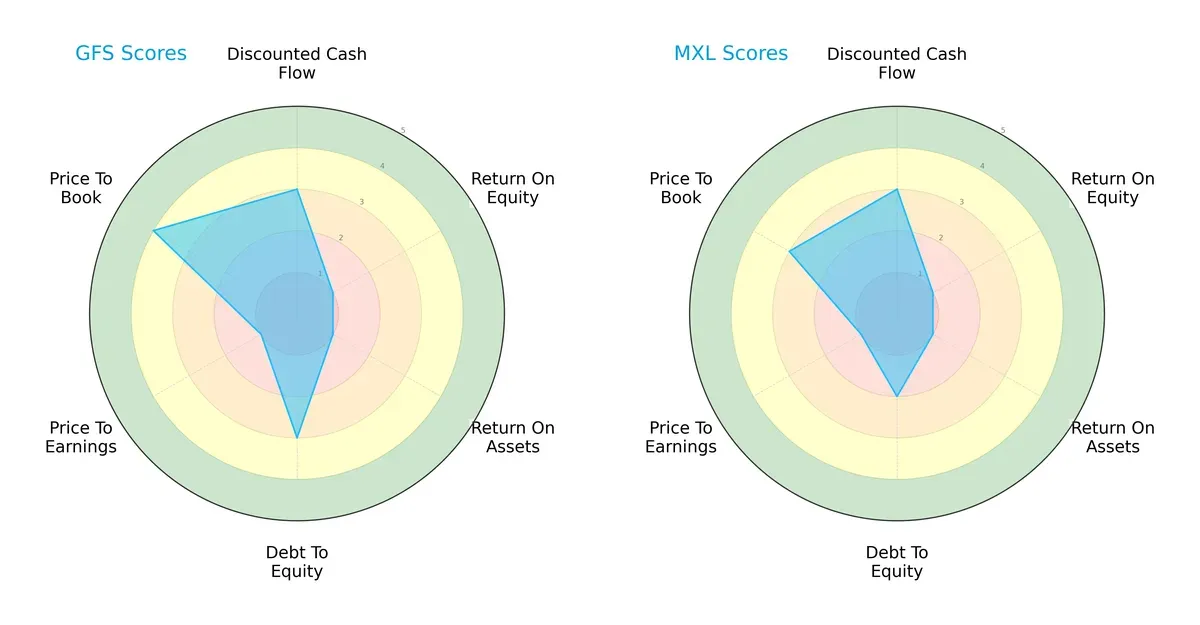
GLOBALFOUNDRIES shows a more balanced profile with moderate DCF and debt-to-equity scores, and a favorable price-to-book ratio. MaxLinear relies on a slightly lower debt-to-equity score but both firms share very unfavorable returns on equity and assets. GLOBALFOUNDRIES edges ahead on valuation metrics.
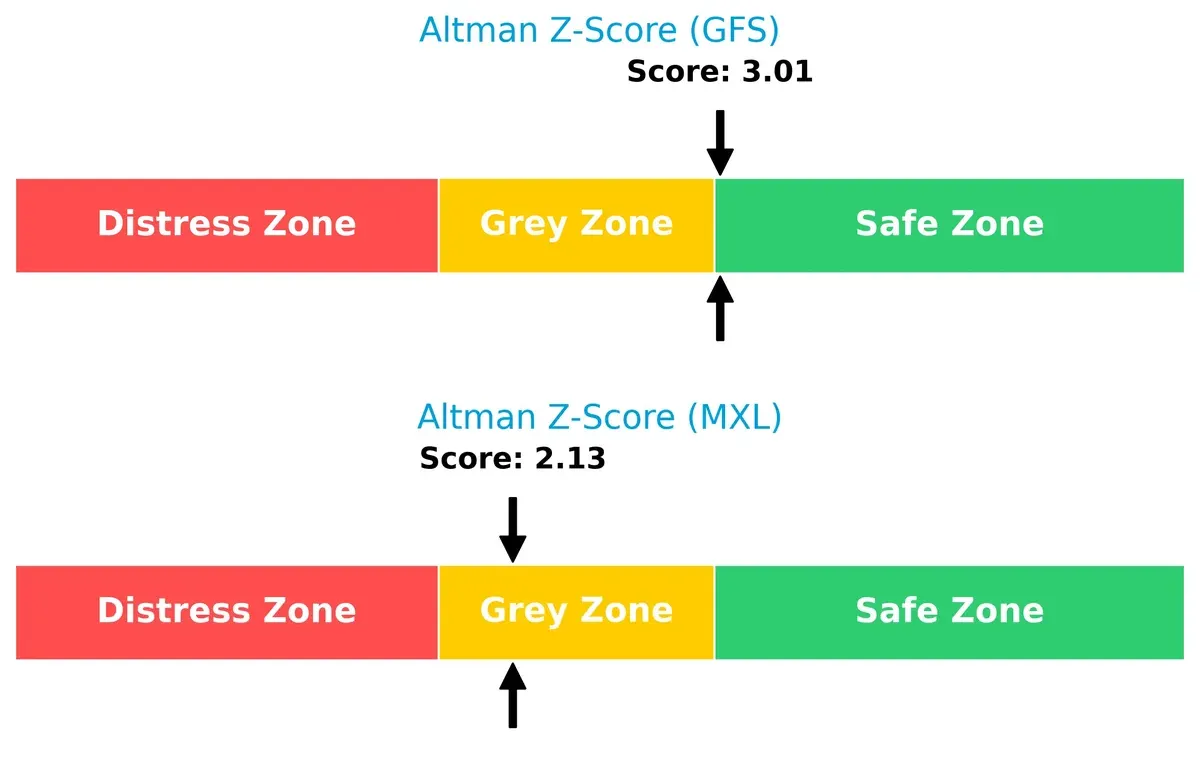
Bankruptcy Risk: Solvency Showdown
GLOBALFOUNDRIES’s Altman Z-Score of 3.01 places it safely above bankruptcy risk, while MaxLinear’s 2.13 score lands in the grey zone, signaling moderate financial distress risk in this cycle:
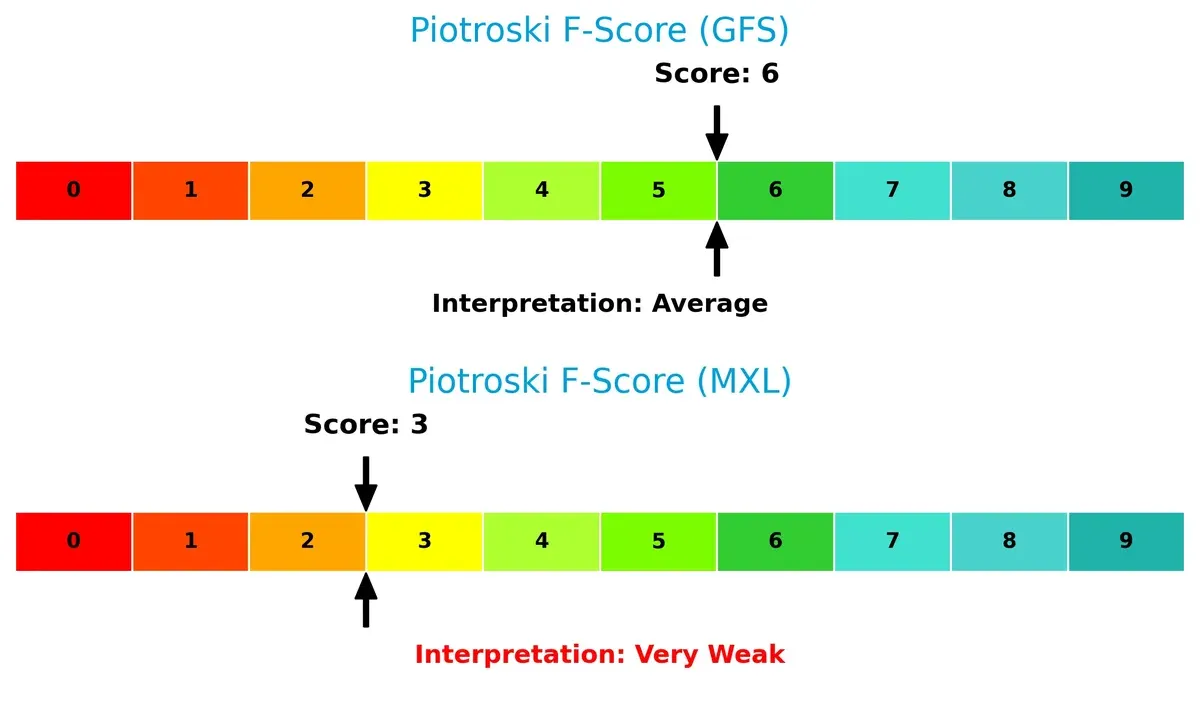
Financial Health: Quality of Operations
GLOBALFOUNDRIES’s Piotroski F-Score of 6 indicates average financial health, whereas MaxLinear’s 3 flags potential operational weaknesses and red flags in internal metrics:
How are the two companies positioned?
This section dissects the operational DNA of GFS and MXL by comparing their revenue distribution and internal dynamics. The goal is to confront their economic moats and identify which model offers the most resilient advantage.
Revenue Segmentation: The Strategic Mix
This comparison dissects how GLOBALFOUNDRIES Inc. and MaxLinear, Inc. diversify income streams and where their primary sector bets lie:
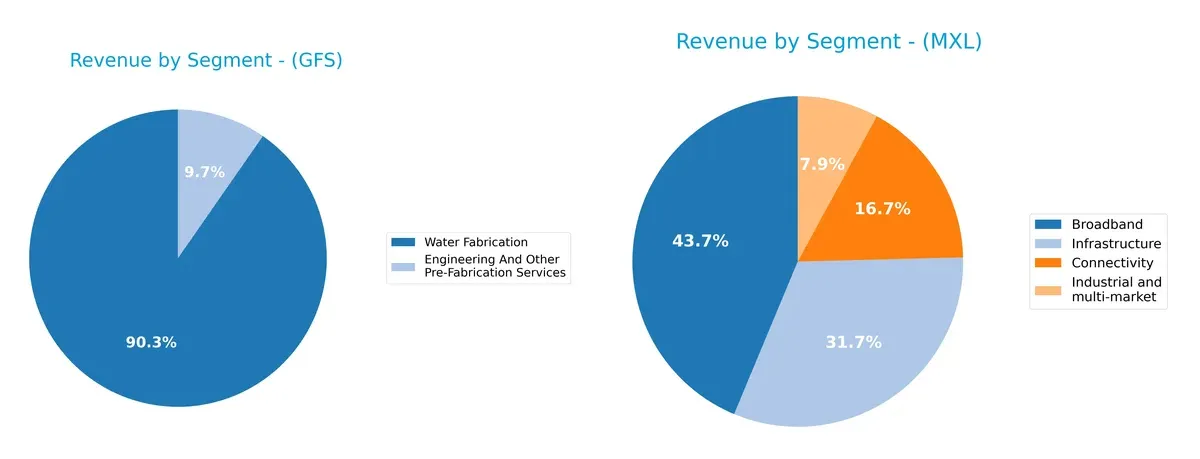
GLOBALFOUNDRIES anchors its revenue in Water Fabrication with $6.1B in 2024, dwarfing its $652M Engineering services. MaxLinear presents a more balanced mix, with Broadband at $204M and Infrastructure close behind at $148M. GLOBALFOUNDRIES’ concentration signals infrastructure dominance but exposes concentration risk. MaxLinear’s diversified segments suggest resilience through varied markets, reducing dependency on a single business line.
Strengths and Weaknesses Comparison
This table compares the Strengths and Weaknesses of GLOBALFOUNDRIES Inc. (GFS) and MaxLinear, Inc. (MXL):
GFS Strengths
- Diversified revenue with strong Water Fabrication segment
- Favorable liquidity ratios with current ratio of 2.11
- Low debt-to-assets ratio at 13.8%
- Positive price-to-earnings metric
- Significant U.S. and EMEA geographic presence
MXL Strengths
- Diverse product segments including Broadband and Infrastructure
- Favorable fixed asset turnover at 4.65
- Good liquidity with current ratio of 1.77
- Favorable price-to-earnings despite losses
- Moderate debt-to-assets ratio at 17.2%
GFS Weaknesses
- Negative profitability metrics: net margin -3.93%, ROE -2.46%
- Unfavorable return on invested capital below WACC
- Low asset and fixed asset turnover ratios
- Negative interest coverage
- No dividend yield
- Limited diversification beyond two main segments
MXL Weaknesses
- Very weak profitability with net margin -68% and ROE -47%
- Negative return on invested capital far below WACC
- Unfavorable price-to-book ratio at 3.2
- Negative interest coverage ratio
- No dividend yield
- Geographic concentration primarily in Asia and limited U.S. presence
Both companies face considerable profitability challenges, reflected in negative returns and interest coverage. GFS benefits from stronger liquidity and geographic diversification, while MXL shows operational efficiency in fixed asset use but suffers from severe profitability and geographic concentration risks. These factors highlight strategic priorities around improving profitability and managing financial risk.
The Moat Duel: Analyzing Competitive Defensibility
A structural moat is the only thing protecting long-term profits from relentless competition and market erosion. Let’s dissect these firms’ moats:
GLOBALFOUNDRIES Inc. (GFS): Manufacturing Scale with Improving Profitability
GFS relies on a cost advantage moat driven by its large-scale semiconductor foundry operations. Its ROIC is rising despite still falling short of WACC, signaling improving efficiency. New tech nodes and expanded capacity in 2026 could deepen this edge.
MaxLinear, Inc. (MXL): Integrated SoC Innovation Facing Profit Pressure
MXL’s moat stems from intangible assets—proprietary mixed-signal SoCs integrating RF and communications tech. However, its ROIC is declining sharply below WACC, reflecting eroding profitability. Growth in 5G infrastructure offers upside but risks disruption.
Capital Efficiency vs. Technological Integration: Who Holds the Stronger Moat?
GFS shows a wider moat with improving capital returns and scale advantages, while MXL’s moat weakens amid profitability declines. GFS is better positioned to defend market share through operational leverage and cost leadership.
Which stock offers better returns?
Over the past year, both GLOBALFOUNDRIES Inc. and MaxLinear, Inc. experienced significant bearish trends, with recent periods showing notable price recoveries but differing buyer-seller dynamics.
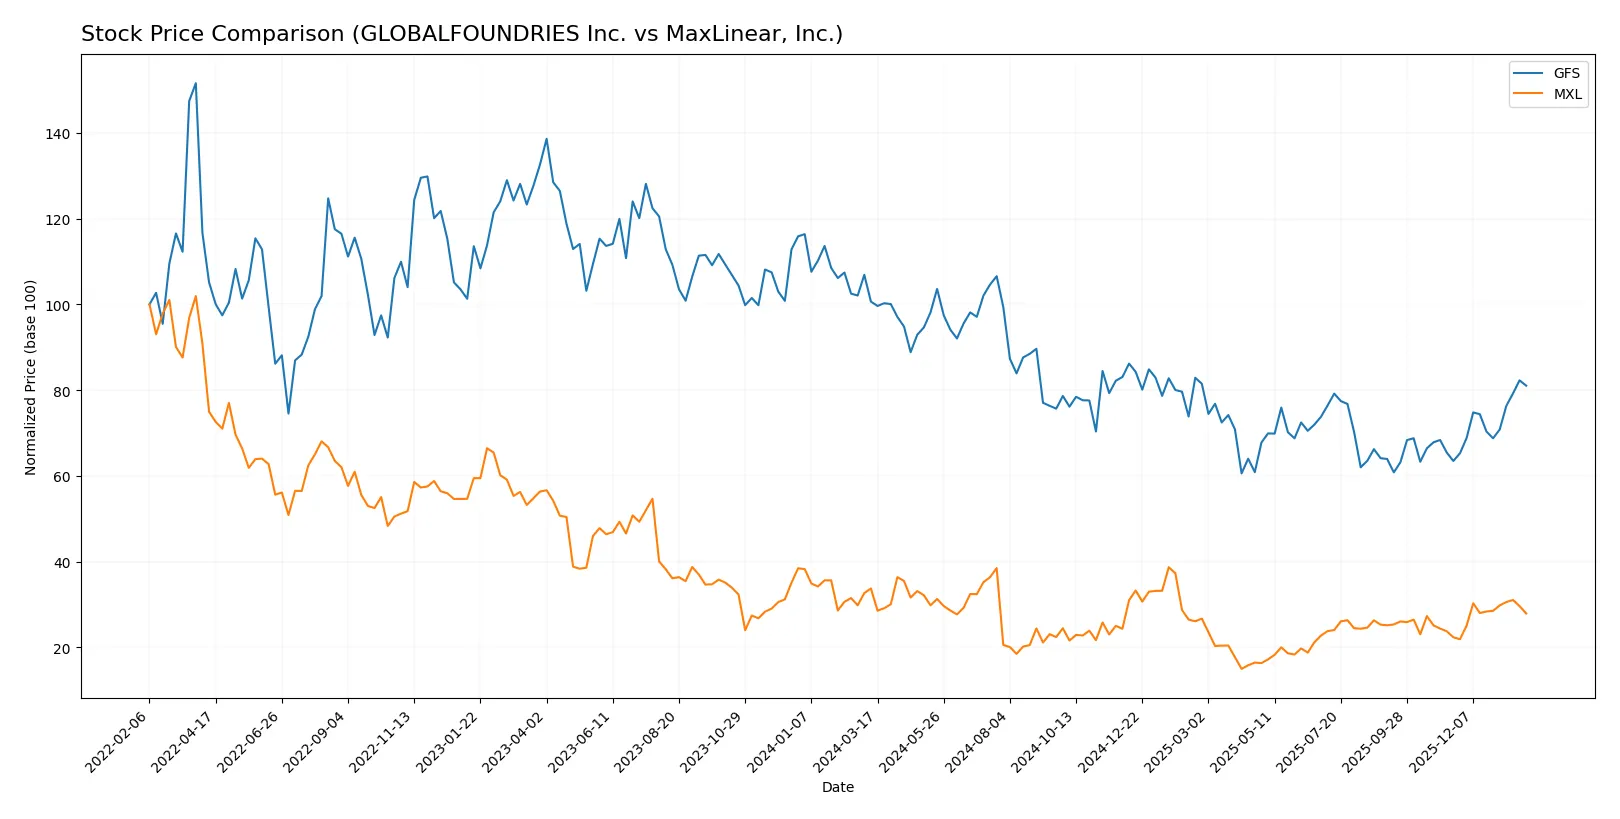
Trend Comparison
GLOBALFOUNDRIES Inc. fell 19.48% over the past year, marking a bearish trend with accelerating decline and high volatility, hitting a low of 31.54 and a high of 55.5. Recently, it rebounded 27.69%.
MaxLinear, Inc. declined 17.26% this year, also bearish with accelerating losses but lower volatility than GLOBALFOUNDRIES. The stock bounced back 24.82% in the latest period.
GLOBALFOUNDRIES showed a slightly stronger recent recovery but a deeper overall drop. It delivered a lower market performance across the full year compared to MaxLinear.
Target Prices
Analysts present a cautious consensus on target prices for GLOBALFOUNDRIES Inc. and MaxLinear, Inc.
| Company | Target Low | Target High | Consensus |
|---|---|---|---|
| GLOBALFOUNDRIES Inc. | 37 | 40 | 38.5 |
| MaxLinear, Inc. | 15 | 25 | 21 |
GLOBALFOUNDRIES trades slightly above its consensus target, indicating possible overvaluation or high current momentum. MaxLinear’s consensus target sits well above its current price, suggesting upside potential amid recent weakness.

Don’t Let Luck Decide Your Entry Point
Optimize your entry points with our advanced ProRealTime indicators. You’ll get efficient buy signals with precise price targets for maximum performance. Start outperforming now!
How do institutions grade them?
GLOBALFOUNDRIES Inc. Grades
The latest grades from major institutions for GLOBALFOUNDRIES Inc. are summarized below:
| Grading Company | Action | New Grade | Date |
|---|---|---|---|
| Citigroup | Maintain | Neutral | 2026-01-15 |
| Wedbush | Downgrade | Neutral | 2025-12-31 |
| B of A Securities | Maintain | Underperform | 2025-12-04 |
| Citigroup | Maintain | Neutral | 2025-11-13 |
| Evercore ISI Group | Maintain | Outperform | 2025-11-13 |
| JP Morgan | Maintain | Neutral | 2025-11-13 |
| Wedbush | Maintain | Outperform | 2025-11-13 |
| B of A Securities | Downgrade | Underperform | 2025-10-13 |
| Wedbush | Maintain | Outperform | 2025-08-06 |
| Morgan Stanley | Maintain | Equal Weight | 2025-08-06 |
MaxLinear, Inc. Grades
The recent institutional grades for MaxLinear, Inc. are presented in the following table:
| Grading Company | Action | New Grade | Date |
|---|---|---|---|
| Wells Fargo | Maintain | Equal Weight | 2026-01-30 |
| Benchmark | Maintain | Buy | 2026-01-16 |
| Benchmark | Maintain | Buy | 2025-10-24 |
| Benchmark | Maintain | Buy | 2025-10-17 |
| Benchmark | Maintain | Buy | 2025-09-02 |
| Loop Capital | Maintain | Hold | 2025-08-04 |
| Wells Fargo | Maintain | Equal Weight | 2025-07-24 |
| Benchmark | Maintain | Buy | 2025-07-24 |
| Susquehanna | Maintain | Neutral | 2025-07-24 |
| Susquehanna | Maintain | Neutral | 2025-07-22 |
Which company has the best grades?
MaxLinear, Inc. consistently earns Buy and Equal Weight ratings from Benchmark and Wells Fargo. GLOBALFOUNDRIES shows a mixed profile with Neutral and Underperform grades, offset by some Outperform ratings. This difference may influence investor confidence and portfolio decisions based on risk tolerance.
Risks specific to each company
The following categories identify critical pressure points and systemic threats facing GLOBALFOUNDRIES Inc. and MaxLinear, Inc. in the 2026 market environment:
1. Market & Competition
GLOBALFOUNDRIES Inc.
- Faces intense semiconductor industry rivalry with large-cap competitors and rapid tech shifts.
MaxLinear, Inc.
- Operates in niche RF and mixed-signal chip markets but with smaller scale and pricing pressure.
2. Capital Structure & Debt
GLOBALFOUNDRIES Inc.
- Maintains low debt-to-equity (0.22) and manageable leverage, supporting financial flexibility.
MaxLinear, Inc.
- Slightly higher debt-to-equity (0.29) and elevated debt-to-assets ratio increase financial risk.
3. Stock Volatility
GLOBALFOUNDRIES Inc.
- Beta of 1.485 indicates moderate sensitivity to market swings, typical for semiconductors.
MaxLinear, Inc.
- Higher beta at 1.77 signals greater stock price volatility and investor risk exposure.
4. Regulatory & Legal
GLOBALFOUNDRIES Inc.
- Subject to global trade regulations and export controls impacting semiconductor supply chains.
MaxLinear, Inc.
- Faces compliance challenges in communications and RF markets amid evolving telecom standards.
5. Supply Chain & Operations
GLOBALFOUNDRIES Inc.
- Large-scale wafer fabrication operations vulnerable to raw material shortages and geopolitical disruption.
MaxLinear, Inc.
- Smaller scale operations but reliant on third-party manufacturers, exposing supply chain fragility.
6. ESG & Climate Transition
GLOBALFOUNDRIES Inc.
- Increasing pressure to reduce carbon footprint in energy-intensive semiconductor manufacturing.
MaxLinear, Inc.
- ESG initiatives less mature; risk of lagging behind peers in sustainability standards.
7. Geopolitical Exposure
GLOBALFOUNDRIES Inc.
- Significant exposure to US-China tensions affecting semiconductor technology and export controls.
MaxLinear, Inc.
- Limited direct exposure but dependent on global telecom infrastructure markets subject to geopolitical risks.
Which company shows a better risk-adjusted profile?
GLOBALFOUNDRIES’ manageable leverage and stronger Altman Z-score (3.01, safe zone) suggest better financial resilience. MaxLinear’s higher stock volatility, weaker Piotroski score (3, very weak), and deeper profitability losses indicate elevated risk. The greatest risk for GLOBALFOUNDRIES is intense market competition pressuring margins. For MaxLinear, poor profitability and operational leverage pose the largest threats. GLOBALFOUNDRIES shows a superior risk-adjusted profile, supported by its safer financial footing and lower beta despite industry headwinds.
Final Verdict: Which stock to choose?
GLOBALFOUNDRIES Inc. (GFS) showcases a remarkable resilience in operational efficiency, with a strong balance sheet and improving profitability trends. Its main point of vigilance lies in value destruction indicated by a negative ROIC versus WACC, suggesting cautious capital allocation. GFS fits well in a portfolio seeking cyclical exposure with growth potential.
MaxLinear, Inc. (MXL) leans on its strategic moat of high R&D intensity and niche semiconductor positioning, offering recurring revenue potential. Relative to GFS, it presents a higher risk profile with deteriorating profitability and a weaker capital efficiency trend. MXL suits investors looking for speculative growth with a tolerance for volatility.
If you prioritize operational resilience and improving profitability within a capital-intensive industry, GLOBALFOUNDRIES outshines due to its stronger financial footing and upward ROIC trend. However, if you seek aggressive growth driven by innovation and can absorb earnings volatility, MaxLinear could offer superior exposure albeit with higher risk and less financial stability.
Disclaimer: Investment carries a risk of loss of initial capital. The past performance is not a reliable indicator of future results. Be sure to understand risks before making an investment decision.
Go Further
I encourage you to read the complete analyses of GLOBALFOUNDRIES Inc. and MaxLinear, Inc. to enhance your investment decisions: