In the rapidly evolving semiconductor industry, Marvell Technology, Inc. (MRVL) and GLOBALFOUNDRIES Inc. (GFS) stand out as key players driving innovation and market growth. While Marvell focuses on designing integrated circuits and advanced storage solutions, GLOBALFOUNDRIES specializes in wafer fabrication and manufacturing services. This comparison explores their market strategies and potential, helping you decide which company might be the most promising addition to your portfolio.
Table of contents
Companies Overview
I will begin the comparison between Marvell Technology, Inc. and GLOBALFOUNDRIES Inc. by providing an overview of these two companies and their main differences.
Marvell Technology, Inc. Overview
Marvell Technology, Inc. designs, develops, and sells a broad portfolio of integrated circuits, including Ethernet solutions, processors, ASICs, and storage controllers supporting various interfaces like SAS, SATA, and NVMe. Founded in 1995 and headquartered in Wilmington, Delaware, Marvell serves global markets with operations across Asia and the US, positioning itself as a key player in analog and digital semiconductor solutions.
GLOBALFOUNDRIES Inc. Overview
GLOBALFOUNDRIES Inc., founded in 2009 and based in Malta, New York, operates as a semiconductor foundry providing wafer fabrication services globally. It manufactures a variety of semiconductor devices such as microprocessors, network processors, and power management units, enabling numerous electronic applications. With a workforce of 13,000, the company focuses on manufacturing technologies rather than integrated circuit design.
Key similarities and differences
Both Marvell and GLOBALFOUNDRIES operate in the semiconductor industry, listed on NASDAQ, and serve global technology markets. However, Marvell primarily designs and sells semiconductor products, while GLOBALFOUNDRIES specializes in foundry services and wafer fabrication. Marvell has a smaller workforce of 7,042 compared to GLOBALFOUNDRIES’ 13,000 employees, reflecting their differing business models in design versus manufacturing.
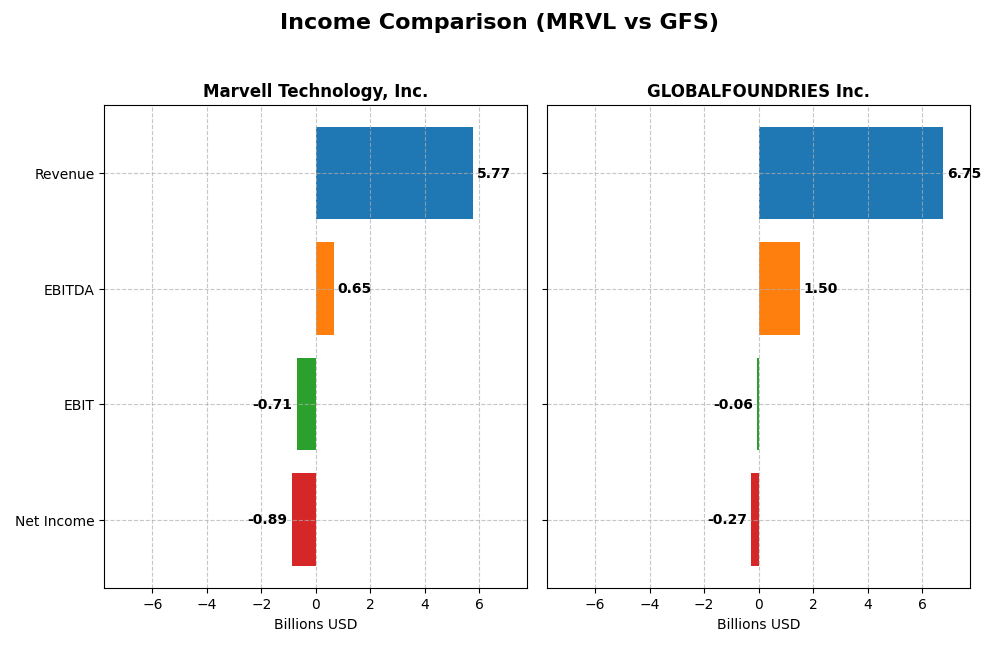
Income Statement Comparison
The table below presents a side-by-side comparison of key income statement metrics for Marvell Technology, Inc. and GLOBALFOUNDRIES Inc. for their most recent fiscal years.
| Metric | Marvell Technology, Inc. (MRVL) | GLOBALFOUNDRIES Inc. (GFS) |
|---|---|---|
| Market Cap | 69.3B | 23.0B |
| Revenue | 5.77B | 6.75B |
| EBITDA | 652M | 1.50B |
| EBIT | -705M | -64M |
| Net Income | -885M | -265M |
| EPS | -1.02 | -0.48 |
| Fiscal Year | 2025 | 2024 |
Income Statement Interpretations
Marvell Technology, Inc.
Marvell’s revenue nearly doubled from 2021 to 2025, showing strong top-line growth. However, net income declined significantly, with persistent negative earnings and deteriorating margins. The gross margin remained favorable at 41.31%, but EBIT and net margins were negative in 2025. The recent year showed a slight revenue increase but worsening EBIT and operating income, signaling margin pressure.
GLOBALFOUNDRIES Inc.
GLOBALFOUNDRIES experienced modest overall revenue growth from 2020 to 2024, but net income showed improvement with a positive trend over the period. Gross margin was stable but lower than Marvell’s at 24.46%, while EBIT and net margins remained negative in 2024. The latest year showed declines in revenue, gross profit, and profitability metrics, indicating a challenging operating environment.
Which one has the stronger fundamentals?
Both companies display unfavorable global income statement evaluations with margin pressures and recent earnings challenges. Marvell shows stronger revenue growth and a higher gross margin but deeper net losses and margin deterioration. GLOBALFOUNDRIES has steadier net income improvements over time but faces recent margin contraction and revenue declines. Neither company demonstrates robust profitability or margin stability as of the latest fiscal years.
Financial Ratios Comparison
Below is a comparison of key financial ratios for Marvell Technology, Inc. and GLOBALFOUNDRIES Inc. based on their most recent fiscal year data.
| Ratios | Marvell Technology, Inc. (MRVL) 2025 | GLOBALFOUNDRIES Inc. (GFS) 2024 |
|---|---|---|
| ROE | -6.6% | -2.5% |
| ROIC | -3.9% | -1.5% |
| P/E | -110.4 | -89.5 |
| P/B | 7.27 | 2.20 |
| Current Ratio | 1.54 | 2.11 |
| Quick Ratio | 1.03 | 1.57 |
| D/E (Debt-to-Equity) | 0.32 | 0.22 |
| Debt-to-Assets | 21.5% | 13.8% |
| Interest Coverage | -3.8 | -1.48 |
| Asset Turnover | 0.29 | 0.40 |
| Fixed Asset Turnover | 5.56 | 0.82 |
| Payout Ratio | -23.4% | 0% |
| Dividend Yield | 0.21% | 0% |
Interpretation of the Ratios
Marvell Technology, Inc.
Marvell shows mixed results with 42.86% favorable and 57.14% unfavorable ratios, reflecting weaknesses in net margin (-15.35%), ROE (-6.59%), and interest coverage (-3.72). The current and quick ratios are solid at 1.54 and 1.03 respectively. Marvell pays dividends with a low yield of 0.21%, suggesting cautious shareholder returns amid some financial stress.
GLOBALFOUNDRIES Inc.
GLOBALFOUNDRIES has 35.71% favorable and 57.14% unfavorable ratios, indicating challenges in profitability with a net margin of -3.93% and negative ROE. Liquidity ratios are strong, with a current ratio of 2.11 and quick ratio of 1.57. The company does not pay dividends, likely focusing on reinvestment and growth rather than shareholder payouts.
Which one has the best ratios?
Both companies face unfavorable profitability and coverage ratios, yet Marvell holds a slight edge with better liquidity and leverage metrics. GLOBALFOUNDRIES shows stronger liquidity but weaker asset turnover and fixed asset efficiency. Overall, both have considerable financial weaknesses, and neither stands out decisively in this ratio comparison.
Strategic Positioning
This section compares the strategic positioning of Marvell Technology, Inc. and GLOBALFOUNDRIES Inc. based on market position, key segments, and exposure to technological disruption:
Marvell Technology, Inc.
- Larger market cap of $69.3B with higher beta of 1.945, facing strong competition in semiconductors.
- Diversified segments: Data Center ($4.16B), Enterprise Networking, Carrier Infrastructure, Automotive, Consumer electronics.
- Designs and sells a broad range of integrated circuits, exposed to disruption from advancements in semiconductor design and networking tech.
GLOBALFOUNDRIES Inc.
- Smaller market cap of $23B with beta 1.485, operating in a competitive semiconductor foundry market.
- Concentrated business mainly in wafer fabrication ($6.1B) and engineering services ($652M).
- Focuses on manufacturing semiconductor devices, with exposure to disruption in wafer fabrication technologies.
Marvell Technology, Inc. vs GLOBALFOUNDRIES Inc. Positioning
Marvell has a diversified business model spanning multiple high-growth segments like data centers and networking, providing varied revenue streams. GLOBALFOUNDRIES concentrates on wafer fabrication and engineering services, which may limit diversification but allows focused expertise in manufacturing.
Which has the best competitive advantage?
Both companies are shedding value as ROIC is below WACC; Marvell’s declining ROIC reflects worsening profitability, while GLOBALFOUNDRIES shows improving ROIC trends despite slightly unfavorable moat status. Neither currently holds a strong competitive advantage based on MOAT evaluation.
Stock Comparison
The stock price movements over the past year reveal contrasting trends, with Marvell Technology, Inc. showing a significant overall gain despite recent losses, while GLOBALFOUNDRIES Inc. experienced a notable decline followed by a recent recovery.
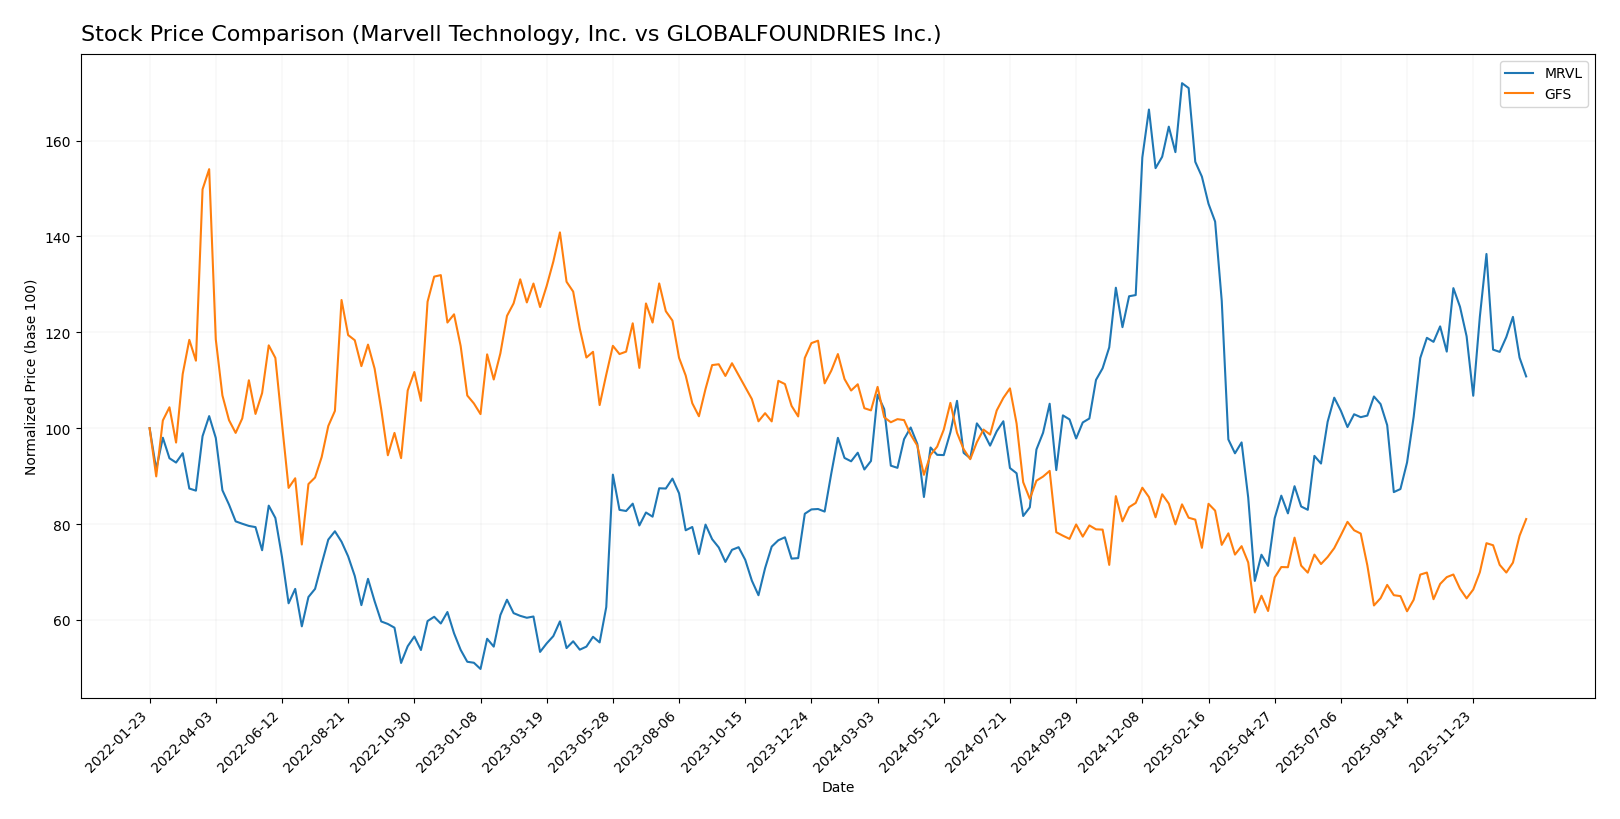
Trend Analysis
Marvell Technology, Inc. exhibited a bullish trend over the past 12 months with an 18.94% price increase, though recent months show a 14.25% decline indicating a deceleration phase. Volatility is relatively high with a standard deviation of 16.46.
GLOBALFOUNDRIES Inc. recorded a bearish trend over the year, declining 21.86% with accelerating losses, but its recent 16.66% gain suggests a potential recovery phase. The stock demonstrated lower volatility, with a standard deviation of 6.45.
Comparing the two, Marvell Technology delivered the highest market performance over the past year despite recent setbacks, whereas GLOBALFOUNDRIES showed overall losses but signs of recent positive momentum.
Target Prices
Analysts provide a clear target price consensus for both Marvell Technology, Inc. and GLOBALFOUNDRIES Inc.
| Company | Target High | Target Low | Consensus |
|---|---|---|---|
| Marvell Technology, Inc. | 156 | 80 | 117 |
| GLOBALFOUNDRIES Inc. | 40 | 37 | 38.5 |
Marvell’s consensus target price of 117 suggests significant upside from its current 80.38 USD, while GLOBALFOUNDRIES’ target of 38.5 is slightly below its current 41.53 USD, indicating a more cautious outlook.
Analyst Opinions Comparison
This section compares analysts’ ratings and grades for Marvell Technology, Inc. (MRVL) and GLOBALFOUNDRIES Inc. (GFS):
Rating Comparison
MRVL Rating
- Rating: B+ indicating a very favorable overall assessment.
- Discounted Cash Flow Score: 3, reflecting moderate valuation based on future cash flows.
- ROE Score: 4, showing favorable efficiency in generating profits from equity.
- ROA Score: 5, a very favorable score indicating effective asset utilization.
- Debt To Equity Score: 2, moderate financial risk with some reliance on debt.
- Overall Score: 3, moderate overall financial standing.
GFS Rating
- Rating: C+ with a moderate overall assessment.
- Discounted Cash Flow Score: 3, also indicating moderate valuation.
- ROE Score: 1, signaling very unfavorable profit generation from equity.
- ROA Score: 1, a very unfavorable rating for asset utilization.
- Debt To Equity Score: 3, moderate financial risk but slightly better debt position.
- Overall Score: 2, moderate but lower overall financial standing than MRVL.
Which one is the best rated?
Based strictly on provided data, MRVL is better rated than GFS, with a higher overall rating (B+ vs C+) and stronger scores in ROE and ROA. GFS shows weaker profitability metrics despite a slightly better debt-to-equity score.
Scores Comparison
Here is a comparison of the Altman Z-Score and Piotroski Score for Marvell Technology and GLOBALFOUNDRIES:
Marvell Technology Scores
- Altman Z-Score: 6.76, in the safe zone indicating low bankruptcy risk.
- Piotroski Score: 7, classified as strong financial health.
GLOBALFOUNDRIES Scores
- Altman Z-Score: 2.61, in the grey zone showing moderate bankruptcy risk.
- Piotroski Score: 6, classified as average financial health.
Which company has the best scores?
Marvell Technology shows stronger financial health with a higher Altman Z-Score in the safe zone and a strong Piotroski Score. GLOBALFOUNDRIES has lower scores, indicating moderate risk and average financial strength.
Grades Comparison
Here is the comparison of recent grades and ratings for Marvell Technology, Inc. and GLOBALFOUNDRIES Inc.:
Marvell Technology, Inc. Grades
The following table summarizes recent grades issued by reputable research firms for Marvell Technology, Inc.:
| Grading Company | Action | New Grade | Date |
|---|---|---|---|
| Rosenblatt | Maintain | Buy | 2026-01-07 |
| Melius Research | Upgrade | Buy | 2026-01-05 |
| Benchmark | Downgrade | Hold | 2025-12-08 |
| B. Riley Securities | Maintain | Buy | 2025-12-03 |
| JP Morgan | Maintain | Overweight | 2025-12-03 |
| Susquehanna | Maintain | Positive | 2025-12-03 |
| Benchmark | Maintain | Buy | 2025-12-03 |
| Oppenheimer | Maintain | Outperform | 2025-12-03 |
| Stifel | Maintain | Buy | 2025-12-03 |
| Rosenblatt | Maintain | Buy | 2025-12-03 |
Marvell Technology’s grades predominantly reflect a positive outlook, with most analysts maintaining or upgrading to Buy or equivalent ratings.
GLOBALFOUNDRIES Inc. Grades
The following table summarizes recent grades issued by reputable research firms for GLOBALFOUNDRIES Inc.:
| Grading Company | Action | New Grade | Date |
|---|---|---|---|
| Wedbush | Downgrade | Neutral | 2025-12-31 |
| B of A Securities | Maintain | Underperform | 2025-12-04 |
| Evercore ISI Group | Maintain | Outperform | 2025-11-13 |
| JP Morgan | Maintain | Neutral | 2025-11-13 |
| Citigroup | Maintain | Neutral | 2025-11-13 |
| Wedbush | Maintain | Outperform | 2025-11-13 |
| B of A Securities | Downgrade | Underperform | 2025-10-13 |
| Deutsche Bank | Maintain | Buy | 2025-08-06 |
| Morgan Stanley | Maintain | Equal Weight | 2025-08-06 |
| Wedbush | Maintain | Outperform | 2025-08-06 |
GLOBALFOUNDRIES shows more mixed ratings, with downgrades to Neutral and Underperform alongside Outperform and Buy ratings, indicating varied analyst sentiment.
Which company has the best grades?
Marvell Technology, Inc. has received generally stronger and more consistent Buy and Outperform grades compared to GLOBALFOUNDRIES Inc., which has mixed ratings including Neutral and Underperform. This difference may affect investor perception of risk and potential returns between the two.
Strengths and Weaknesses
Below is a comparison of key strengths and weaknesses for Marvell Technology, Inc. (MRVL) and GLOBALFOUNDRIES Inc. (GFS) based on recent financial and market data.
| Criterion | Marvell Technology, Inc. (MRVL) | GLOBALFOUNDRIES Inc. (GFS) |
|---|---|---|
| Diversification | Moderate diversification across tech segments: Data Center (4.16B), Enterprise Networking (626M), Carrier Infrastructure (338M) | Less diversified, mainly Water Fabrication (6.1B) and Engineering Services (652M) |
| Profitability | Negative profitability with declining ROIC (-3.88%), negative net margin (-15.35%) | Negative profitability but improving ROIC (-1.47%) and better net margin (-3.93%) |
| Innovation | Strong in data center and networking tech, but value destruction signals caution | Focus on fabrication services, innovation driven by capacity expansion and efficiency improvements |
| Global presence | Strong global reach in high-tech markets | Global foundry services with significant scale but less diversified geographically |
| Market Share | Significant presence in semiconductor data center and networking markets | Major player in semiconductor fabrication but challenged by market profitability |
Key takeaways: Marvell shows strong market presence and diversification in high-growth tech segments but suffers from declining profitability and value destruction. GLOBALFOUNDRIES has a narrower focus with improving profitability trends but remains challenged by overall negative returns. Both require cautious evaluation due to financial weaknesses.
Risk Analysis
Below is a comparative table highlighting key risks for Marvell Technology, Inc. (MRVL) and GLOBALFOUNDRIES Inc. (GFS) based on the most recent data available.
| Metric | Marvell Technology, Inc. (MRVL) | GLOBALFOUNDRIES Inc. (GFS) |
|---|---|---|
| Market Risk | High beta at 1.945 implies elevated market volatility exposure | Moderate beta at 1.485 indicates less volatility than MRVL |
| Debt level | Moderate debt-to-equity ratio of 0.32 with favorable coverage concerns | Lower debt-to-equity ratio of 0.22 but weak interest coverage |
| Regulatory Risk | Exposure to multiple countries including China and Taiwan increases regulatory complexity | US-based with some global operations; moderate regulatory risk |
| Operational Risk | Complex supply chain across Asia; moderate asset turnover (0.29) | Larger workforce and lower asset turnover (0.40) posing efficiency risks |
| Environmental Risk | Industry-wide semiconductor manufacturing environmental impact | Similar environmental footprint; ongoing sustainability efforts |
| Geopolitical Risk | High due to operations in geopolitically sensitive regions (China, Taiwan) | Moderate, primarily US-based but affected by global trade tensions |
Most impactful and likely risks include Marvell’s high market volatility and geopolitical exposure in Asia, which could disrupt supply chains. GLOBALFOUNDRIES faces operational efficiency challenges and moderate regulatory risk but benefits from a safer debt profile. Both companies have unfavorable profitability metrics, heightening financial risk.
Which Stock to Choose?
Marvell Technology, Inc. (MRVL) shows a 4.7% revenue growth over the past year but a negative net margin of -15.35% and declining profitability metrics. Its financial ratios reveal a mixed profile with 43% favorable ratios, including a solid current ratio of 1.54, but an overall unfavorable global evaluation and a very unfavorable MOAT rating due to value destruction.
GLOBALFOUNDRIES Inc. (GFS) reports a revenue decline of -8.7% last year and a net margin of -3.93%, with an unfavorable income statement and 36% favorable financial ratios. The company has a better liquidity position (current ratio 2.11) and a slightly unfavorable MOAT reflecting value shedding but with improving profitability trends.
Investors focused on growth might interpret MRVL’s higher revenue expansion potential despite profitability challenges as a possible opportunity, while those prioritizing financial stability and improving profitability could see GFS’s stronger liquidity and improving MOAT trend as more aligned with conservative profiles.
Disclaimer: Investment carries a risk of loss of initial capital. The past performance is not a reliable indicator of future results. Be sure to understand risks before making an investment decision.
Go Further
I encourage you to read the complete analyses of Marvell Technology, Inc. and GLOBALFOUNDRIES Inc. to enhance your investment decisions: