In the dynamic semiconductor industry, GLOBALFOUNDRIES Inc. (GFS) and Lattice Semiconductor Corporation (LSCC) stand out as influential players with distinct approaches. While GLOBALFOUNDRIES focuses on large-scale wafer fabrication and integrated circuit manufacturing, Lattice specializes in programmable logic devices and IP licensing. Their overlapping markets and innovation strategies make this comparison particularly insightful. Join me as we explore which company offers the most compelling investment opportunity today.

Table of contents
Companies Overview
I will begin the comparison between GLOBALFOUNDRIES Inc. and Lattice Semiconductor Corporation by providing an overview of these two companies and their main differences.
GLOBALFOUNDRIES Overview
GLOBALFOUNDRIES Inc. operates as a semiconductor foundry worldwide, manufacturing integrated circuits that enable electronic devices across various sectors. Their product range includes microprocessors, mobile application processors, and network processors, among others. Founded in 2009 and based in Malta, New York, GLOBALFOUNDRIES holds a significant market position in wafer fabrication services and semiconductor technologies.
Lattice Semiconductor Overview
Lattice Semiconductor Corporation develops and sells semiconductor products globally, focusing on field programmable gate arrays and video connectivity standard products. The company licenses its technology portfolio and serves original equipment manufacturers in communications, computing, consumer, industrial, and automotive markets. Founded in 1983 and headquartered in Hillsboro, Oregon, Lattice has a strong presence in semiconductor design and IP licensing.
Key similarities and differences
Both GLOBALFOUNDRIES and Lattice operate in the semiconductor industry and serve technology-driven markets. GLOBALFOUNDRIES focuses on wafer fabrication and manufacturing integrated circuits, while Lattice specializes in programmable logic devices and IP licensing. The companies also differ in scale, with GLOBALFOUNDRIES employing around 13,000 staff compared to Lattice’s approximately 1,110 employees, reflecting distinct operational scopes.
Income Statement Comparison
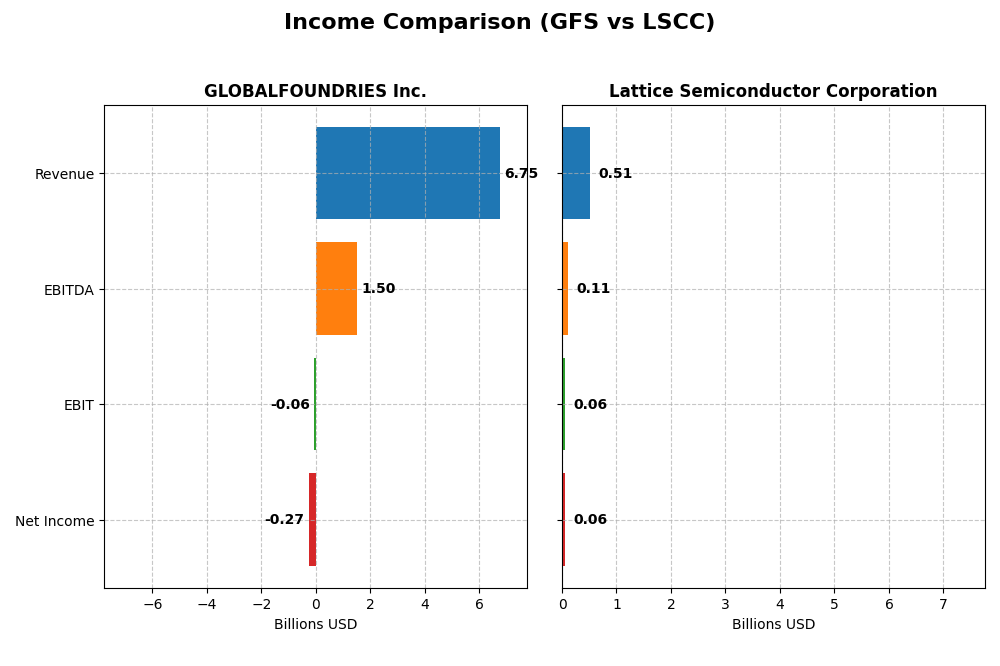
The table below summarizes the key income statement metrics for GLOBALFOUNDRIES Inc. and Lattice Semiconductor Corporation for the fiscal year 2024.
| Metric | GLOBALFOUNDRIES Inc. (GFS) | Lattice Semiconductor Corporation (LSCC) |
|---|---|---|
| Market Cap | 23B | 12B |
| Revenue | 6.75B | 509M |
| EBITDA | 1.50B | 107M |
| EBIT | -64M | 61M |
| Net Income | -265M | 61M |
| EPS | -0.48 | 0.44 |
| Fiscal Year | 2024 | 2024 |
Income Statement Interpretations
GLOBALFOUNDRIES Inc.
GLOBALFOUNDRIES showed a revenue increase of 39.15% from 2020 to 2024 but experienced an 8.69% revenue decline in the latest year. Net income grew 80.37% overall but turned negative in 2024, with a net margin at -3.93%. Gross margin remains favorable at 24.46%, yet EBIT and net margins deteriorated in 2024, signaling recent operational challenges.
Lattice Semiconductor Corporation
Lattice Semiconductor displayed a 24.82% revenue growth over five years but faced a 30.9% contraction in 2024. Net income increased by 28.99% overall, with a 12% net margin in 2024. Gross and EBIT margins are strong at 66.82% and 11.91%, respectively, though recent yearly declines in revenue and profitability suggest short-term headwinds.
Which one has the stronger fundamentals?
Lattice Semiconductor exhibits stronger fundamentals with consistently favorable margins, including a robust net margin of 12%, and a favorable overall income statement evaluation. GLOBALFOUNDRIES, despite longer-term growth, showed unfavorable EBIT and net margin trends in 2024, with a negative bottom line, indicating more recent financial stress compared to Lattice’s steadier profitability profile.
Financial Ratios Comparison
The table below summarizes key financial ratios for GLOBALFOUNDRIES Inc. (GFS) and Lattice Semiconductor Corporation (LSCC) for the fiscal year 2024, providing a direct comparison of profitability, liquidity, leverage, efficiency, and shareholder returns.
| Ratios | GLOBALFOUNDRIES Inc. (GFS) | Lattice Semiconductor Corporation (LSCC) |
|---|---|---|
| ROE | -2.46% | 8.60% |
| ROIC | -1.47% | 4.59% |
| P/E | -89.5 | 132.7 |
| P/B | 2.20 | 11.41 |
| Current Ratio | 2.11 | 3.66 |
| Quick Ratio | 1.57 | 2.62 |
| D/E (Debt-to-Equity) | 0.22 | 0.02 |
| Debt-to-Assets | 13.8% | 1.81% |
| Interest Coverage | -1.48 | 129.5 |
| Asset Turnover | 0.40 | 0.60 |
| Fixed Asset Turnover | 0.82 | 7.62 |
| Payout ratio | 0 | 0 |
| Dividend yield | 0 | 0 |
Interpretation of the Ratios
GLOBALFOUNDRIES Inc.
GLOBALFOUNDRIES shows a mixed ratio profile with key weaknesses in profitability metrics such as negative net margin (-3.93%), ROE (-2.46%), and ROIC (-1.47%), alongside unfavorable interest coverage (-0.44). However, liquidity and leverage ratios like current ratio (2.11) and debt to equity (0.22) are favorable. The company does not pay dividends, likely reflecting its negative earnings and reinvestment needs.
Lattice Semiconductor Corporation
Lattice Semiconductor presents strong profitability with a favorable net margin of 12%, but other returns such as ROE (8.6%) and ROIC (4.59%) are marked unfavorable. Liquidity shows mixed signals: quick ratio is favorable (2.62), but current ratio (3.66) is unfavorable. Debt levels are low and interest coverage is robust (228.11). The company does not pay dividends, suggesting focus on growth and R&D.
Which one has the best ratios?
Lattice Semiconductor has a slightly more favorable ratio profile with higher profitability and excellent interest coverage, despite some negatives on valuation and liquidity. GLOBALFOUNDRIES suffers from several unfavorable profitability and efficiency ratios, though it maintains solid liquidity and leverage. Overall, Lattice’s ratios suggest a more balanced financial position in 2024.
Strategic Positioning
This section compares the strategic positioning of GLOBALFOUNDRIES Inc. (GFS) and Lattice Semiconductor Corporation (LSCC) focusing on Market position, Key segments, and disruption:
GLOBALFOUNDRIES Inc.
- Large semiconductor foundry with $23B market cap, facing competitive tech sector pressures.
- Key segments include wafer fabrication ($6.1B in 2024) and engineering services ($652M).
- Operates in mainstream wafer fabrication, no explicit mention of disruption exposure.
Lattice Semiconductor Corporation
- Smaller semiconductor firm with $11.7B market cap, operating in a competitive niche.
- Focuses on FPGA product families and licenses IP technology, serving diverse markets.
- Develops programmable semiconductors, exposed to innovation in FPGA and IP licensing.
GLOBALFOUNDRIES Inc. vs Lattice Semiconductor Corporation Positioning
GFS has a diversified business model with strong wafer fabrication and engineering services, while LSCC concentrates on FPGA products and IP licensing. GFS’s scale offers breadth, LSCC’s focus targets specialized markets, reflecting different strategic priorities and operational scopes.
Which has the best competitive advantage?
Both companies are currently shedding value with ROIC below WACC. GFS shows a growing ROIC trend (slightly unfavorable moat), whereas LSCC’s declining ROIC indicates a very unfavorable moat, suggesting GFS currently holds a relatively stronger competitive advantage.
Stock Comparison
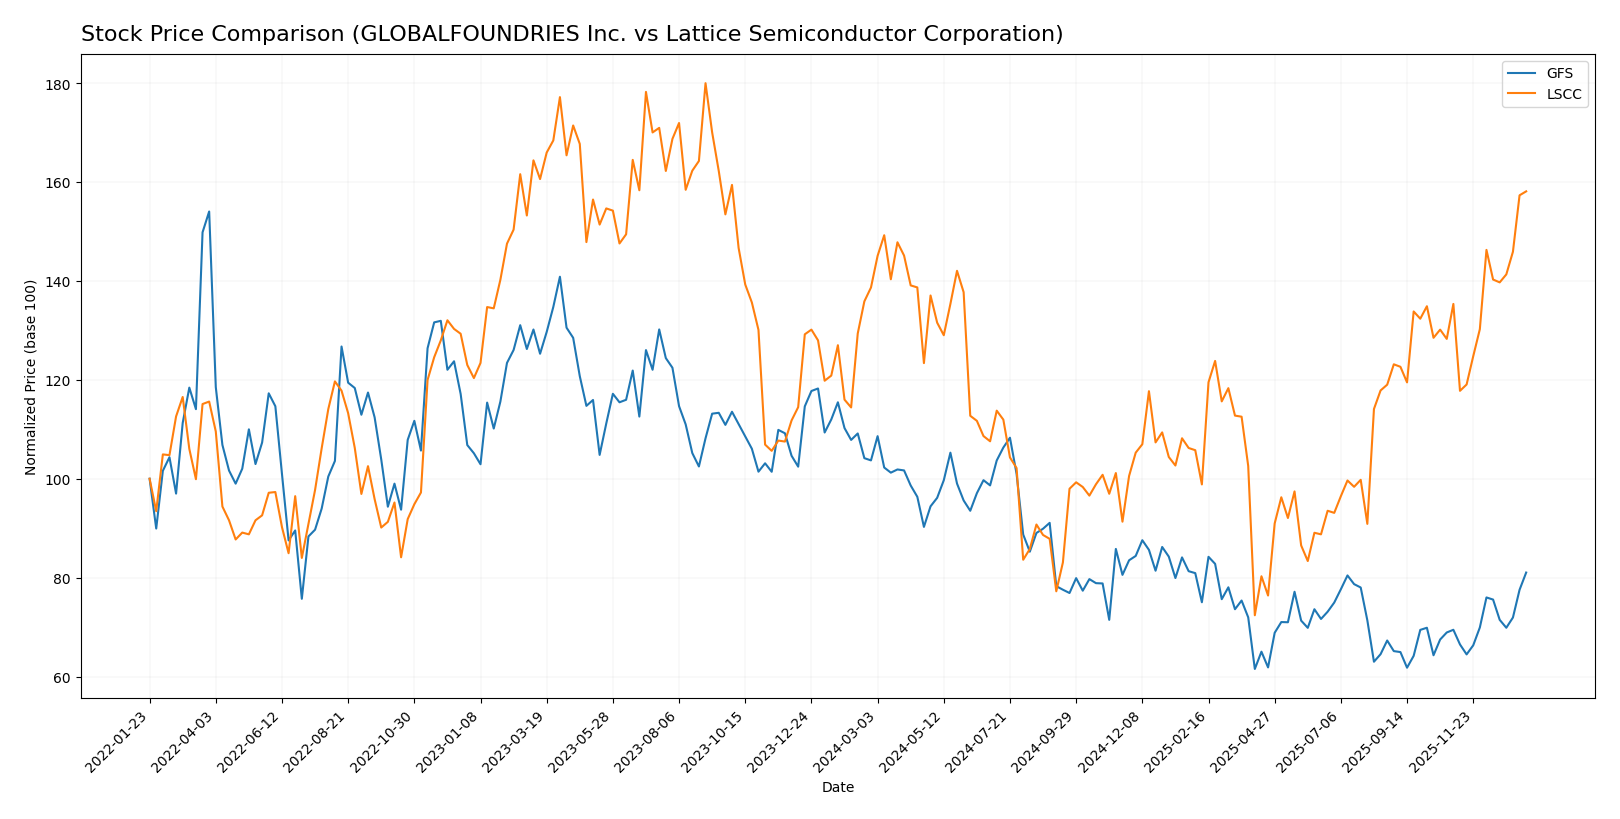
The stock price movements over the past 12 months reveal contrasting trends for GLOBALFOUNDRIES Inc. and Lattice Semiconductor Corporation, highlighting divergent investor sentiment and trading dynamics.
Trend Analysis
GLOBALFOUNDRIES Inc. experienced a bearish trend over the past year, with a price decline of 21.86% and accelerating downward momentum, despite a recent positive reversal of 16.66% since November 2025.
Lattice Semiconductor Corporation showed a bullish trend over the past year, gaining 14.02% with accelerating upward momentum and higher volatility; its recent 16.82% rise since November 2025 confirms strong buyer dominance.
Comparing the two, Lattice Semiconductor outperformed GLOBALFOUNDRIES, delivering the highest market performance with sustained gains and stronger buyer activity throughout the analyzed period.
Target Prices
Analyst consensus target prices indicate moderate upside potential for these semiconductor companies.
| Company | Target High | Target Low | Consensus |
|---|---|---|---|
| GLOBALFOUNDRIES Inc. | 40 | 37 | 38.5 |
| Lattice Semiconductor Corporation | 105 | 65 | 83 |
GLOBALFOUNDRIES’ consensus target at 38.5 is slightly below its current price of 41.53, suggesting limited near-term upside. Lattice Semiconductor’s consensus target at 83 is somewhat below its current price of 85.23, indicating cautious analyst expectations.
Analyst Opinions Comparison
This section compares analysts’ ratings and grades for GLOBALFOUNDRIES Inc. (GFS) and Lattice Semiconductor Corporation (LSCC):
Rating Comparison
GFS Rating
- Rating: C+ with a “Very Favorable” status overall.
- Discounted Cash Flow Score: 3, indicating a moderate valuation assessment.
- Return on Equity Score: 1, considered very unfavorable, showing low efficiency in generating profit from equity.
- Return on Assets Score: 1, very unfavorable, indicating poor asset utilization.
- Debt To Equity Score: 3, moderate financial risk with average debt level.
- Overall Score: 2, moderate overall financial standing.
LSCC Rating
- Rating: B- with a “Very Favorable” status overall.
- Discounted Cash Flow Score: 3, indicating a moderate valuation assessment.
- Return on Equity Score: 2, moderate efficiency in generating profit from equity.
- Return on Assets Score: 3, moderate effectiveness in asset utilization.
- Debt To Equity Score: 4, favorable financial risk profile with relatively low debt.
- Overall Score: 2, moderate overall financial standing.
Which one is the best rated?
Based strictly on the provided data, LSCC holds a better rating (B-) compared to GFS (C+). LSCC scores higher in return on equity, return on assets, and debt to equity, indicating a stronger financial profile.
Scores Comparison
Here is a comparison of the Altman Z-Score and Piotroski Score for GLOBALFOUNDRIES Inc. and Lattice Semiconductor Corporation:
GFS Scores
- Altman Z-Score: 2.61, in the grey zone, moderate bankruptcy risk
- Piotroski Score: 6, average financial strength
LSCC Scores
- Altman Z-Score: 52.69, in the safe zone, very low bankruptcy risk
- Piotroski Score: 5, average financial strength
Which company has the best scores?
LSCC shows a significantly higher Altman Z-Score, indicating stronger financial stability and lower bankruptcy risk compared to GFS. Both companies have similar average Piotroski Scores, reflecting comparable financial health by that measure.
Grades Comparison
Here is a comparison of the recent grades assigned to GLOBALFOUNDRIES Inc. and Lattice Semiconductor Corporation by recognized grading companies:
GLOBALFOUNDRIES Inc. Grades
This table displays recent grade updates from reputable firms for GLOBALFOUNDRIES Inc.:
| Grading Company | Action | New Grade | Date |
|---|---|---|---|
| Wedbush | Downgrade | Neutral | 2025-12-31 |
| B of A Securities | Maintain | Underperform | 2025-12-04 |
| Evercore ISI Group | Maintain | Outperform | 2025-11-13 |
| JP Morgan | Maintain | Neutral | 2025-11-13 |
| Citigroup | Maintain | Neutral | 2025-11-13 |
| Wedbush | Maintain | Outperform | 2025-11-13 |
| B of A Securities | Downgrade | Underperform | 2025-10-13 |
| Deutsche Bank | Maintain | Buy | 2025-08-06 |
| Morgan Stanley | Maintain | Equal Weight | 2025-08-06 |
| Wedbush | Maintain | Outperform | 2025-08-06 |
Overall, GLOBALFOUNDRIES’ grades show a mixed trend with downgrades and neutral ratings alongside maintained outperform and buy ratings.
Lattice Semiconductor Corporation Grades
Below is a summary of the latest grades from established firms for Lattice Semiconductor Corporation:
| Grading Company | Action | New Grade | Date |
|---|---|---|---|
| Keybanc | Maintain | Overweight | 2026-01-13 |
| Stifel | Maintain | Buy | 2025-11-04 |
| Baird | Maintain | Outperform | 2025-11-04 |
| Needham | Maintain | Buy | 2025-11-04 |
| Rosenblatt | Maintain | Buy | 2025-11-04 |
| Benchmark | Maintain | Buy | 2025-11-04 |
| Susquehanna | Maintain | Positive | 2025-10-22 |
| Keybanc | Maintain | Overweight | 2025-09-30 |
| Needham | Maintain | Buy | 2025-09-22 |
| Benchmark | Maintain | Buy | 2025-09-11 |
Lattice Semiconductor consistently maintains positive grades, predominantly “Buy” and “Overweight,” indicating strong analyst confidence.
Which company has the best grades?
Lattice Semiconductor Corporation has received consistently stronger and more positive grades than GLOBALFOUNDRIES Inc., which faces mixed to neutral ratings. This suggests higher analyst confidence in Lattice’s prospects, potentially influencing investor sentiment towards stability and growth expectations.
Strengths and Weaknesses
Below is a comparison of key strengths and weaknesses for GLOBALFOUNDRIES Inc. (GFS) and Lattice Semiconductor Corporation (LSCC) based on their latest financial and operational data.
| Criterion | GLOBALFOUNDRIES Inc. (GFS) | Lattice Semiconductor Corporation (LSCC) |
|---|---|---|
| Diversification | Moderate: Mainly Water Fabrication (6.1B USD) with Engineering services (652M USD) | Limited: Primarily License and Service revenue (~17M USD), less diversified |
| Profitability | Low: Negative net margin (-3.93%), ROIC negative (-1.47%), shedding value | Mixed: Positive net margin (12%), but ROIC (4.59%) below WACC, shedding value |
| Innovation | Moderate: Growing ROIC trend (90%) indicates improving efficiency | Weak: Declining ROIC trend (-45%) suggests challenges in innovation or execution |
| Global presence | Strong: Large scale operations in fabrication with global reach | Smaller scale, niche market focus with less global footprint |
| Market Share | Significant in semiconductor fabrication | Smaller market share in semiconductor licensing and services |
Key takeaways: GLOBALFOUNDRIES exhibits stronger scale and improving profitability trends but still operates at a loss, indicating recovery potential. Lattice Semiconductor shows profitability but struggles with declining capital efficiency and limited diversification, implying higher risk for investors. Both companies currently face challenges in creating value above their capital costs.
Risk Analysis
Below is a comparative table summarizing key risks for GLOBALFOUNDRIES Inc. (GFS) and Lattice Semiconductor Corporation (LSCC) based on the most recent 2024 data:
| Metric | GLOBALFOUNDRIES Inc. (GFS) | Lattice Semiconductor Corporation (LSCC) |
|---|---|---|
| Market Risk | Beta 1.49 indicates above-average volatility | Beta 1.72 indicates high volatility |
| Debt Level | Moderate, Debt/Equity 0.22, Interest coverage negative (-0.44) | Very low, Debt/Equity 0.02, strong interest coverage (228.11) |
| Regulatory Risk | Semiconductor industry exposed to export controls and trade policies | Similar exposure, global operations across Asia, Europe, Americas |
| Operational Risk | Lower asset turnover and ROIC suggest efficiency challenges | Higher asset turnover and ROIC but with stretched valuation metrics |
| Environmental Risk | Moderate, manufacturing impact with evolving regulations | Moderate, with focus on sustainable practices but limited disclosure |
| Geopolitical Risk | US-based with global supply chain, sensitive to US-China tensions | US-based, global sales; exposure to geopolitical supply chain disruptions |
The most likely and impactful risks stem from market volatility and regulatory/geopolitical tensions affecting the semiconductor sector globally. GFS’s weak profitability and negative interest coverage highlight financial stress risks, while LSCC shows strong balance sheet but faces valuation and market risk concerns. Careful monitoring of trade policies and operational efficiency is essential for risk management.
Which Stock to Choose?
GLOBALFOUNDRIES Inc. (GFS) shows a mixed income evolution with a 39.15% revenue growth over 2020-2024 but a recent 8.69% decline. Its financial ratios are mostly unfavorable, including negative profitability and low asset turnover, though debt metrics are favorable. The rating is moderate with a very favorable overall grade C+.
Lattice Semiconductor Corporation (LSCC) presents a favorable income statement overall despite a 30.9% revenue drop in the last year. Its financial ratios are slightly unfavorable but include strong interest coverage and low debt. The company’s rating is moderate with a very favorable grade B-.
For investors, LSCC may appear more suitable for those seeking growth with better profitability and a favorable income statement, while GFS could be interpreted as potentially appealing for those valuing lower debt and moderate rating despite weaker profitability. The final choice might depend on the investor’s risk tolerance and investment strategy.
Disclaimer: Investment carries a risk of loss of initial capital. The past performance is not a reliable indicator of future results. Be sure to understand risks before making an investment decision.
Go Further
I encourage you to read the complete analyses of GLOBALFOUNDRIES Inc. and Lattice Semiconductor Corporation to enhance your investment decisions: