Home > Comparison > Technology > LRCX vs GFS
The strategic rivalry between Lam Research Corporation and GLOBALFOUNDRIES Inc. shapes the semiconductor industry’s evolution. Lam Research operates as a capital-intensive equipment manufacturer, supplying advanced wafer processing tools. GLOBALFOUNDRIES focuses on semiconductor foundry services, producing integrated circuits for diverse applications. This analysis pits advanced manufacturing technology against large-scale fabrication capacity, aiming to identify which model offers superior risk-adjusted returns for a diversified portfolio in the dynamic tech sector.
Table of contents
Companies Overview
Lam Research and GLOBALFOUNDRIES are pivotal players shaping the semiconductor industry’s competitive landscape.
Lam Research Corporation: Semiconductor Equipment Specialist
Lam Research dominates the semiconductor equipment market, generating revenue by designing and servicing advanced fabrication tools. Its core competitive advantage lies in precision equipment like plasma etchers and deposition systems. In 2026, Lam’s strategic focus centers on expanding high-value process technologies to support next-generation chip manufacturing globally.
GLOBALFOUNDRIES Inc.: Semiconductor Foundry Powerhouse
GLOBALFOUNDRIES operates as a leading semiconductor foundry, producing integrated circuits essential for various electronics. The company’s revenue engine relies on wafer fabrication services across multiple device types, including microprocessors and RF modems. Its 2026 strategy emphasizes scaling mainstream manufacturing capabilities to meet broad market demand efficiently.
Strategic Collision: Similarities & Divergences
Lam Research and GLOBALFOUNDRIES pursue distinct but complementary models—equipment innovation versus fabrication execution. They collide primarily in the semiconductor value chain’s heart, where process technology meets wafer manufacturing. Lam offers a capital-light model with technology leadership, while GLOBALFOUNDRIES carries higher capital intensity but captures volume-driven growth, creating sharply different investment profiles.
Income Statement Comparison
This data dissects the core profitability and scalability of both corporate engines to reveal who dominates the bottom line:

| Metric | Lam Research Corporation (LRCX) | GLOBALFOUNDRIES Inc. (GFS) |
|---|---|---|
| Revenue | 18.4B | 6.75B |
| Cost of Revenue | 9.46B | 5.10B |
| Operating Expenses | 3.08B | 1.87B |
| Gross Profit | 8.98B | 1.65B |
| EBITDA | 6.34B | 1.50B |
| EBIT | 5.96B | -64M |
| Interest Expense | 178M | 145M |
| Net Income | 5.36B | -265M |
| EPS | 4.17 | -0.48 |
| Fiscal Year | 2025 | 2024 |
Income Statement Analysis: The Bottom-Line Duel
This income statement comparison reveals the true efficiency and profitability of two semiconductor industry leaders over recent years.
Lam Research Corporation Analysis
Lam Research’s revenue climbed steadily to $18.4B in 2025, with net income surging to $5.36B. Gross margins remain robust near 49%, and net margins hit a strong 29%. The latest year shows impressive momentum, with a 23.7% revenue increase and 31.1% EBIT growth, underscoring operational efficiency and solid margin expansion.
GLOBALFOUNDRIES Inc. Analysis
GLOBALFOUNDRIES’ revenue peaked at $8.1B in 2022 but slipped to $6.75B in 2024, with net income turning negative to -$265M. Gross margin stands at a modest 24.5%, while EBIT and net margins are negative, reflecting operational challenges. The latest year marks a decline in profitability and revenue, signaling deteriorating margin health and efficiency.
Margin Dominance vs. Revenue Contraction
Lam Research clearly outperforms GLOBALFOUNDRIES in margin strength and profit growth, with sustained revenue gains and expanding net margins. GLOBALFOUNDRIES struggles with shrinking sales and persistent losses, despite some long-term growth. For investors, Lam’s profile offers superior operational efficiency and profitability stability.
Financial Ratios Comparison
These vital ratios act as a diagnostic tool to expose the underlying fiscal health, valuation premiums, and capital efficiency of the companies compared:
| Ratios | Lam Research (LRCX) | GLOBALFOUNDRIES (GFS) |
|---|---|---|
| ROE | 54.3% (2025) | -2.5% (2024) |
| ROIC | 34.0% (2025) | -1.5% (2024) |
| P/E | 23.4 (2025) | -89.5 (2024) |
| P/B | 12.7 (2025) | 2.20 (2024) |
| Current Ratio | 2.21 (2025) | 2.11 (2024) |
| Quick Ratio | 1.55 (2025) | 1.57 (2024) |
| D/E | 0.48 (2025) | 0.22 (2024) |
| Debt-to-Assets | 22.3% (2025) | 13.8% (2024) |
| Interest Coverage | 33.1x (2025) | -1.48x (2024) |
| Asset Turnover | 0.86 (2025) | 0.40 (2024) |
| Fixed Asset Turnover | 7.59 (2025) | 0.82 (2024) |
| Payout ratio | 21.5% (2025) | 0% (2024) |
| Dividend yield | 0.92% (2025) | 0% (2024) |
| Fiscal Year | 2025 | 2024 |
Efficiency & Valuation Duel: The Vital Signs
Ratios serve as a company’s DNA, exposing hidden risks and highlighting operational strengths crucial for investment decisions.
Lam Research Corporation
Lam Research boasts robust profitability with a 54.33% ROE and a healthy 29.06% net margin, signaling operational excellence. Its P/E of 23.36 indicates a fairly valued stock, though a high P/B of 12.69 suggests some valuation stretch. Shareholder returns lean on modest dividends, supported by strong reinvestment in R&D.
GLOBALFOUNDRIES Inc.
GLOBALFOUNDRIES struggles with negative returns, including a -2.46% ROE and a -3.93% net margin, reflecting operational inefficiencies. Despite a favorable negative P/E, its weak asset turnover and interest coverage raise caution. The company offers no dividend, focusing on rebuilding through growth and capital discipline.
Premium Valuation vs. Operational Safety
Lam Research offers a superior balance of profitability and valuation discipline, despite a stretched P/B ratio. GLOBALFOUNDRIES’ negative returns and operational challenges present higher risk. Investors prioritizing operational strength and consistent returns will find Lam Research’s profile more aligned with their goals.
Which one offers the Superior Shareholder Reward?
I observe Lam Research (LRCX) pays a modest dividend yield near 0.9% with a sustainable payout ratio around 21-27%. Its free cash flow coverage exceeds 300%, supporting steady dividends and active buybacks. In contrast, GLOBALFOUNDRIES (GFS) pays no dividends, channeling cash into capex and growth, but with weaker free cash flow conversion and volatile profitability. LRCX’s robust buyback program and consistent dividend underpin a stronger total return. I conclude Lam Research offers a superior shareholder reward in 2026 due to its balanced, sustainable distribution model combined with disciplined capital allocation.
Comparative Score Analysis: The Strategic Profile
The radar chart reveals the fundamental DNA and trade-offs of Lam Research Corporation and GLOBALFOUNDRIES Inc., highlighting where each firm excels or lags:
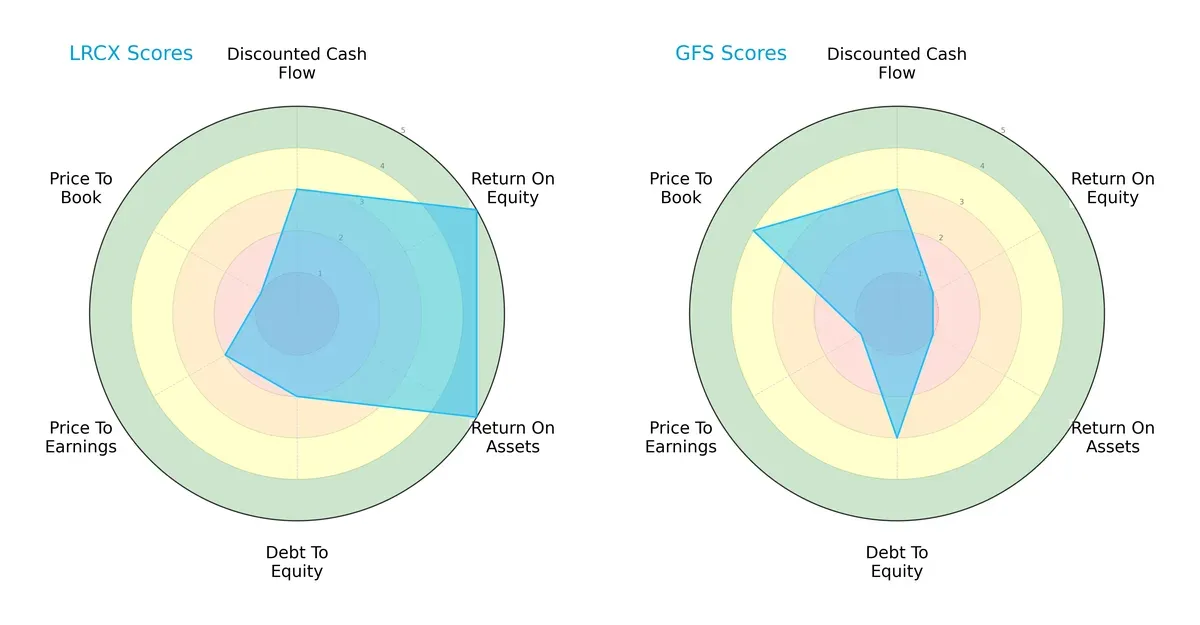
Lam Research shows a balanced strength in profitability with top ROE and ROA scores (5 each) but carries moderate debt risk (debt/equity score 2) and valuation challenges (PE 2, PB 1). GLOBALFOUNDRIES leans on a stronger balance sheet (debt/equity 3) and attractive book valuation (PB 4), yet struggles severely in profitability (ROE 1, ROA 1) and earnings valuation (PE 1). Lam Research presents a more consistent profile, while GLOBALFOUNDRIES depends on valuation appeal amid operational weaknesses.
Bankruptcy Risk: Solvency Showdown
Lam Research’s Altman Z-Score of 21.18 dwarfs GLOBALFOUNDRIES’ 3.01, indicating far superior financial stability for Lam Research in this economic cycle:

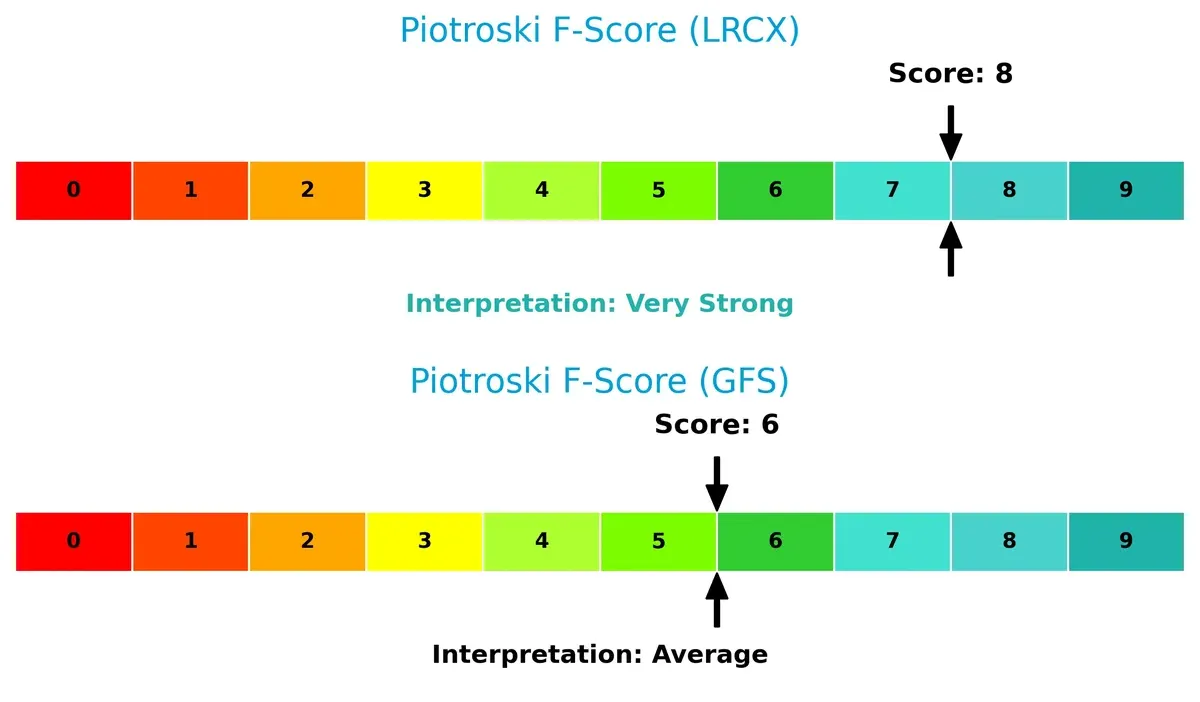
Financial Health: Quality of Operations
Lam Research scores an 8 on the Piotroski F-Score, signaling very strong operational quality. GLOBALFOUNDRIES’ 6 marks average health with some internal red flags:
How are the two companies positioned?
This section dissects the operational DNA of LRCX and GFS by comparing their revenue distribution across segments and internal strengths and weaknesses. The goal is to confront their economic moats to reveal which model delivers the most resilient competitive advantage today.
Revenue Segmentation: The Strategic Mix
This visual comparison dissects how Lam Research Corporation and GLOBALFOUNDRIES diversify their income streams and where their primary sector bets lie:

Lam Research anchors its revenue in two solid segments: Systems at $11.5B and Customer Support at $6.9B in 2025, showing balanced diversification. GLOBALFOUNDRIES, however, pivots heavily on Water Fabrication with $6.1B versus $652M in Engineering services, revealing concentration risk. Lam’s approach supports ecosystem lock-in through system sales and strong after-sales support, while GFS’s dominance in fabrication highlights infrastructure reliance but less segment breadth.
Strengths and Weaknesses Comparison
This table compares the Strengths and Weaknesses of Lam Research Corporation (LRCX) and GLOBALFOUNDRIES Inc. (GFS):
LRCX Strengths
- High net margin at 29.06%
- ROE and ROIC significantly exceed WACC
- Strong liquidity ratios above 2.0
- Moderate debt levels with favorable coverage
- Diverse revenue from Systems and Customer Support
- Global footprint with strong Asia-Pacific sales
GFS Strengths
- Favorable price-to-earnings ratio despite losses
- Conservative debt-to-assets ratio at 13.81%
- Solid current and quick ratios near 2.1
- Significant US revenue concentration supporting stability
- Diverse geographic exposure including EMEA and other areas
LRCX Weaknesses
- Unfavorable high WACC at 12.05%
- Elevated price-to-book ratio at 12.69 indicating possible overvaluation
- Dividend yield under 1% limits income appeal
- Asset turnover moderate at 0.86
GFS Weaknesses
- Negative profitability metrics with net margin and ROE below zero
- Interest coverage negative at -0.44 indicating financial stress
- Low asset and fixed asset turnovers under 1.0
- No dividend yield reducing shareholder returns
Lam Research demonstrates robust profitability and liquidity but faces valuation concerns and cost of capital pressures. GLOBALFOUNDRIES struggles with profitability and operational efficiency despite solid liquidity and a conservative capital structure. These contrasts reflect differing strategic and financial positioning in the semiconductor sector.
The Moat Duel: Analyzing Competitive Defensibility
A structural moat is the only reliable shield protecting long-term profits from relentless competitive erosion in the semiconductor industry:
Lam Research Corporation: Precision Engineering Moat
I see Lam’s moat rooted in intangible assets and technological leadership. Its 21.9% excess ROIC over WACC signals efficient capital use and durable pricing power. New ALD and CVD product innovations in 2026 should deepen this advantage.
GLOBALFOUNDRIES Inc.: Scale and Capacity Moat
GLOBALFOUNDRIES relies on cost advantage via large-scale wafer fabrication, contrasting Lam’s tech edge. Despite negative excess ROIC, improving profitability suggests operational gains. Expansion into specialty nodes in 2026 could disrupt its trajectory.
Verdict: Technology Leadership vs. Scale Efficiency
Lam’s wider, durable moat from superior technology and capital efficiency outmatches GLOBALFOUNDRIES’ scale-based moat with weaker returns. Lam is better positioned to defend and grow its market share amid industry pressures.
Which stock offers better returns?
The past year saw Lam Research’s shares surge 144%, showing accelerating gains and strong buyer dominance. GLOBALFOUNDRIES, by contrast, declined nearly 20%, despite a recent modest rebound.

Trend Comparison
Lam Research’s stock rose 144% over 12 months, driven by accelerating momentum and a high volatility level of 36.82. Prices ranged from 59.09 to 233.46, highlighting a robust bullish trend.
GLOBALFOUNDRIES experienced a 19.48% decline, marking a bearish trend with acceleration. Volatility remained low at 6.18, with prices fluctuating between 31.54 and 55.5 over the same period.
Lam Research outperformed GLOBALFOUNDRIES significantly, delivering the highest market returns with strong volume support and accelerating price gains.
Target Prices
Analysts provide a mixed but generally optimistic target consensus for these semiconductor firms.
| Company | Target Low | Target High | Consensus |
|---|---|---|---|
| Lam Research Corporation | 127 | 325 | 266.76 |
| GLOBALFOUNDRIES Inc. | 37 | 40 | 38.5 |
Lam Research’s consensus target of $266.76 sits well above its current $233.46 price, signaling upside potential. GLOBALFOUNDRIES’ $38.5 consensus target is slightly below the current $42.20 price, suggesting limited near-term appreciation.

Don’t Let Luck Decide Your Entry Point
Optimize your entry points with our advanced ProRealTime indicators. You’ll get efficient buy signals with precise price targets for maximum performance. Start outperforming now!
How do institutions grade them?
Lam Research Corporation Grades
Below is a summary of recent grades from major financial institutions for Lam Research Corporation.
| Grading Company | Action | New Grade | Date |
|---|---|---|---|
| UBS | Maintain | Buy | 2026-01-29 |
| Wells Fargo | Maintain | Overweight | 2026-01-29 |
| JP Morgan | Maintain | Overweight | 2026-01-29 |
| RBC Capital | Maintain | Outperform | 2026-01-29 |
| Citigroup | Maintain | Buy | 2026-01-29 |
| Stifel | Maintain | Buy | 2026-01-29 |
| Morgan Stanley | Maintain | Equal Weight | 2026-01-29 |
| Needham | Maintain | Buy | 2026-01-29 |
| Susquehanna | Maintain | Positive | 2026-01-29 |
| Goldman Sachs | Maintain | Buy | 2026-01-29 |
GLOBALFOUNDRIES Inc. Grades
Here are the recent grades issued by leading firms for GLOBALFOUNDRIES Inc.
| Grading Company | Action | New Grade | Date |
|---|---|---|---|
| Citigroup | Maintain | Neutral | 2026-01-15 |
| Wedbush | Downgrade | Neutral | 2025-12-31 |
| B of A Securities | Maintain | Underperform | 2025-12-04 |
| Citigroup | Maintain | Neutral | 2025-11-13 |
| Evercore ISI Group | Maintain | Outperform | 2025-11-13 |
| JP Morgan | Maintain | Neutral | 2025-11-13 |
| Wedbush | Maintain | Outperform | 2025-11-13 |
| Wedbush | Maintain | Outperform | 2025-08-06 |
| Morgan Stanley | Maintain | Equal Weight | 2025-08-06 |
| B of A Securities | Downgrade | Underperform | 2025-10-13 |
Which company has the best grades?
Lam Research consistently receives positive grades, mostly “Buy” or equivalent, from top firms. GLOBALFOUNDRIES shows a mix, with several “Neutral” and “Underperform” ratings. Investors may interpret Lam Research’s stronger grades as greater institutional confidence.
Risks specific to each company
The following categories identify critical pressure points and systemic threats facing Lam Research Corporation and GLOBALFOUNDRIES Inc. in the 2026 market environment:
1. Market & Competition
Lam Research Corporation
- Dominates semiconductor equipment with advanced process tech, but faces intense competition from peers and cyclical demand risks.
GLOBALFOUNDRIES Inc.
- Competes as a pure-play foundry with narrower tech moat and lower asset turnover, under pressure from larger foundries and pricing wars.
2. Capital Structure & Debt
Lam Research Corporation
- Maintains moderate leverage (D/E 0.48) and strong interest coverage (33.43), signaling stable financial footing.
GLOBALFOUNDRIES Inc.
- Lower leverage (D/E 0.22) but negative interest coverage (-0.44) raises red flags about debt servicing capacity.
3. Stock Volatility
Lam Research Corporation
- Beta at 1.78 indicates higher volatility, reflecting sensitivity to market swings and cyclical semiconductor demand.
GLOBALFOUNDRIES Inc.
- Beta at 1.49 shows lower but still significant volatility amid sector uncertainty and operational challenges.
4. Regulatory & Legal
Lam Research Corporation
- Operates globally, facing complex export controls, IP protection issues, and evolving semiconductor regulations.
GLOBALFOUNDRIES Inc.
- Also global but with potentially higher exposure to US-China trade tensions impacting foundry supply chains.
5. Supply Chain & Operations
Lam Research Corporation
- Strong operational efficiency (fixed asset turnover 7.59) and diversified supply chains reduce disruption risks.
GLOBALFOUNDRIES Inc.
- Lower asset turnover (0.82) and narrower tech base may intensify supply chain vulnerabilities in volatile markets.
6. ESG & Climate Transition
Lam Research Corporation
- Increasing ESG focus with better resource efficiency and environmental compliance expected by investors.
GLOBALFOUNDRIES Inc.
- ESG initiatives less mature, potentially facing higher transition costs and stakeholder scrutiny.
7. Geopolitical Exposure
Lam Research Corporation
- Significant exposure to Asia-Pacific markets risks amid US-China tech rivalry and export restrictions.
GLOBALFOUNDRIES Inc.
- US-based foundry with global footprint, vulnerable to geopolitical shifts affecting fab capacity and customer base.
Which company shows a better risk-adjusted profile?
Lam Research faces a competitive but manageable risk landscape with strong financials and operational resilience. GLOBALFOUNDRIES struggles with profitability, weaker debt servicing, and operational inefficiencies, heightening its vulnerability. Lam Research’s recent robust Altman Z-score (21.18) and strong Piotroski score (8) signal solid financial health. In contrast, GLOBALFOUNDRIES’ negative margins and interest coverage, despite a safer Altman Z-score (3.01), underscore risk concerns. The tech moat and capital structure favor Lam Research, marking it the better risk-adjusted choice.
Final Verdict: Which stock to choose?
Lam Research Corporation’s superpower lies in its durable competitive advantage, driven by a strong and growing ROIC far above its cost of capital. Its efficient capital allocation and robust profitability make it a cash machine in the semiconductor equipment space. The point of vigilance is its premium valuation, which could temper upside. It fits well in an Aggressive Growth portfolio.
GLOBALFOUNDRIES Inc. offers a strategic moat rooted in manufacturing scale and potential for operational turnaround. Its lower valuation and moderate balance sheet risk provide a safer profile compared to Lam Research. However, it currently struggles with profitability and return metrics. It suits investors pursuing GARP—Growth at a Reasonable Price—seeking value in recovery stories.
If you prioritize consistent value creation and strong profitability, Lam Research outshines with superior stability and growth potential despite its premium. However, if you seek a higher-risk, value-oriented play with turnaround upside, GLOBALFOUNDRIES offers a scenario for patient investors willing to weather near-term challenges for possible long-term gains.
Disclaimer: Investment carries a risk of loss of initial capital. The past performance is not a reliable indicator of future results. Be sure to understand risks before making an investment decision.
Go Further
I encourage you to read the complete analyses of Lam Research Corporation and GLOBALFOUNDRIES Inc. to enhance your investment decisions: