Home > Comparison > Technology > KLAC vs GFS
The strategic rivalry between KLA Corporation and GLOBALFOUNDRIES Inc. shapes the semiconductor industry’s evolution. KLA operates as a capital-intensive technology innovator specializing in process control and yield management, while GLOBALFOUNDRIES focuses on high-scale semiconductor foundry manufacturing. This head-to-head pits advanced equipment innovation against large-scale chip production. This analysis aims to determine which company offers superior risk-adjusted returns for a diversified portfolio in the fast-evolving tech landscape.
Table of contents
Companies Overview
KLA Corporation and GLOBALFOUNDRIES Inc. stand as pivotal players shaping the semiconductor industry’s future.
KLA Corporation: Semiconductor Process Control Leader
KLA Corporation dominates process control and yield management solutions for semiconductor manufacturing. It earns revenue through advanced inspection, metrology, and defect analysis systems. In 2026, KLA focuses strategically on integrating software-driven process control with hardware solutions to enhance manufacturing precision and efficiency globally.
GLOBALFOUNDRIES Inc.: Semiconductor Foundry Specialist
GLOBALFOUNDRIES Inc. operates as a major semiconductor foundry, fabricating integrated circuits across diverse applications. Its core revenue derives from wafer fabrication services and manufacturing microprocessors and power management units. The company’s 2026 strategy emphasizes expanding production capacity and adopting advanced fabrication technologies to meet growing chip demand.
Strategic Collision: Similarities & Divergences
Both firms anchor their value in semiconductor technology but diverge in approach: KLA pursues a software-hardware integration model, while GLOBALFOUNDRIES relies on fabrication scale and process innovation. Their competition centers on supplying critical components and services to semiconductor manufacturers. These distinct business philosophies yield contrasting investment profiles—KLA’s precision tools versus GLOBALFOUNDRIES’ manufacturing scale.
Income Statement Comparison
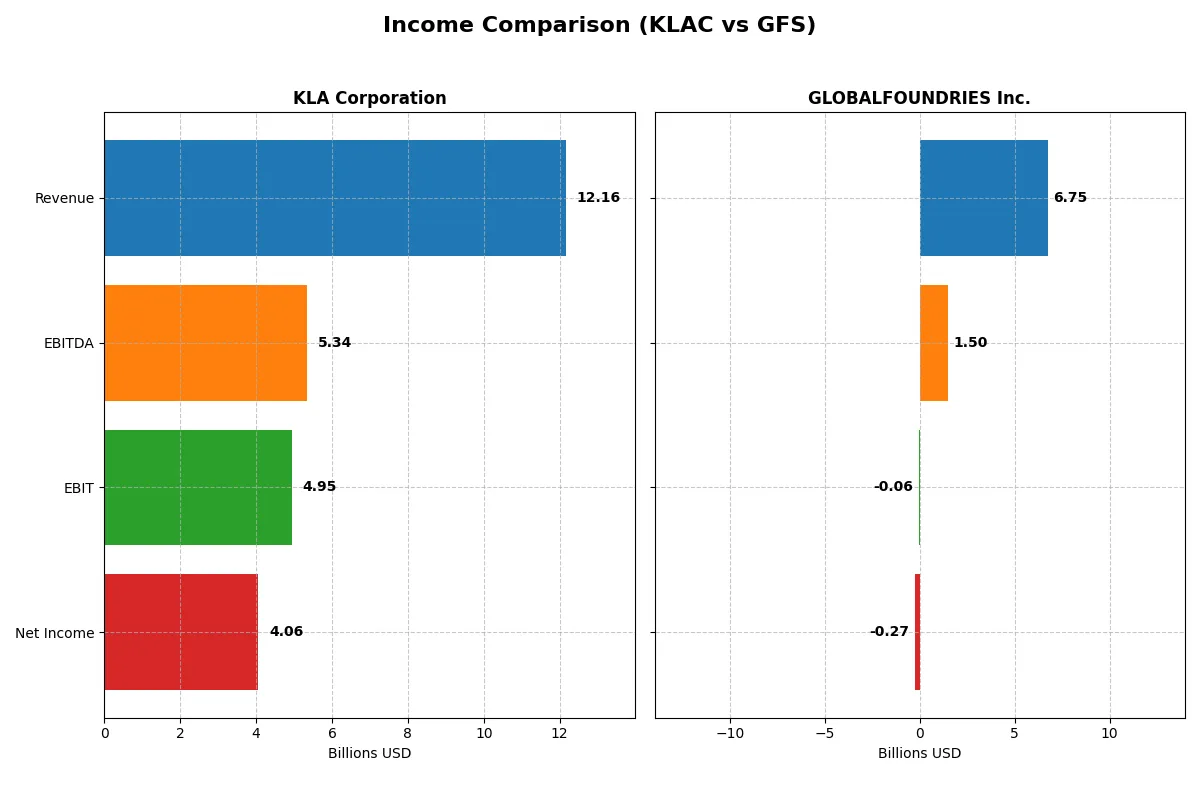
This data dissects the core profitability and scalability of both corporate engines to reveal who dominates the bottom line:
| Metric | KLA Corporation (KLAC) | GLOBALFOUNDRIES Inc. (GFS) |
|---|---|---|
| Revenue | 12.2B | 6.75B |
| Cost of Revenue | 4.58B | 5.10B |
| Operating Expenses | 2.33B | 1.87B |
| Gross Profit | 7.58B | 1.65B |
| EBITDA | 5.34B | 1.50B |
| EBIT | 4.95B | -64M |
| Interest Expense | 302M | 145M |
| Net Income | 4.06B | -265M |
| EPS | 30.53 | -0.48 |
| Fiscal Year | 2025 | 2024 |
Income Statement Analysis: The Bottom-Line Duel
This income statement comparison reveals which company runs a more efficient and profitable corporate engine in recent years.
KLA Corporation Analysis
KLA’s revenue surged from 6.9B in 2021 to 12.2B in 2025, nearly doubling with a strong upward trend in net income reaching 4.1B. Gross and net margins remain robust at 62% and 33%, respectively, indicating excellent cost control and pricing power. The 2025 fiscal year shows significant momentum with a 23.9% revenue increase and almost 50% EPS growth, reflecting superior operating efficiency.
GLOBALFOUNDRIES Inc. Analysis
GLOBALFOUNDRIES’ revenue expanded from 4.9B in 2020 to 6.75B in 2024 but declined 8.7% in the latest year. The gross margin sits at a modest 24%, while the net margin is negative at -3.9%, underscoring persistent profitability challenges. The 2024 fiscal year reveals a sharp downturn in net income to -265M, highlighting operational inefficiencies and margin compression despite earlier gains since 2020.
Margin Mastery vs. Scale Struggles
KLA delivers clear dominance with escalating revenue and strong profit margins, outpacing GLOBALFOUNDRIES’ uneven top line and negative profitability. KLA’s consistent margin expansion and income growth establish it as the fundamentally stronger entity. Investors seeking solid margin health and robust earnings momentum will find KLA’s profile more compelling in this comparison.
Financial Ratios Comparison
These vital ratios act as a diagnostic tool to expose the underlying fiscal health, valuation premiums, and capital efficiency of the companies compared below:
| Ratios | KLA Corporation (KLAC) | GLOBALFOUNDRIES Inc. (GFS) |
|---|---|---|
| ROE | 86.6% | -2.46% |
| ROIC | 38.0% | -1.47% |
| P/E | 29.3 | -89.5 |
| P/B | 25.4 | 2.20 |
| Current Ratio | 2.62 | 2.11 |
| Quick Ratio | 1.83 | 1.57 |
| D/E | 1.30 | 0.22 |
| Debt-to-Assets | 37.9% | 13.8% |
| Interest Coverage | 17.3 | -1.48 |
| Asset Turnover | 0.76 | 0.40 |
| Fixed Asset Turnover | 9.70 | 0.82 |
| Payout ratio | 22.3% | 0% |
| Dividend yield | 0.76% | 0% |
| Fiscal Year | 2025 | 2024 |
Efficiency & Valuation Duel: The Vital Signs
Financial ratios act as a company’s DNA, uncovering hidden risks and operational strengths that define its market performance.
KLA Corporation
KLA boasts exceptional profitability with an 86.6% ROE and a strong 33.4% net margin, signaling operational excellence. However, its valuation appears stretched, with a P/E of 29.3 and P/B at 25.4, reflecting premium pricing. Dividend yield remains modest at 0.76%, while significant reinvestment in R&D supports sustained growth.
GLOBALFOUNDRIES Inc.
GLOBALFOUNDRIES suffers from negative profitability, showing a -2.5% ROE and a -3.9% net margin, indicating operational challenges. Its valuation metrics are more attractive, with a negative P/E and a P/B of 2.2, suggesting undervaluation. The company pays no dividend, focusing capital on restructuring and growth to improve fundamentals.
Premium Valuation vs. Operational Safety
KLA offers superior profitability but at a premium valuation, carrying higher risk for stretched multiples. GLOBALFOUNDRIES trades cheaply but struggles with losses and weak returns. Investors seeking operational strength will lean toward KLA, while those favoring discounted risk may consider GLOBALFOUNDRIES’s turnaround potential.
Which one offers the Superior Shareholder Reward?
I observe KLA Corporation (KLAC) and GLOBALFOUNDRIES Inc. (GFS) pursue contrasting shareholder reward strategies. KLAC pays a modest dividend yield near 0.76% with a sustainable payout ratio around 22%. It covers dividends comfortably with strong free cash flow of 28/share and also executes significant buybacks, enhancing total returns. Conversely, GFS does not pay dividends, instead reinvesting heavily in growth and capex, as seen in its low free cash flow and negative net income margins. GFS buybacks are minimal or absent, limiting immediate shareholder returns. Historically in tech capital equipment, dividends plus buybacks offer more predictable long-term value. I conclude KLAC provides a superior total shareholder reward in 2026 due to balanced payouts, robust cash flow, and active buybacks, while GFS’s reinvestment approach carries higher risk and delayed returns.
Comparative Score Analysis: The Strategic Profile
The radar chart reveals the fundamental DNA and trade-offs of both firms, highlighting their distinct strategic strengths and vulnerabilities:
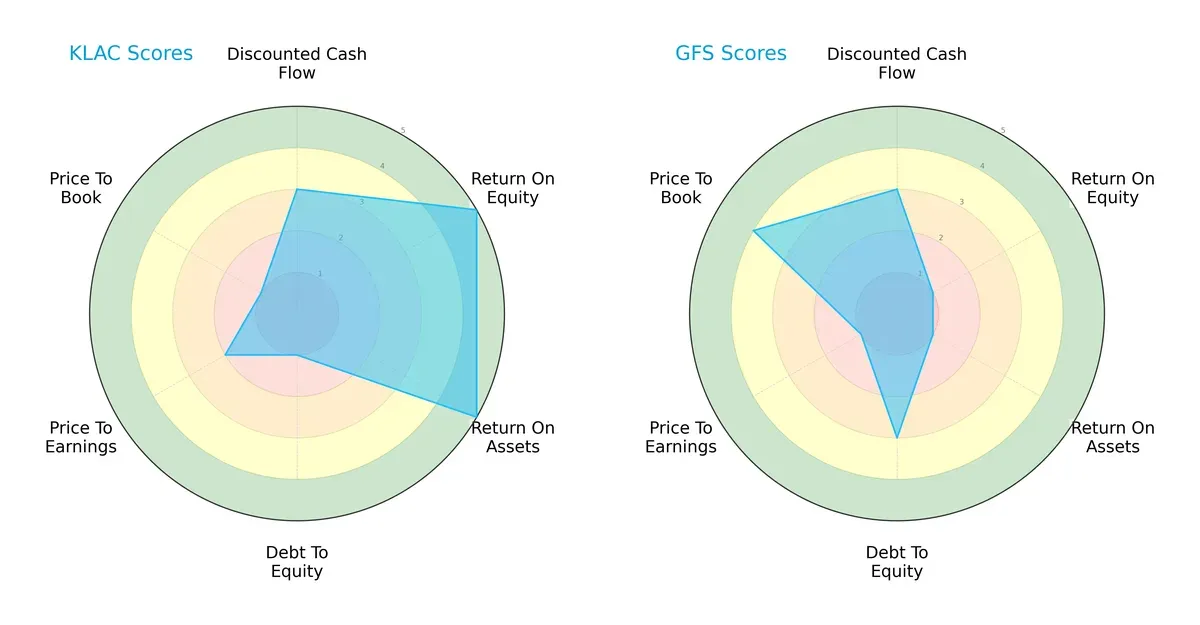
KLA Corporation exhibits superior operational efficiency with top-tier ROE and ROA scores (5 each), signaling robust asset and equity utilization. However, its financial leverage poses a serious red flag, marked by a very unfavorable debt-to-equity score (1). GLOBALFOUNDRIES Inc. displays a more balanced capital structure with a moderate debt-to-equity score (3), but it suffers from underwhelming profitability metrics, reflected in very unfavorable ROE and ROA scores (1 each). Valuation metrics also diverge; KLA’s price-to-book score is very unfavorable (1), whereas GLOBALFOUNDRIES shows a favorable price-to-book score (4), suggesting potential undervaluation. Overall, KLA relies heavily on operational excellence but carries higher financial risk, while GLOBALFOUNDRIES maintains a steadier balance sheet but struggles with profitability.
—
Bankruptcy Risk: Solvency Showdown
The Altman Z-Score delta between KLA Corporation (12.6) and GLOBALFOUNDRIES Inc. (3.0) implies contrasting long-term survival prospects in this cycle:
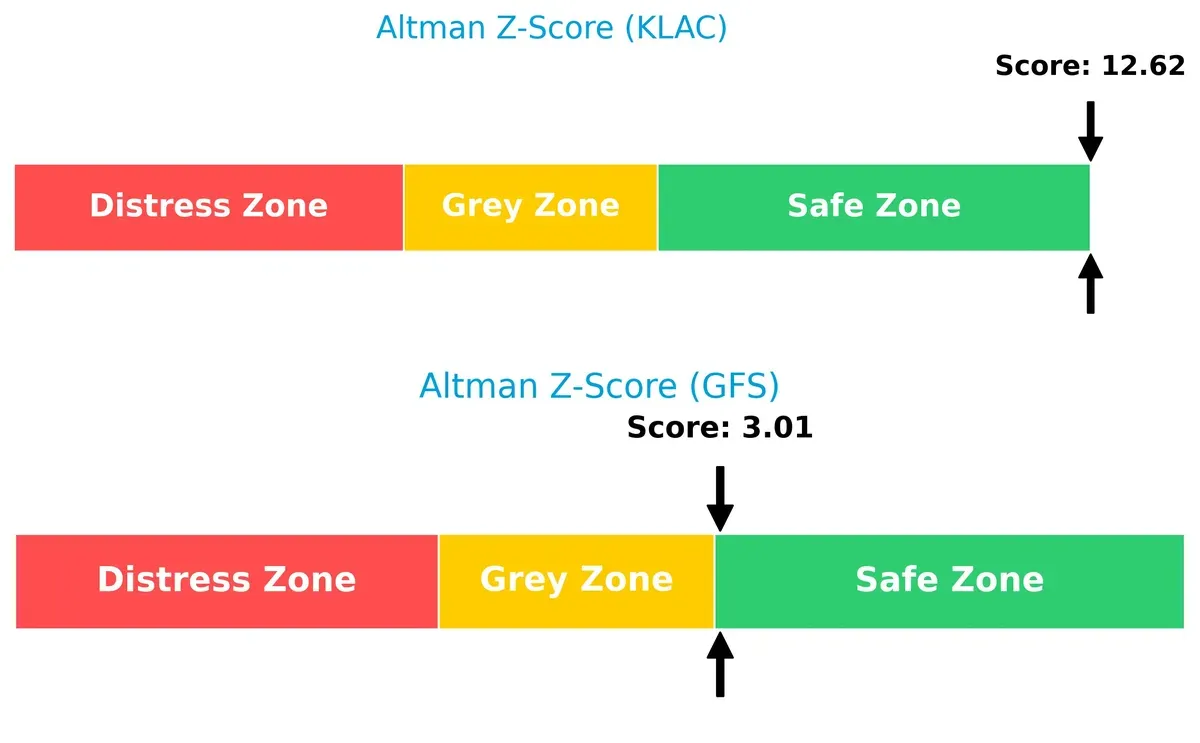
KLA’s exceptionally high Z-score firmly places it in the safe zone, indicating minimal bankruptcy risk and strong financial resilience. GLOBALFOUNDRIES, while still in the safe zone, sits just above the threshold, suggesting a moderate risk profile that investors must monitor closely amid economic shifts.
—
Financial Health: Quality of Operations
Piotroski F-Scores reveal KLA Corporation’s superior financial health over GLOBALFOUNDRIES Inc., highlighting crucial operational distinctions:
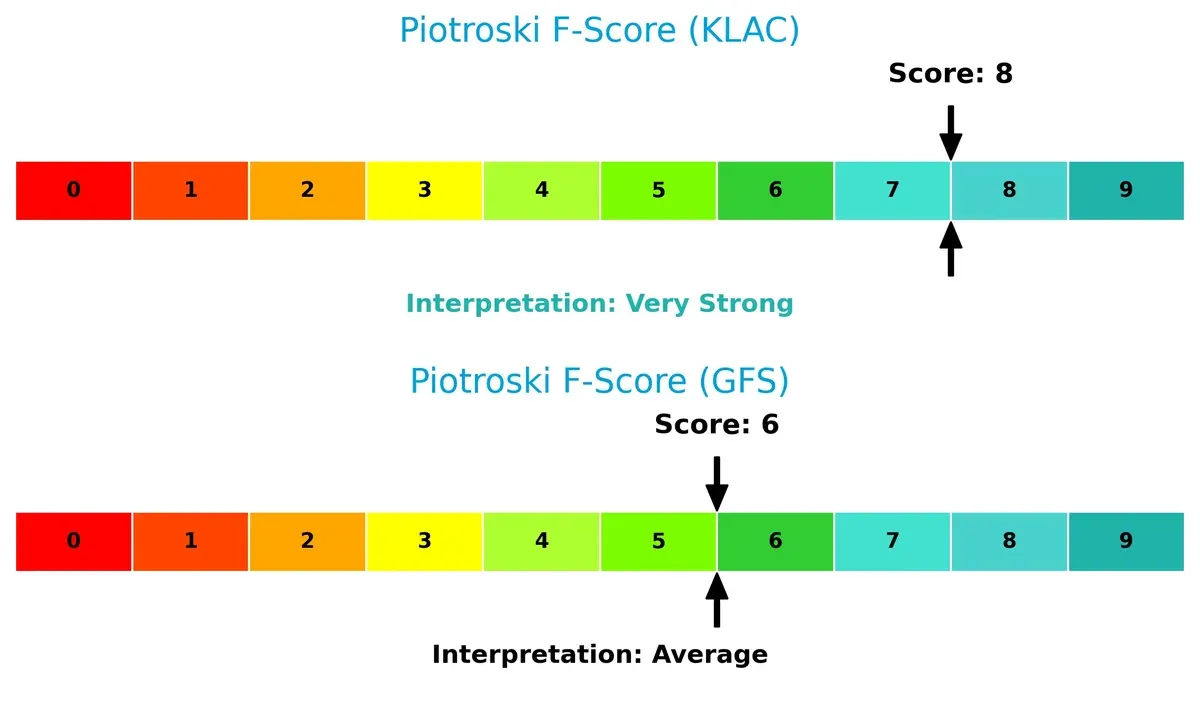
KLA’s score of 8 signals very strong financial quality, underpinned by solid profitability, liquidity, and efficiency. GLOBALFOUNDRIES, with a score of 6, reflects average financial health, exposing some internal vulnerabilities. This gap underscores KLA’s operational robustness versus GLOBALFOUNDRIES’ need for strategic improvements to mitigate red flags in its financial metrics.
How are the two companies positioned?
This section dissects the operational DNA of KLAC and GFS by comparing their revenue distribution and internal dynamics. The goal is to confront their economic moats to identify which model offers the most resilient, sustainable advantage today.
Revenue Segmentation: The Strategic Mix
This comparison dissects how KLA Corporation and GLOBALFOUNDRIES Inc. diversify income streams and where their primary sector bets lie:
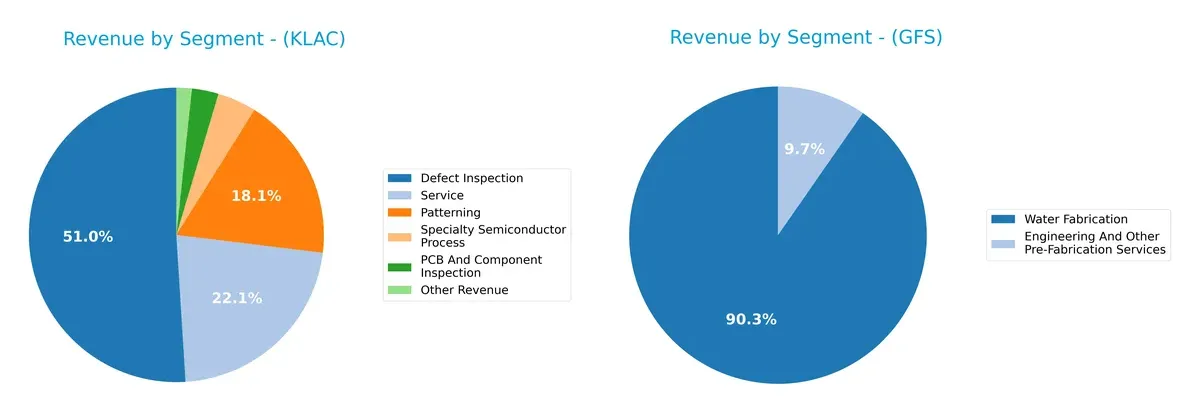
KLA Corporation pivots on Defect Inspection, generating $6.2B in 2025, anchoring its revenue with strong Service ($2.7B) and Patterning ($2.2B) segments. This mix reflects ecosystem lock-in through inspection and support services. GLOBALFOUNDRIES relies heavily on Water Fabrication, $6.1B in 2024, with a smaller $652M Engineering segment. GFS’s concentration signals infrastructure dominance but exposes it to higher segment risk compared to KLA’s diversified portfolio.
Strengths and Weaknesses Comparison
This table compares the strengths and weaknesses of KLA Corporation and GLOBALFOUNDRIES Inc.:
KLA Corporation Strengths
- High profitability with 33.41% net margin
- Very strong ROE at 86.56%
- Robust current and quick ratios indicating liquidity
- Diverse semiconductor process segments
- Significant global presence in Asia and Americas
GLOBALFOUNDRIES Strengths
- Low debt-to-equity ratio at 0.22 supports financial stability
- Favorable P/E ratio despite losses
- Solid current and quick ratios indicate good liquidity
- Strong revenue base in wafer fabrication
- Concentrated US market presence
KLA Corporation Weaknesses
- Elevated price-to-book ratio of 25.39 suggests valuation risk
- High debt-to-equity ratio of 1.3 signals leverage concerns
- WACC higher than ROIC, indicating capital cost pressure
- Moderate asset turnover limits efficiency
- Low dividend yield at 0.76%
GLOBALFOUNDRIES Weaknesses
- Negative profitability metrics including net margin and ROE
- Poor interest coverage ratio at -0.44 warns of financial stress
- Low asset turnover and fixed asset turnover show operational inefficiency
- No dividend yield reduces income appeal
Both companies show contrasting financial profiles. KLA excels in profitability and diversified products but carries valuation and leverage risks. GLOBALFOUNDRIES maintains liquidity and lower leverage but struggles with profitability and operational efficiency. These factors shape strategic priorities differently.
The Moat Duel: Analyzing Competitive Defensibility
A company’s structural moat shields long-term profits from competitive forces eroding market share and pricing power:
KLA Corporation: Precision Process Control Moat
KLA’s moat stems from high switching costs and proprietary inspection tech, reflected in a 40.7% EBIT margin and 27.5% ROIC above WACC. Its expanding semiconductor process control solutions deepen this advantage in 2026.
GLOBALFOUNDRIES Inc.: Scale-Dependent Cost Advantage Moat
GLOBALFOUNDRIES relies on manufacturing scale and operational efficiency, contrasting with KLA’s tech moat. Despite a negative EBIT margin, its improving ROIC trend signals potential, though profitability remains vulnerable in 2026.
Precision Tech vs. Scale Efficiency: The Moat Battle
KLA’s wide and durable moat outmatches GLOBALFOUNDRIES’ less stable cost advantage. KLA is better positioned to defend profits and innovate amid semiconductor market complexities.
Which stock offers better returns?
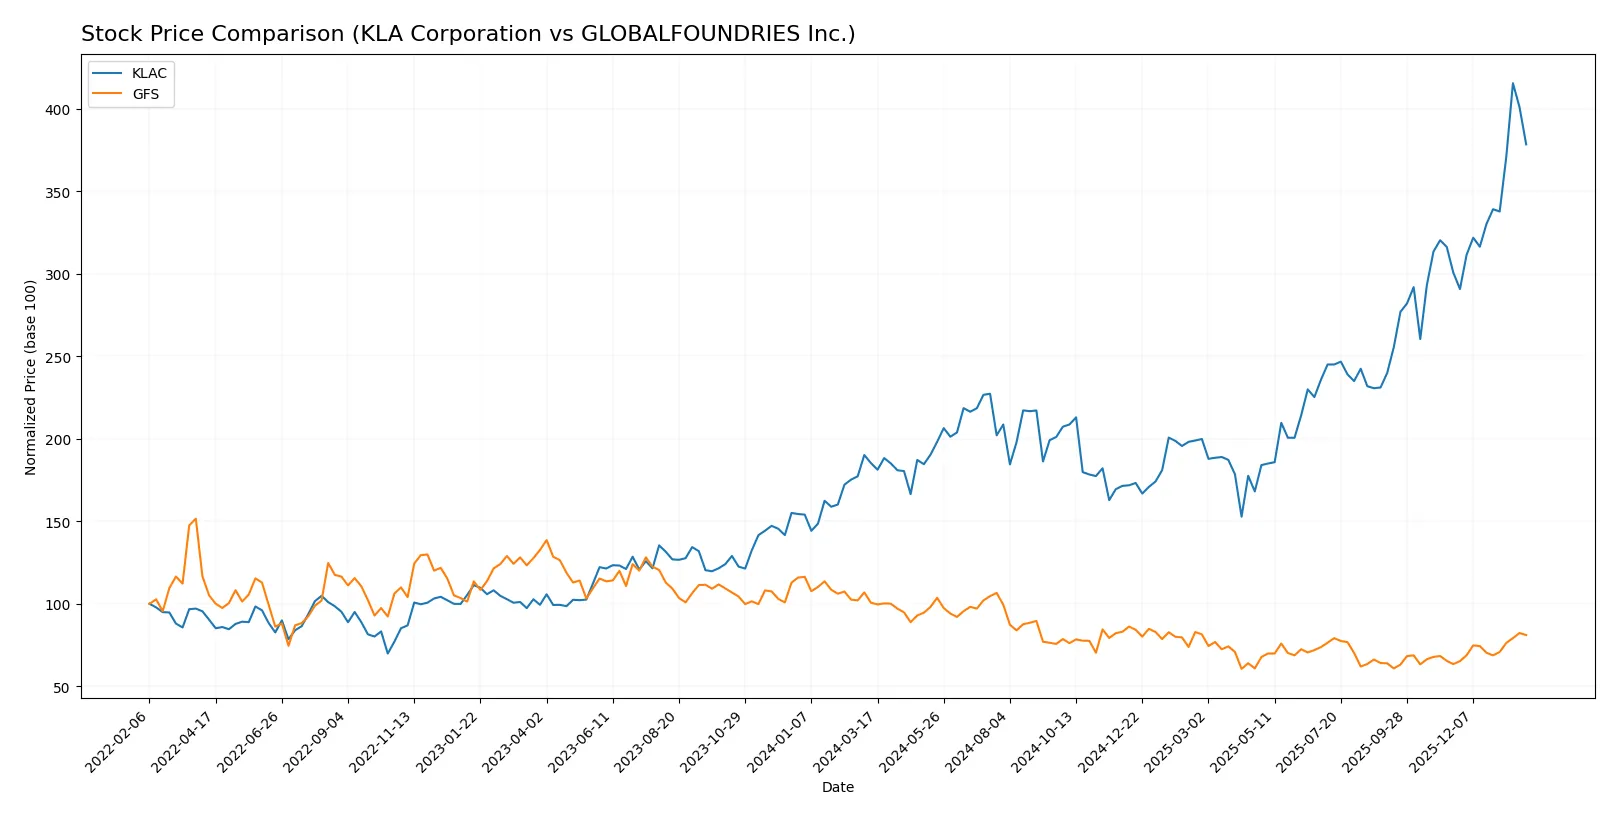
The past year shows stark divergence in price dynamics: KLA Corporation surges over 100%, while GLOBALFOUNDRIES Inc. declines nearly 20%, illustrating contrasting market receptions and momentum shifts.
Trend Comparison
KLA Corporation’s stock rose 104.22% over the past 12 months, marking a bullish trend with accelerating gains. It reached a high of 1567.82 and a low of 576.53, showing significant volatility with a 213.25 std deviation.
GLOBALFOUNDRIES Inc. fell 19.48% over the same period, confirming a bearish trend despite acceleration. Its price fluctuated between 31.54 and 55.5, with minimal volatility at a 6.18 std deviation.
KLA’s strong bullish performance clearly outpaces GLOBALFOUNDRIES’ bearish slide, delivering the highest market returns over the past year.
Target Prices
Analysts provide a clear target price consensus for KLA Corporation and GLOBALFOUNDRIES Inc., showing defined expectations.
| Company | Target Low | Target High | Consensus |
|---|---|---|---|
| KLA Corporation | 1400 | 1900 | 1672 |
| GLOBALFOUNDRIES Inc. | 37 | 40 | 38.5 |
KLA’s consensus target of 1672 exceeds its current price of 1428, signaling upside potential. GLOBALFOUNDRIES’ 38.5 consensus sits just below its current 42.2 price, indicating modest downside risk.

Don’t Let Luck Decide Your Entry Point
Optimize your entry points with our advanced ProRealTime indicators. You’ll get efficient buy signals with precise price targets for maximum performance. Start outperforming now!
How do institutions grade them?
KLA Corporation Grades
The table below summarizes recent grades issued by major institutions for KLA Corporation.
| Grading Company | Action | New Grade | Date |
|---|---|---|---|
| Oppenheimer | Maintain | Outperform | 2026-01-30 |
| Barclays | Maintain | Overweight | 2026-01-30 |
| Cantor Fitzgerald | Maintain | Overweight | 2026-01-30 |
| Jefferies | Maintain | Buy | 2026-01-30 |
| Stifel | Maintain | Buy | 2026-01-30 |
| Wells Fargo | Maintain | Overweight | 2026-01-30 |
| Needham | Maintain | Buy | 2026-01-30 |
| RBC Capital | Maintain | Sector Perform | 2026-01-30 |
| Deutsche Bank | Maintain | Hold | 2026-01-21 |
| Needham | Maintain | Buy | 2026-01-20 |
GLOBALFOUNDRIES Inc. Grades
The table below summarizes recent grades issued by major institutions for GLOBALFOUNDRIES Inc.
| Grading Company | Action | New Grade | Date |
|---|---|---|---|
| Citigroup | Maintain | Neutral | 2026-01-15 |
| Wedbush | Downgrade | Neutral | 2025-12-31 |
| B of A Securities | Maintain | Underperform | 2025-12-04 |
| Citigroup | Maintain | Neutral | 2025-11-13 |
| Evercore ISI Group | Maintain | Outperform | 2025-11-13 |
| JP Morgan | Maintain | Neutral | 2025-11-13 |
| Wedbush | Maintain | Outperform | 2025-11-13 |
| B of A Securities | Downgrade | Underperform | 2025-10-13 |
| Wedbush | Maintain | Outperform | 2025-08-06 |
| Morgan Stanley | Maintain | Equal Weight | 2025-08-06 |
Which company has the best grades?
KLA Corporation consistently receives stronger grades, mostly Buy or Overweight, compared to GLOBALFOUNDRIES, which faces multiple Neutral and Underperform ratings. This difference suggests greater analyst confidence in KLA’s outlook, potentially influencing investor sentiment toward stability and growth prospects.
Risks specific to each company
The following categories identify the critical pressure points and systemic threats facing both firms in the 2026 market environment:
1. Market & Competition
KLA Corporation
- Dominates semiconductor process control with strong market position and diverse product segments.
GLOBALFOUNDRIES Inc.
- Faces intense competition in foundry services; less diversified product base.
2. Capital Structure & Debt
KLA Corporation
- High debt-to-equity ratio (1.3) signals elevated leverage risk despite strong interest coverage.
GLOBALFOUNDRIES Inc.
- Low debt-to-equity (0.22) indicates conservative leverage and stronger balance sheet.
3. Stock Volatility
KLA Corporation
- Beta of 1.444 reflects moderate volatility, typical for tech sector leaders.
GLOBALFOUNDRIES Inc.
- Slightly higher beta at 1.485 suggests greater stock price sensitivity.
4. Regulatory & Legal
KLA Corporation
- Subject to stringent semiconductor export controls and intellectual property regulations.
GLOBALFOUNDRIES Inc.
- Exposed to foundry-specific regulatory scrutiny, including environmental compliance.
5. Supply Chain & Operations
KLA Corporation
- Benefits from integrated manufacturing and inspection control; supply chain risks mitigated by scale.
GLOBALFOUNDRIES Inc.
- More vulnerable to supply chain disruptions given heavy reliance on wafer fabrication inputs.
6. ESG & Climate Transition
KLA Corporation
- Increasing focus on sustainability practices aligns with investor expectations.
GLOBALFOUNDRIES Inc.
- Faces challenges transitioning foundry operations to lower carbon footprint.
7. Geopolitical Exposure
KLA Corporation
- Exposure to US-China tensions impacting semiconductor supply and technology transfer.
GLOBALFOUNDRIES Inc.
- Similar geopolitical risks compounded by global foundry client dependencies.
Which company shows a better risk-adjusted profile?
KLA’s most impactful risk is its high leverage, despite strong profitability and liquidity. GLOBALFOUNDRIES struggles with negative profitability and operational inefficiencies, posing its greatest risk. KLA’s superior Altman Z-Score (12.6 vs. 3.0) and Piotroski score (8 vs. 6) indicate a stronger, safer financial profile. KLA’s ability to maintain robust margins amid market volatility justifies cautious optimism, while GLOBALFOUNDRIES’ ongoing losses warrant investor prudence.
Final Verdict: Which stock to choose?
KLA Corporation’s superpower lies in its robust and durable competitive advantage, evidenced by a soaring ROIC well above its cost of capital. It demonstrates operational excellence and strong profitability growth. A point of vigilance is its elevated debt-to-equity ratio, which could pressure financial flexibility. KLAC suits portfolios aiming for aggressive growth with a tolerance for valuation premiums.
GLOBALFOUNDRIES Inc. boasts a strategic moat in its low leverage and solid liquidity, offering a safer balance sheet relative to KLAC. However, it struggles with profitability and value creation, reflected in negative returns on capital. GFS fits investors favoring growth at a reasonable price who prioritize stability and potential turnaround plays over immediate earnings strength.
If you prioritize durable value creation and premium growth, KLAC outshines with its exceptional capital efficiency and earnings momentum. However, if you seek a more conservative profile with lower leverage and a potential recovery story, GFS offers better stability despite current profitability challenges. Each represents distinct analytical scenarios tailored to different risk appetites and investment horizons.
Disclaimer: Investment carries a risk of loss of initial capital. The past performance is not a reliable indicator of future results. Be sure to understand risks before making an investment decision.
Go Further
I encourage you to read the complete analyses of KLA Corporation and GLOBALFOUNDRIES Inc. to enhance your investment decisions: