GLOBALFOUNDRIES Inc. (GFS) and Arm Holdings plc (ARM) are two prominent players in the semiconductor industry, each shaping technology with unique approaches. GLOBALFOUNDRIES focuses on manufacturing integrated circuits, while Arm specializes in CPU architecture and licensing. Their market overlap and innovation strategies make them compelling companies to compare. In this article, I will help you determine which stock offers the most attractive investment opportunity.

Table of contents
Companies Overview
I will begin the comparison between GLOBALFOUNDRIES Inc. and Arm Holdings plc by providing an overview of these two companies and their main differences.
GLOBALFOUNDRIES Overview
GLOBALFOUNDRIES Inc. operates as a semiconductor foundry worldwide, manufacturing integrated circuits that power various electronic devices. Its product range includes microprocessors, mobile application processors, baseband processors, and power management units. Founded in 2009 and based in Malta, New York, GLOBALFOUNDRIES maintains a significant presence in semiconductor fabrication with 13K employees and a market cap of about 20.4B USD.
Arm Holdings Overview
Arm Holdings plc focuses on designing and licensing CPU products and related technologies used by semiconductor firms and OEMs. Its portfolio includes microprocessors, graphics processing units, and system IPs, supporting markets like automotive, computing, and IoT. Established in 1990 and headquartered in Cambridge, UK, Arm employs 8.3K people and has a market cap of approximately 121.2B USD, operating as a subsidiary of Kronos II LLC.
Key similarities and differences
Both companies operate in the semiconductor industry but differ in their core business models: GLOBALFOUNDRIES specializes in semiconductor manufacturing and wafer fabrication services, while Arm designs and licenses semiconductor intellectual property. GLOBALFOUNDRIES is US-based with a larger workforce, whereas Arm, based in the UK, focuses on technology design and licensing with a higher market capitalization and global operational footprint.
Income Statement Comparison
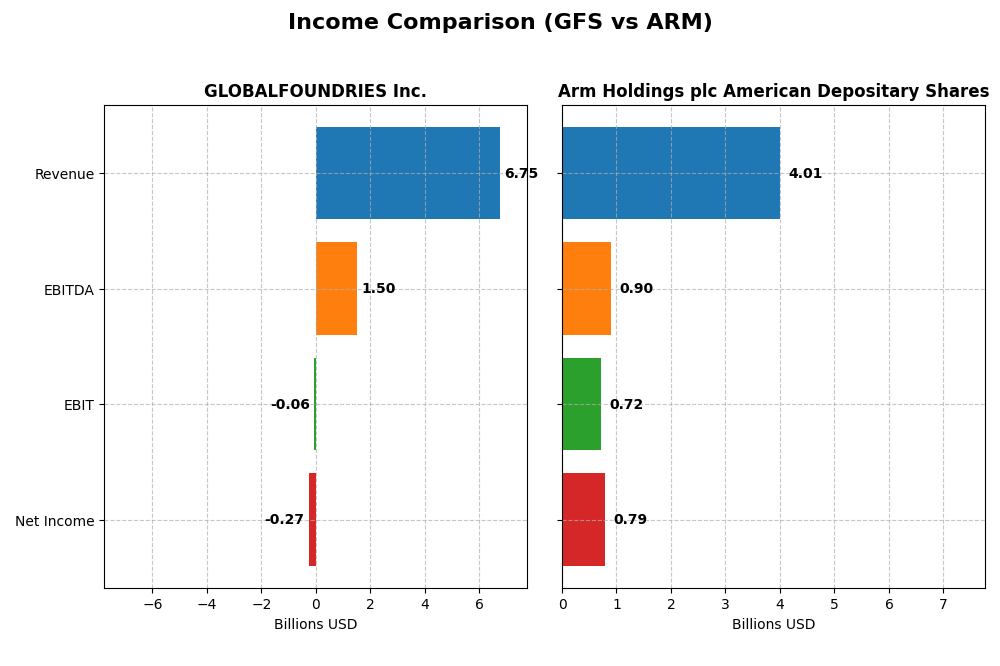
The table below compares the most recent fiscal year income statement metrics for GLOBALFOUNDRIES Inc. and Arm Holdings plc American Depositary Shares.
| Metric | GLOBALFOUNDRIES Inc. (GFS) | Arm Holdings plc ADS (ARM) |
|---|---|---|
| Market Cap | 20.4B | 121.2B |
| Revenue | 6.75B | 4.01B |
| EBITDA | 1.50B | 903M |
| EBIT | -64M | 720M |
| Net Income | -265M | 792M |
| EPS | -0.48 | 0.75 |
| Fiscal Year | 2024 | 2025 |
Income Statement Interpretations
GLOBALFOUNDRIES Inc.
Between 2020 and 2024, GLOBALFOUNDRIES Inc. showed a revenue increase of 39.15% but experienced a net income decline in the most recent year, resulting in a negative net margin of -3.93%. Margins fluctuated, with a gross margin of 24.46% remaining favorable while EBIT margin turned unfavorable at -0.95%. The 2024 performance reflected decreased revenue and profitability.
Arm Holdings plc American Depositary Shares
Arm Holdings plc demonstrated consistent revenue and net income growth from 2021 to 2025, with a 97.68% revenue increase and a 104.12% net income rise overall. Margins improved steadily, featuring a high gross margin of 94.86% and a net margin of 19.77%. The 2025 fiscal year showed strong growth momentum, including a 23.94% revenue increase and expanded profitability.
Which one has the stronger fundamentals?
Arm Holdings exhibits stronger fundamentals with predominantly favorable income statement metrics, including robust margin improvements and consistent growth across revenue, EBIT, and net income. GLOBALFOUNDRIES, despite some overall growth, shows recent declines and unfavorable margins, indicating weaker current profitability and operational challenges relative to Arm.
Financial Ratios Comparison
The table below compares key financial ratios for GLOBALFOUNDRIES Inc. (GFS) and Arm Holdings plc American Depositary Shares (ARM) for their most recent fiscal periods, providing investors with a snapshot of profitability, liquidity, leverage, and efficiency metrics.
| Ratios | GLOBALFOUNDRIES Inc. (2024) | Arm Holdings plc (2025) |
|---|---|---|
| ROE | -2.46% | 11.58% |
| ROIC | -2.26% | 10.28% |
| P/E | -89.54 | 141.58 |
| P/B | 2.20 | 16.40 |
| Current Ratio | 2.11 | 5.20 |
| Quick Ratio | 1.57 | 5.20 |
| D/E | 0.22 | 0.05 |
| Debt-to-Assets | 13.81% | 3.99% |
| Interest Coverage | -1.48 | 0 (not meaningful) |
| Asset Turnover | 0.40 | 0.45 |
| Fixed Asset Turnover | 0.82 | 5.61 |
| Payout Ratio | 0% | 0% |
| Dividend Yield | 0% | 0% |
Interpretation of the Ratios
GLOBALFOUNDRIES Inc.
GLOBALFOUNDRIES shows a mixed ratio profile with significant weaknesses: negative net margin (-3.93%), return on equity (-2.46%), and return on invested capital (-2.26%) indicate profitability challenges. However, liquidity ratios are strong, with a current ratio of 2.11 and debt-to-equity at 0.22. The company pays no dividends, likely reflecting its current financial performance and reinvestment needs.
Arm Holdings plc American Depositary Shares
Arm Holdings presents moderate profitability with a favorable net margin of 19.77% and neutral ROE at 11.58%, but some concerns arise from high valuation ratios such as a PE of 141.58 and PB of 16.4, which are unfavorable. The liquidity is mixed: a high current ratio of 5.2 is unfavorable but quick ratio is favorable. The company does not pay dividends, consistent with a growth and reinvestment strategy.
Which one has the best ratios?
Comparing the two, Arm Holdings demonstrates stronger profitability and some favorable leverage metrics but suffers from high valuation and liquidity concerns. GLOBALFOUNDRIES has weaker profitability and coverage ratios but better liquidity and leverage. Overall, Arm’s ratios are slightly more favorable, though both show notable weaknesses in different areas.
Strategic Positioning
This section compares the strategic positioning of GLOBALFOUNDRIES Inc. (GFS) and Arm Holdings plc (ARM), focusing on Market position, Key segments, and Exposure to technological disruption:
GLOBALFOUNDRIES Inc.
- Operates as a semiconductor foundry with significant fabrication capacity, facing competitive pressure in wafer manufacturing.
- Key segments include wafer fabrication and engineering services, driving revenue mainly from physical semiconductor manufacturing.
- Exposure to disruption through manufacturing technologies, adapting wafer fabrication to evolving semiconductor device needs.
Arm Holdings plc American Depositary Shares
- Licenses CPU and related technologies globally, with strong presence in diverse markets and OEM partnerships.
- Focuses on licensing and royalty revenue from microprocessors and related IP across automotive, computing, and IoT sectors.
- Faces disruption risks in semiconductor IP development but benefits from broad applications across multiple technology markets.
GLOBALFOUNDRIES Inc. vs Arm Holdings plc Positioning
GFS concentrates on physical semiconductor manufacturing services, while ARM pursues a diversified licensing model across multiple markets. GFS depends heavily on wafer fabrication, offering scale advantages but facing capital intensity. ARM’s broad IP licensing provides recurring revenue but faces competitive IP disruption.
Which has the best competitive advantage?
Both companies are currently shedding value with ROIC below WACC; GFS shows improving profitability trends, whereas ARM’s profitability remains stable but unfavorable, indicating neither has a strong economic moat at present.
Stock Comparison
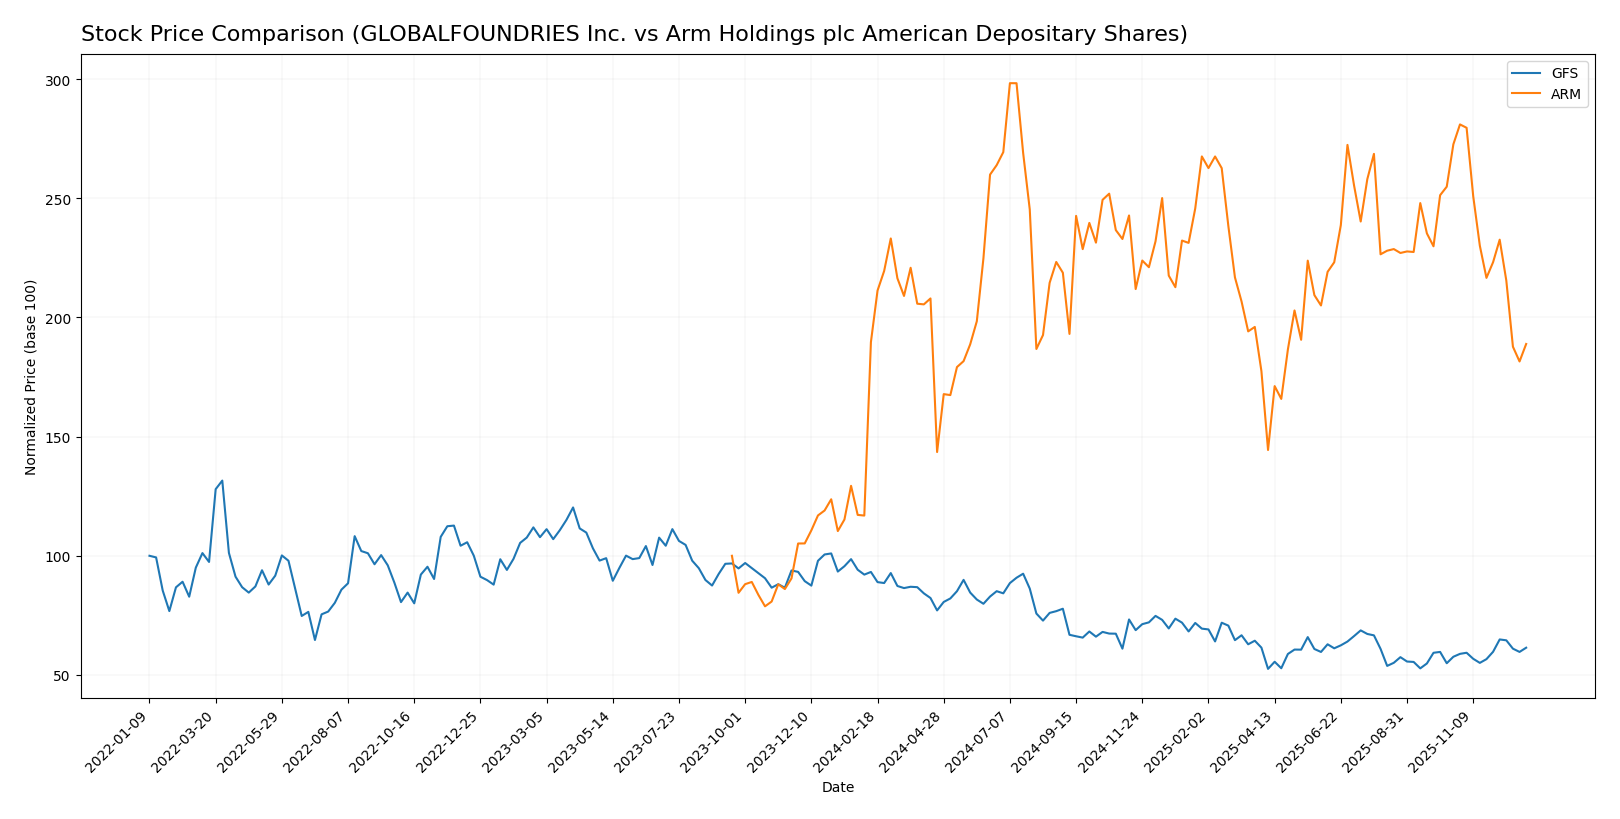
The stock price movements of GLOBALFOUNDRIES Inc. (GFS) and Arm Holdings plc American Depositary Shares (ARM) over the past year reveal contrasting trends marked by significant volatility and divergent acceleration patterns.
Trend Analysis
GLOBALFOUNDRIES Inc. (GFS) experienced a bearish trend over the past 12 months with a price decline of 34.09%, showing acceleration and a standard deviation of 6.71. Its price ranged between 31.54 and 55.94.
Arm Holdings plc (ARM) showed a marginal bearish trend with a -0.42% price change over the last year, experiencing deceleration and higher volatility, indicated by a 19.03 standard deviation, with prices fluctuating from 87.19 to 181.19.
Comparing the two, ARM delivered the highest relative market performance with a nearly flat trend versus a substantial decline for GFS, despite both stocks ending the period in bearish territory.
Target Prices
Analysts present a confident target price consensus for both GLOBALFOUNDRIES Inc. and Arm Holdings plc.
| Company | Target High | Target Low | Consensus |
|---|---|---|---|
| GLOBALFOUNDRIES Inc. | 40 | 37 | 38.5 |
| Arm Holdings plc American Depositary Shares | 210 | 120 | 173.33 |
The target consensus for GLOBALFOUNDRIES suggests a modest upside from the current price of $36.87, while Arm Holdings shows a significant potential increase from $114.73, reflecting strong analyst optimism for growth.
Analyst Opinions Comparison
This section compares analysts’ ratings and grades for GLOBALFOUNDRIES Inc. and Arm Holdings plc American Depositary Shares:
Rating Comparison
GLOBALFOUNDRIES Inc. Rating
- Rating: C+, considered Very Favorable
- Discounted Cash Flow Score: 3, Moderate
- ROE Score: 1, Very Unfavorable
- ROA Score: 1, Very Unfavorable
- Debt To Equity Score: 3, Moderate
- Overall Score: 2, Moderate
Arm Holdings plc American Depositary Shares Rating
- Rating: B-, considered Very Favorable
- Discounted Cash Flow Score: 2, Moderate
- ROE Score: 3, Moderate
- ROA Score: 4, Favorable
- Debt To Equity Score: 4, Favorable
- Overall Score: 3, Moderate
Which one is the best rated?
Based on the provided data, Arm Holdings holds a higher overall rating (B-) with better ROE, ROA, and debt-to-equity scores compared to GLOBALFOUNDRIES’ C+. Arm also shows a stronger overall score.
Scores Comparison
Here is the comparison of the Altman Z-Score and Piotroski Score for GLOBALFOUNDRIES Inc. and Arm Holdings plc:
GFS Scores
- Altman Z-Score: 2.03, positioned in the grey zone indicating moderate bankruptcy risk.
- Piotroski Score: 6, categorized as average financial strength.
ARM Scores
- Altman Z-Score: 32.36, well within the safe zone, indicating low bankruptcy risk.
- Piotroski Score: 7, considered strong financial health.
Which company has the best scores?
Arm Holdings plc shows stronger financial health with a safe zone Altman Z-Score and a strong Piotroski Score. GLOBALFOUNDRIES is in a grey zone for bankruptcy risk with an average Piotroski Score, indicating comparatively moderate financial stability.
Grades Comparison
The following section presents a comparison of the most recent reliable grades assigned to GLOBALFOUNDRIES Inc. and Arm Holdings plc American Depositary Shares:
GLOBALFOUNDRIES Inc. Grades
This table displays recent grades and rating changes from established grading companies for GLOBALFOUNDRIES Inc.
| Grading Company | Action | New Grade | Date |
|---|---|---|---|
| Wedbush | Downgrade | Neutral | 2025-12-31 |
| B of A Securities | Maintain | Underperform | 2025-12-04 |
| Citigroup | Maintain | Neutral | 2025-11-13 |
| Wedbush | Maintain | Outperform | 2025-11-13 |
| JP Morgan | Maintain | Neutral | 2025-11-13 |
| Evercore ISI Group | Maintain | Outperform | 2025-11-13 |
| B of A Securities | Downgrade | Underperform | 2025-10-13 |
| Deutsche Bank | Maintain | Buy | 2025-08-06 |
| Morgan Stanley | Maintain | Equal Weight | 2025-08-06 |
| Wedbush | Maintain | Outperform | 2025-08-06 |
Grades for GLOBALFOUNDRIES Inc. show a mixed but generally cautious stance, with multiple neutral and underperform ratings and some outperformance maintained.
Arm Holdings plc American Depositary Shares Grades
This table displays recent grades and rating changes from established grading companies for Arm Holdings plc American Depositary Shares.
| Grading Company | Action | New Grade | Date |
|---|---|---|---|
| B of A Securities | Maintain | Buy | 2025-12-16 |
| Goldman Sachs | Downgrade | Sell | 2025-12-15 |
| Loop Capital | Maintain | Buy | 2025-11-12 |
| Rosenblatt | Maintain | Buy | 2025-11-06 |
| Barclays | Maintain | Overweight | 2025-11-06 |
| Mizuho | Maintain | Outperform | 2025-11-06 |
| Needham | Maintain | Hold | 2025-11-06 |
| UBS | Maintain | Buy | 2025-11-06 |
| TD Cowen | Maintain | Buy | 2025-11-06 |
| Keybanc | Maintain | Overweight | 2025-11-06 |
Arm Holdings’ grades predominantly reflect positive sentiment with multiple buy and overweight ratings, though a recent downgrade to sell by Goldman Sachs suggests some caution.
Which company has the best grades?
Arm Holdings plc holds generally stronger grades than GLOBALFOUNDRIES Inc., with more consistent buy and outperform ratings. This suggests relatively more optimistic analyst sentiment, potentially influencing investor confidence and portfolio allocation decisions.
Strengths and Weaknesses
Below is a comparison of key strengths and weaknesses for GLOBALFOUNDRIES Inc. (GFS) and Arm Holdings plc (ARM), based on their recent financial and operational data.
| Criterion | GLOBALFOUNDRIES Inc. (GFS) | Arm Holdings plc (ARM) |
|---|---|---|
| Diversification | Moderate; revenue mainly from Water Fabrication (6.1B) and Engineering Services (652M) | Focused; revenue from Licensing (1.8B) and Royalties (2.2B) |
| Profitability | Low profitability; negative net margin (-3.93%) and ROE (-2.46%) | Strong profitability; net margin 19.77%, ROE 11.58% |
| Innovation | Improving ROIC trend but currently value destroying; moderate innovation capacity | Stable ROIC; strong innovation evidenced by licensing model |
| Global presence | Significant manufacturing footprint globally; broad industrial reach | Extensive IP licensing network worldwide |
| Market Share | Solid position in semiconductor fabrication services | Leading position in semiconductor IP licensing |
Key takeaways: GLOBALFOUNDRIES shows promising ROIC growth but currently destroys value with weak profitability and moderate diversification. Arm Holdings benefits from strong profitability and global licensing reach but faces challenges in capital efficiency. Investors should weigh innovation and market position against profitability risks in both.
Risk Analysis
Below is a comparative table highlighting key risk metrics for GLOBALFOUNDRIES Inc. (GFS) and Arm Holdings plc (ARM) based on the most recent fiscal years.
| Metric | GLOBALFOUNDRIES Inc. (GFS) | Arm Holdings plc (ARM) |
|---|---|---|
| Market Risk | Beta 1.48 (moderate) | Beta 4.25 (high volatility) |
| Debt Level | Debt/Equity 0.22 (low) | Debt/Equity 0.05 (very low) |
| Regulatory Risk | Moderate (US tech sector) | Elevated (Global, UK & China) |
| Operational Risk | Negative margins & ROE | Higher margins, some inefficiency |
| Environmental Risk | Standard industry concerns | Standard industry concerns |
| Geopolitical Risk | US-centric exposure | Broad international exposure |
The most impactful risks are ARM’s high market volatility (beta 4.25) and regulatory exposure across multiple countries, which could affect its licensing business. GLOBALFOUNDRIES shows operational risks with negative profitability ratios and moderate market risk. Both firms face typical semiconductor industry environmental risks, but ARM’s geopolitical risk is more pronounced due to its global footprint.
Which Stock to Choose?
GLOBALFOUNDRIES Inc. (GFS) shows a mixed income evolution with long-term revenue and net income growth but a recent 8.7% revenue decline and negative net margin of -3.93%. Its financial ratios are mostly unfavorable, including negative returns on equity and assets, though debt levels are low and liquidity ratios are favorable. The overall rating stands at C+ with moderate scores but a very unfavorable profitability profile.
Arm Holdings plc (ARM) presents a favorable income evolution marked by strong gross and net margins of 94.86% and 19.77%, respectively, along with consistent revenue growth of 23.9% over the past year. Its financial ratios are slightly unfavorable overall due to high valuation multiples and WACC, despite good profitability and very low debt. The rating is B- with moderate to favorable scores and a solid financial health profile.
For investors, ARM’s favorable income statement and stronger rating might appeal to those focused on growth and quality, while GFS’s improving but currently unfavorable financial ratios and moderate rating could be interpreted as riskier, potentially suiting investors with a tolerance for turnaround opportunities. The choice could depend on the investor’s risk appetite and strategy.
Disclaimer: Investment carries a risk of loss of initial capital. The past performance is not a reliable indicator of future results. Be sure to understand risks before making an investment decision.
Go Further
I encourage you to read the complete analyses of GLOBALFOUNDRIES Inc. and Arm Holdings plc American Depositary Shares to enhance your investment decisions: