Home > Comparison > Healthcare > GILD vs PFE
The strategic rivalry between Gilead Sciences, Inc. and Pfizer Inc. shapes the healthcare sector’s evolution. Gilead operates as a specialized biopharmaceutical innovator focusing on unmet medical needs, while Pfizer commands a diversified pharmaceutical and vaccine portfolio with global scale. This analysis pits Gilead’s innovation-driven growth against Pfizer’s broad market reach to identify which trajectory offers superior risk-adjusted returns for a diversified portfolio in 2026.
Table of contents
Companies Overview
Gilead Sciences and Pfizer anchor critical segments of the global pharmaceutical market with distinct competitive strengths.
Gilead Sciences, Inc.: Biopharma Pioneer in Specialty Therapeutics
Gilead Sciences dominates specialty drug development, focusing on HIV/AIDS, liver diseases, and oncology. Its core revenue derives from patented antiviral and cell therapy products like Biktarvy and Yescarta. In 2026, Gilead sharpens its strategy on expanding innovative treatments for unmet medical needs worldwide, leveraging collaborations to accelerate pipeline growth.
Pfizer Inc.: Broad-Spectrum Pharmaceutical Powerhouse
Pfizer operates as a diversified biopharmaceutical leader, generating revenue from vaccines, immunotherapies, and small molecules. Its portfolio spans blockbuster products including Comirnaty and Eliquis. In 2026, Pfizer emphasizes global vaccine distribution and expanding biosimilars while maintaining strong contract manufacturing capabilities to support scale and reach.
Strategic Collision: Similarities & Divergences
Both companies prioritize innovation but diverge in scope and operational scale. Gilead pursues a focused specialty drug model, whereas Pfizer leverages broad therapeutic diversity and manufacturing scale. Their primary battleground lies in infectious diseases and immunotherapies. Investors must weigh Gilead’s niche innovation against Pfizer’s diversified, large-cap presence with global reach.
Income Statement Comparison
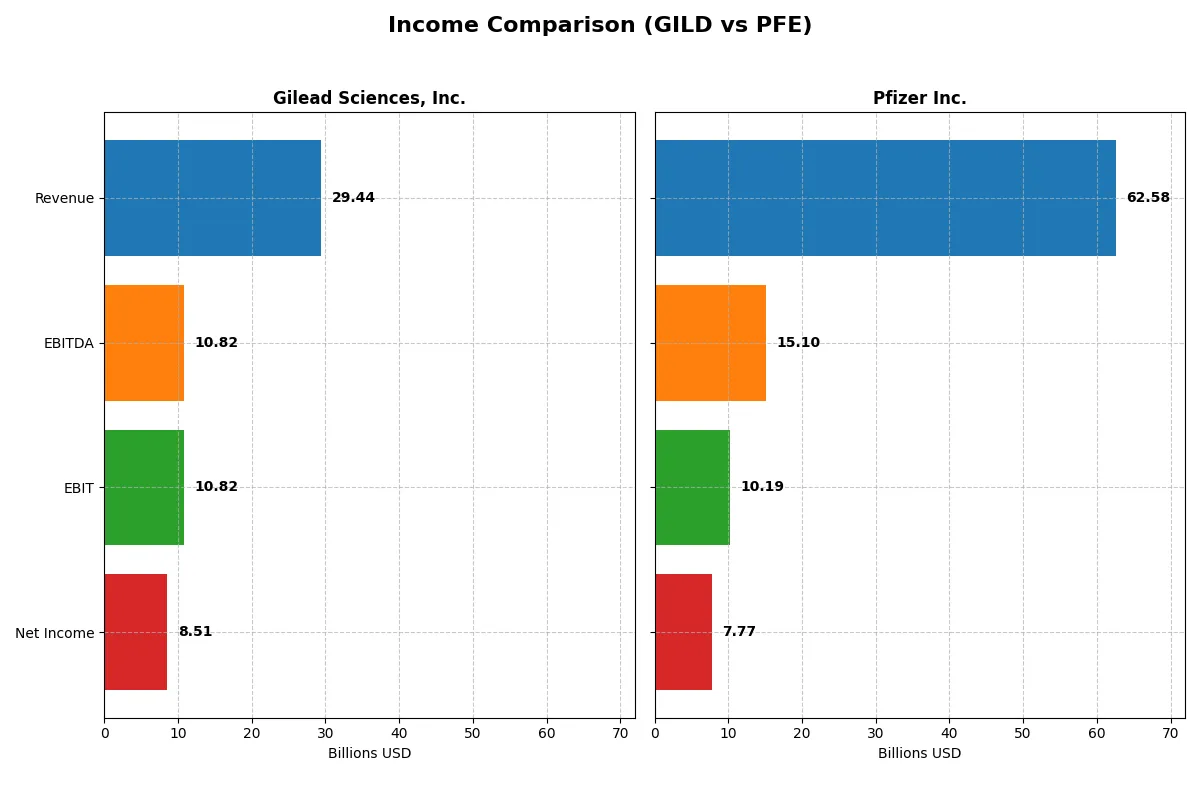
The following data dissects the core profitability and scalability of both corporate engines to reveal who dominates the bottom line:
| Metric | Gilead Sciences, Inc. (GILD) | Pfizer Inc. (PFE) |
|---|---|---|
| Revenue | 29.4B | 62.6B |
| Cost of Revenue | 3.9B | 18.6B |
| Operating Expenses | 13.7B | 28.6B |
| Gross Profit | 25.5B | 44.0B |
| EBITDA | 10.8B | 15.1B |
| EBIT | 10.8B | 10.2B |
| Interest Expense | 1.0B | 2.7B |
| Net Income | 8.5B | 7.8B |
| EPS | 6.84 | 1.36 |
| Fiscal Year | 2025 | 2025 |
Income Statement Analysis: The Bottom-Line Duel
This income statement comparison reveals which company runs its operations with superior efficiency and sustained profitability.
Gilead Sciences, Inc. Analysis
Gilead’s revenue grew modestly by 2.4% in 2025, reaching $29.4B, while net income surged to $8.5B, reflecting strong operational momentum. The company commands a robust gross margin of 86.7% and a net margin near 29%, signaling excellent cost control and profitability. Its EBIT margin expanded sharply, underscoring improved efficiency and capital allocation.
Pfizer Inc. Analysis
Pfizer’s revenue declined 1.65% to $62.6B in 2025, with net income slipping to $7.7B. Despite a solid gross margin of 70.3%, its net margin at 12.4% lags behind Gilead’s. EBIT margin contracted to 16.3%, indicating pressure on operational efficiency. The company faces challenges in reversing recent declines in revenue and earnings.
Margin Power vs. Revenue Scale
Gilead outperforms Pfizer in profitability and margin expansion, boasting superior efficiency despite Pfizer’s larger revenue base. Gilead’s robust net margin and significant net income growth mark it as the fundamental winner. Investors seeking a leaner, profit-focused profile will find Gilead’s income statement far more attractive than Pfizer’s.
Financial Ratios Comparison
These vital ratios act as a diagnostic tool to expose the underlying fiscal health, valuation premiums, and capital efficiency of these companies:
| Ratios | Gilead Sciences, Inc. (GILD) | Pfizer Inc. (PFE) |
|---|---|---|
| ROE | 2.48% (2024) | 8.35% (2025) |
| ROIC | 2.36% (2024) | N/A |
| P/E | 240.0 (2024) | 18.2 (2025) |
| P/B | 5.96 (2024) | 1.52 (2025) |
| Current Ratio | 1.60 (2024) | 1.17 (2024) |
| Quick Ratio | 1.45 (2024) | 0.92 (2024) |
| D/E (Debt-to-Equity) | 1.38 (2024) | 0.76 (2024) |
| Debt-to-Assets | 45.3% (2024) | 31.4% (2024) |
| Interest Coverage | 1.70 (2024) | 5.33 (2024) |
| Asset Turnover | 0.49 (2024) | 0.30 (2024) |
| Fixed Asset Turnover | 5.31 (2024) | 3.46 (2024) |
| Payout Ratio | 816% (2024) | 119% (2024) |
| Dividend Yield | 3.40% (2024) | 6.33% (2024) |
| Fiscal Year | 2024 | 2024 |
Efficiency & Valuation Duel: The Vital Signs
Financial ratios act as a company’s DNA, exposing hidden risks and operational strengths that shape investor decisions.
Gilead Sciences, Inc.
Gilead’s net margin shines at 28.9%, signaling strong profitability despite a zero ROE and ROIC, which raises concerns about capital efficiency. The P/E ratio at 17.94 suggests a fairly valued stock. It returns value via a 2.57% dividend yield, underlining a shareholder-friendly policy amid neutral overall ratio health.
Pfizer Inc.
Pfizer posts a moderate net margin of 12.42%, with an ROE of 8.35% that remains below ideal thresholds. The P/E ratio of 18.21 indicates a neutral valuation. Pfizer offers a solid dividend yield near 6.91%, balancing income with reinvestment in R&D at 19.1% of revenue, despite a slightly unfavorable ratio profile.
Dividend Yield Strength vs. Capital Efficiency Challenge
Gilead delivers higher profitability and a stable dividend but struggles with capital returns. Pfizer trades at a similar valuation, offering a stronger dividend yield but weaker margins. Investors seeking income might prefer Pfizer, while those valuing operational margin could lean toward Gilead.
Which one offers the Superior Shareholder Reward?
I compare Gilead Sciences (GILD) and Pfizer (PFE) on dividend yields, payout ratios, and buybacks for 2025. GILD yields 2.57% with a 46% payout ratio, signaling strong free cash flow coverage. Pfizer’s yield is 6.91%, but the payout ratio exceeds 125%, an unsustainable level. Both companies engage in buybacks, yet GILD’s balanced distribution and 2.55 dividend-to-capex coverage ratio suggest more durable shareholder returns. Pfizer’s aggressive payout risks future cuts. I conclude Gilead offers a superior, sustainable total return profile for 2026.
Comparative Score Analysis: The Strategic Profile
The radar chart reveals the fundamental DNA and trade-offs of Gilead Sciences, Inc. and Pfizer Inc., highlighting their distinct financial strengths and weaknesses:
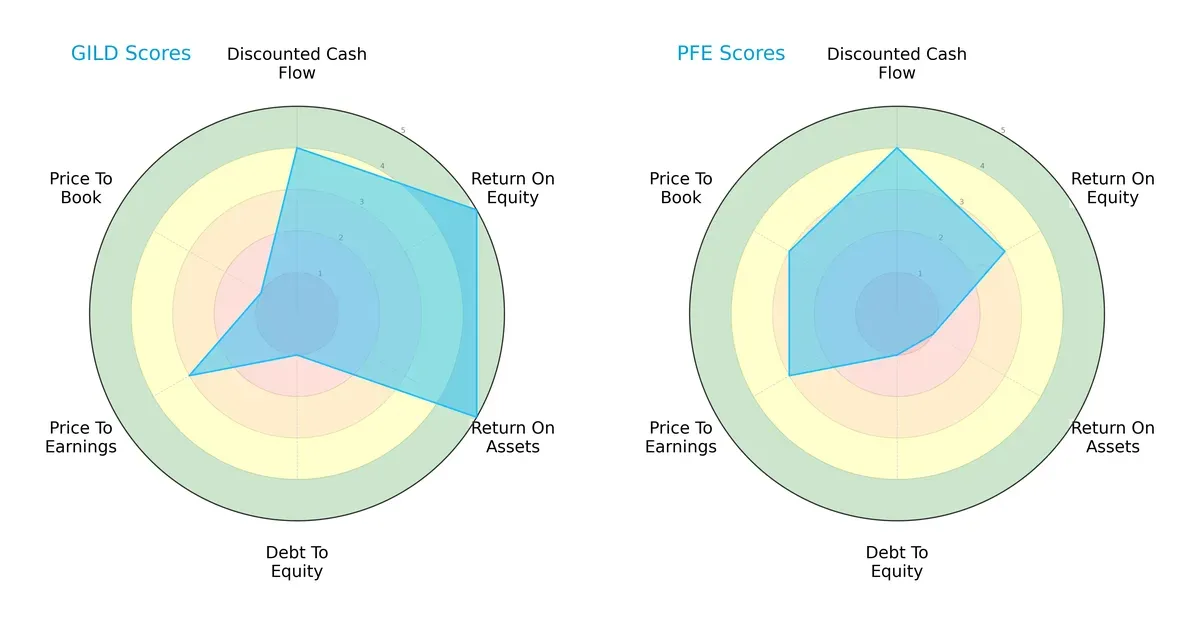
Gilead boasts superior operational efficiency with very favorable ROE and ROA scores (5 each), signaling excellent profit generation and asset utilization. Pfizer matches Gilead on discounted cash flow (4) but lags in asset efficiency (ROA score 1) and ROE (3). Both carry significant leverage risk with equally low debt-to-equity scores (1). Valuation metrics favor Pfizer slightly on price-to-book (3 vs. 1), while Gilead’s valuation scores show moderate price-to-earnings (3) but poor price-to-book (1). Overall, Gilead presents a more balanced operational profile, relying on robust profitability, whereas Pfizer depends more on valuation appeal amid weaker asset returns.
—
Bankruptcy Risk: Solvency Showdown
Gilead’s Altman Z-Score stands at a strong 4.38, placing it well within the safe zone for long-term survival. Pfizer’s Altman Z-Score data is unavailable, limiting direct solvency comparison:

—
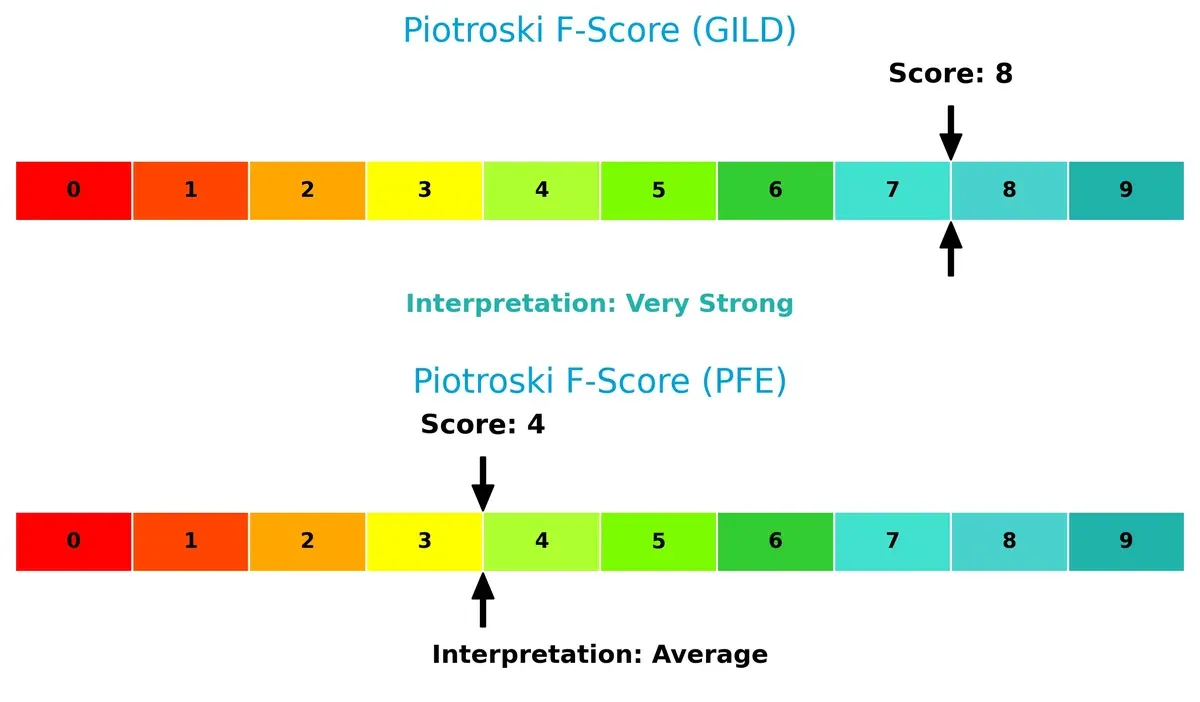
Financial Health: Quality of Operations
Gilead scores an impressive 8 on the Piotroski scale, reflecting very strong financial health and operational quality. Pfizer’s score of 4 indicates average financial strength, revealing potential internal red flags:
How are the two companies positioned?
This section dissects the operational DNA of GILD and PFE by comparing their revenue distribution by segment and their internal strengths and weaknesses. The goal is to confront their economic moats and identify which model offers the most resilient, sustainable competitive advantage today.
Revenue Segmentation: The Strategic Mix
This visual comparison dissects how Gilead Sciences and Pfizer diversify their income streams and where their primary sector bets lie:
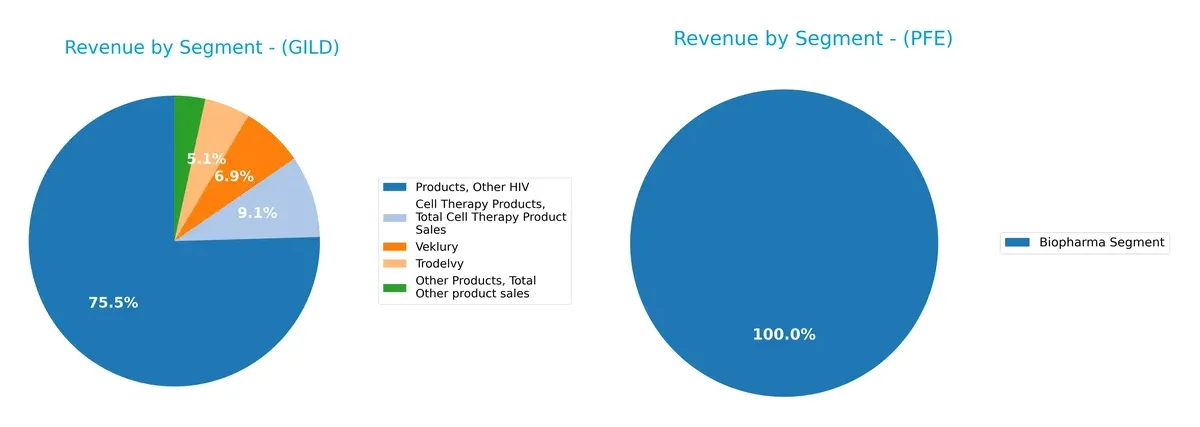
Gilead anchors revenue heavily in its HIV products at $19.6B, with cell therapy and Veklury supplementing its mix. Pfizer pivots on a dominant Biopharma segment at $62.4B, showing less diversification. Gilead’s focused portfolio risks concentration but benefits from ecosystem lock-in, while Pfizer’s scale in Biopharma grants infrastructure dominance but exposes it to segment volatility.
Strengths and Weaknesses Comparison
This table compares the Strengths and Weaknesses of Gilead Sciences, Inc. and Pfizer Inc.:
GILD Strengths
- Strong net margin at 28.9%
- Favorable debt-to-equity and interest coverage ratios
- Diversified HIV and cell therapy product lines
- Solid U.S. and European sales presence
PFE Strengths
- Large biopharma revenues exceeding 62B USD
- Favorable WACC at 5.69% supports capital allocation
- Substantial global footprint including emerging markets
- Consistent U.S. market dominance
GILD Weaknesses
- Zero return on equity and invested capital
- Low liquidity ratios signal potential short-term risks
- Asset turnover metrics unfavorable
- Heavy reliance on HIV segment revenues
PFE Weaknesses
- Unfavorable return on equity and invested capital
- Neutral interest coverage suggests debt service vulnerability
- Moderate dividend yield at 6.91% is neutral
- Asset turnover also unfavorable
Gilead excels in profitability and maintains a focused product portfolio, but faces liquidity and capital efficiency challenges. Pfizer benefits from scale and global diversification, yet struggles with returns and operational efficiency. Both must address specific financial constraints to optimize their strategic positioning.
The Moat Duel: Analyzing Competitive Defensibility
A structural moat is the only reliable shield protecting long-term profits from relentless competition erosion. Let’s dissect the core moats of two pharma giants:
Gilead Sciences, Inc.: Intangible Assets Moat
Gilead’s moat stems from strong intangible assets, especially proprietary drugs for HIV and liver diseases. This moat shows in its high 87% gross margin and stable 29% net margin. New oncology and cell therapy launches in 2026 could deepen this defensibility.
Pfizer Inc.: Scale and Diversification Moat
Pfizer leverages scale and geographic diversification, contrasting Gilead’s niche focus. Its broader portfolio supports a solid 70% gross margin but a weaker 12% net margin. Pfizer’s global vaccine and biosimilar pipeline offer expansion potential amid market shifts.
Niche Focus vs. Scale: Who Holds the Stronger Moat?
Gilead’s concentrated intangible assets create a deeper moat with superior profitability and margin stability. Pfizer’s scale offers breadth but struggles with margin compression. I see Gilead better positioned to defend market share in 2026.
Which stock offers better returns?
The past year shows marked price growth for both stocks, with Gilead Sciences surging sharply while Pfizer’s gains remain modest but steady.
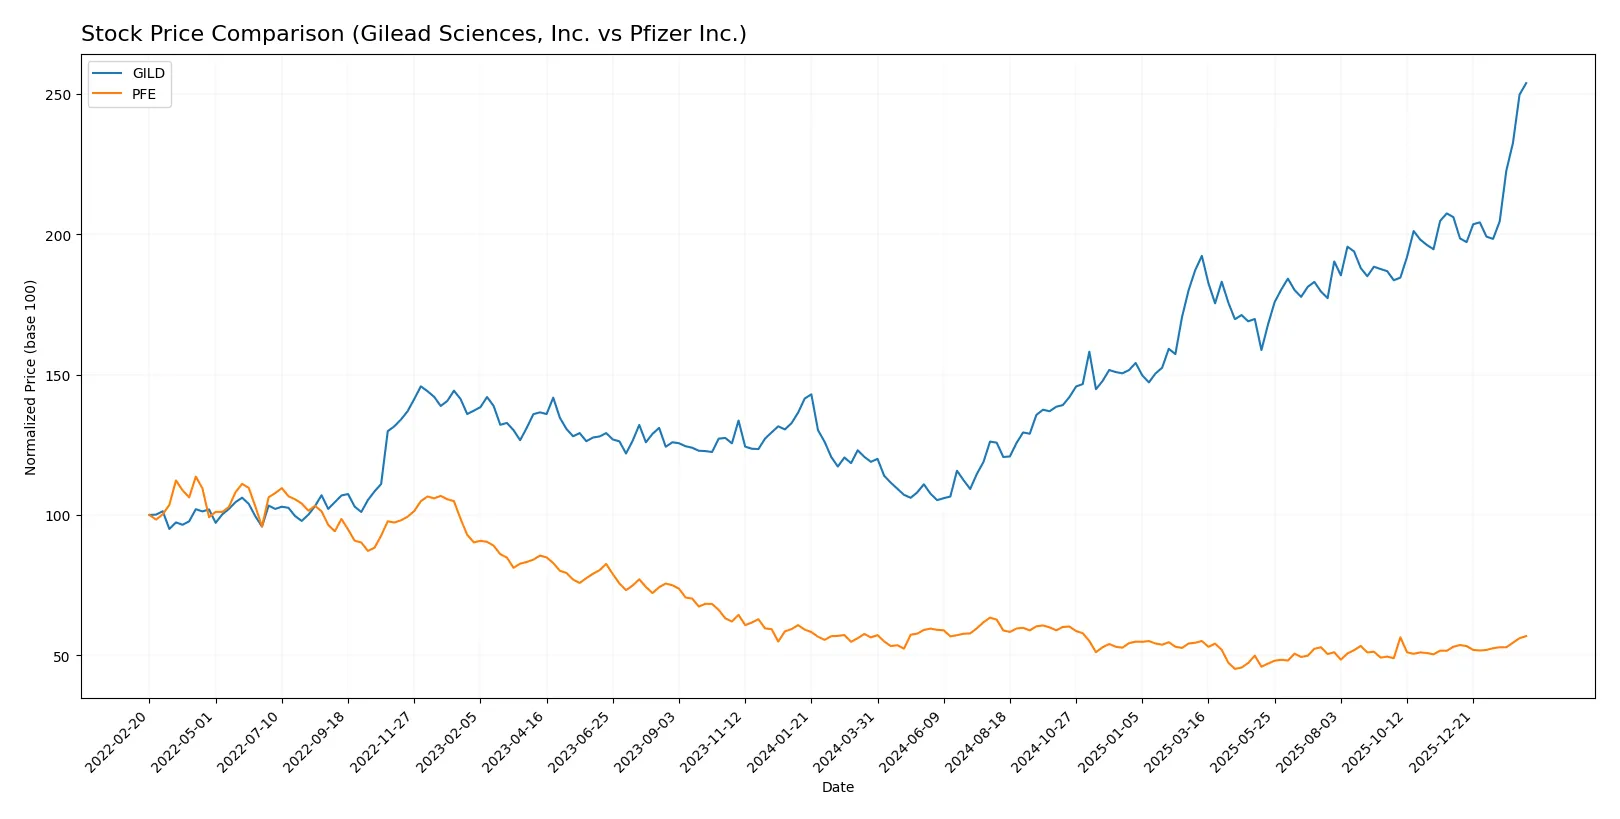
Trend Comparison
Gilead Sciences, Inc. exhibits a strong bullish trend with a 113.44% price increase over 12 months, accelerating upward from a low of 64.27 to a high of 154.98. Volatility is significant, with a standard deviation of 21.42.
Pfizer Inc. also trends bullish but with minimal overall growth of 0.8% in the same period. The price moves steadily between 21.91 and 30.77, showing low volatility at a 1.97 standard deviation and gradual acceleration.
Comparing both, Gilead Sciences clearly outperforms Pfizer in market returns, delivering substantially higher gains and stronger momentum over the last year.
Target Prices
Analysts present a moderate upside for both Gilead Sciences and Pfizer, reflecting cautious optimism in the healthcare sector.
| Company | Target Low | Target High | Consensus |
|---|---|---|---|
| Gilead Sciences, Inc. | 105 | 177 | 154.2 |
| Pfizer Inc. | 24 | 35 | 27.89 |
The target consensus for Gilead is near its current price of $155, signaling limited near-term upside. Pfizer’s consensus price of $27.89 slightly exceeds its $27.58 market price, suggesting modest potential gains.

Don’t Let Luck Decide Your Entry Point
Optimize your entry points with our advanced ProRealTime indicators. You’ll get efficient buy signals with precise price targets for maximum performance. Start outperforming now!
How do institutions grade them?
The following tables summarize recent institutional grades for Gilead Sciences, Inc. and Pfizer Inc.:
Gilead Sciences, Inc. Grades
This table lists the latest grades assigned by notable financial institutions for Gilead Sciences, Inc.
| Grading Company | Action | New Grade | Date |
|---|---|---|---|
| RBC Capital | Maintain | Sector Perform | 2026-02-11 |
| Needham | Maintain | Buy | 2026-02-11 |
| Wells Fargo | Maintain | Overweight | 2026-02-11 |
| Truist Securities | Maintain | Buy | 2026-02-11 |
| Cantor Fitzgerald | Maintain | Overweight | 2026-02-11 |
| Scotiabank | Maintain | Sector Outperform | 2026-02-11 |
| Truist Securities | Maintain | Buy | 2026-01-27 |
| Citigroup | Maintain | Buy | 2026-01-27 |
| UBS | Maintain | Buy | 2026-01-26 |
| Morgan Stanley | Maintain | Overweight | 2026-01-13 |
Pfizer Inc. Grades
This table shows recent grades from respected analysts for Pfizer Inc.
| Grading Company | Action | New Grade | Date |
|---|---|---|---|
| Cantor Fitzgerald | Maintain | Neutral | 2026-02-04 |
| Cantor Fitzgerald | Maintain | Neutral | 2026-01-27 |
| Morgan Stanley | Maintain | Equal Weight | 2025-12-17 |
| B of A Securities | Maintain | Neutral | 2025-12-15 |
| Morgan Stanley | Maintain | Equal Weight | 2025-12-12 |
| Guggenheim | Maintain | Buy | 2025-11-24 |
| Morgan Stanley | Maintain | Equal Weight | 2025-10-10 |
| B of A Securities | Maintain | Neutral | 2025-10-03 |
| B of A Securities | Maintain | Neutral | 2025-08-06 |
| Citigroup | Maintain | Neutral | 2025-08-06 |
Which company has the best grades?
Gilead Sciences consistently earns Buy and Overweight ratings, signaling stronger analyst conviction. Pfizer’s grades skew Neutral and Equal Weight, indicating more cautious outlooks. Investors may interpret Gilead’s higher grades as a sign of greater confidence in its near-term prospects.
Risks specific to each company
The following categories identify the critical pressure points and systemic threats facing both Gilead Sciences, Inc. and Pfizer Inc. in the 2026 market environment:
1. Market & Competition
Gilead Sciences, Inc.
- Faces intense pressure in HIV and oncology markets; innovation pace critical for maintaining share.
Pfizer Inc.
- Broad portfolio diversifies risk, but strong competition in vaccines and biopharma compresses margins.
2. Capital Structure & Debt
Gilead Sciences, Inc.
- Favorable debt metrics and strong interest coverage, but lack of liquidity ratios is a red flag.
Pfizer Inc.
- Moderate interest coverage and favorable debt-to-assets, yet liquidity concerns persist, increasing refinancing risk.
3. Stock Volatility
Gilead Sciences, Inc.
- Low beta (0.39) suggests defensive stock with lower market sensitivity.
Pfizer Inc.
- Slightly higher beta (0.44) indicates moderate volatility, reflecting broader exposure to market cycles.
4. Regulatory & Legal
Gilead Sciences, Inc.
- Exposure to complex drug approval processes and patent cliffs in specialty drugs.
Pfizer Inc.
- Faces regulatory scrutiny on vaccine approvals and biosimilars challenges globally.
5. Supply Chain & Operations
Gilead Sciences, Inc.
- Reliant on specialized suppliers for biologics; operational disruptions could impair product delivery.
Pfizer Inc.
- Large-scale manufacturing complexity increases vulnerability to supply chain bottlenecks.
6. ESG & Climate Transition
Gilead Sciences, Inc.
- Growing ESG focus; needs to improve sustainability to meet investor expectations.
Pfizer Inc.
- Advanced ESG programs but still exposed to climate-related operational risks globally.
7. Geopolitical Exposure
Gilead Sciences, Inc.
- Moderate international exposure, especially in Europe and emerging markets.
Pfizer Inc.
- Extensive global footprint subjects Pfizer to geopolitical tensions and trade policy shifts.
Which company shows a better risk-adjusted profile?
Gilead’s strongest risk lies in its capital structure, notably weak liquidity ratios despite solid debt management. Pfizer faces its greatest risk from geopolitical exposure and regulatory pressures due to its global scale. Gilead’s lower beta and strong Altman Z-score (4.38, safe zone) indicate better financial stability. Pfizer’s average Piotroski score (4) and slightly unfavorable financial ratios suggest a comparatively higher risk. Gilead’s recent defensive stock behavior and stronger financial scores justify a more attractive risk-adjusted profile in 2026.
Final Verdict: Which stock to choose?
Gilead Sciences, Inc. (GILD) stands out as a cash-generating powerhouse with exceptional income quality and operational efficiency. Its robust profitability signals strong pricing power and innovation. A point of vigilance remains its modest capital reinvestment returns, suggesting caution for long-term value creation. GILD suits an Aggressive Growth portfolio seeking high income quality.
Pfizer Inc. (PFE) offers a strategic moat rooted in its diversified pharmaceutical franchise and steady recurring revenues. While its profitability metrics trail Gilead’s, Pfizer provides comparatively better balance sheet stability and a solid dividend yield. This profile aligns with GARP (Growth at a Reasonable Price) investors valuing income with moderate growth.
If you prioritize high operational efficiency and income quality, Gilead Sciences is the compelling choice due to its superior profitability and cash flow dynamics. However, if you seek better capital preservation with consistent dividends, Pfizer offers better stability and a defensive edge. Both scenarios require careful monitoring of their capital allocation effectiveness and growth trajectories.
Disclaimer: Investment carries a risk of loss of initial capital. The past performance is not a reliable indicator of future results. Be sure to understand risks before making an investment decision.
Go Further
I encourage you to read the complete analyses of Gilead Sciences, Inc. and Pfizer Inc. to enhance your investment decisions: