Merck & Co., Inc. (MRK) and Gilead Sciences, Inc. (GILD) are two prominent players in the pharmaceutical industry, both driving innovation in drug development and healthcare solutions. While Merck operates across a broad spectrum including oncology and vaccines, Gilead focuses heavily on antiviral therapies and cell treatments. This comparison will highlight their market positions, innovation strategies, and growth prospects to help you decide which company could be the best addition to your investment portfolio.
Table of contents
Companies Overview
I will begin the comparison between Merck & Co., Inc. and Gilead Sciences, Inc. by providing an overview of these two companies and their main differences.
Merck & Co., Inc. Overview
Merck & Co., Inc. operates globally in healthcare through two main segments: Pharmaceutical and Animal Health. Its pharmaceutical products address oncology, immunology, vaccines, and other human health areas, while its animal health segment focuses on veterinary pharmaceuticals and digital health solutions. Founded in 1891 and headquartered in New Jersey, Merck serves a broad range of clients including hospitals, government agencies, and veterinarians.
Gilead Sciences, Inc. Overview
Gilead Sciences, Inc. is a biopharmaceutical company engaged in discovering, developing, and commercializing medicines for unmet medical needs worldwide. It specializes in treatments for HIV/AIDS, liver diseases, oncology, and pulmonary conditions. Incorporated in 1987 and based in California, Gilead has collaboration agreements with multiple biotech and pharmaceutical firms to enhance its product portfolio and innovation capabilities.
Key similarities and differences
Both companies operate in the drug manufacturing industry, focusing on developing pharmaceutical products for serious health conditions. Merck has a more diversified portfolio including animal health, while Gilead concentrates heavily on antiviral and oncology therapies. Merck’s workforce is significantly larger, reflecting its broader scope, whereas Gilead emphasizes biopharmaceutical innovation and strategic collaborations. Their market capitalizations also differ, with Merck being the larger entity by valuation.
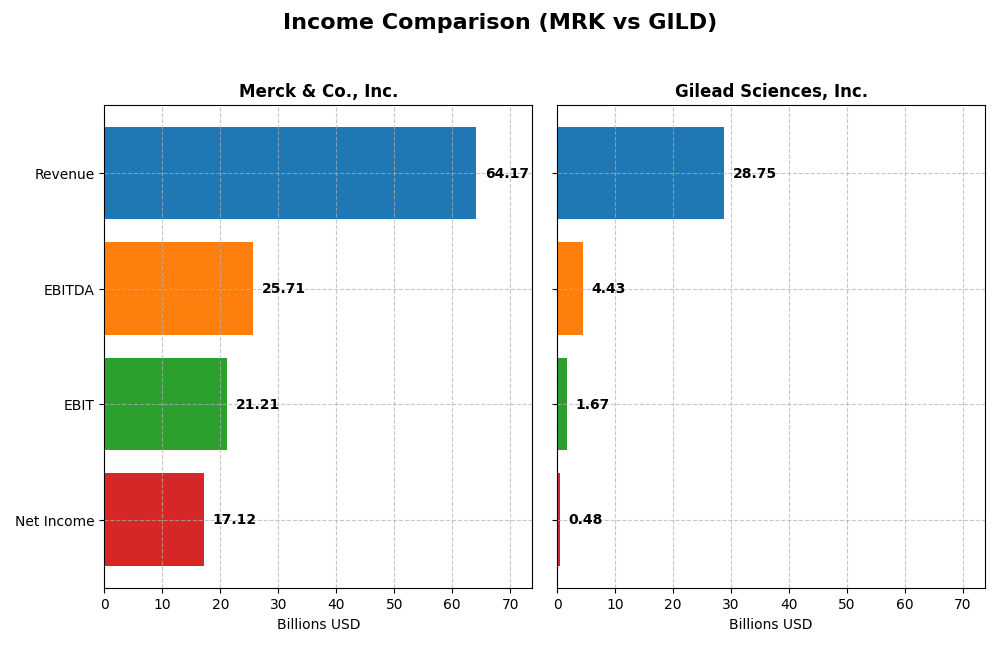
Income Statement Comparison
The following table compares key income statement metrics for the fiscal year 2024 for Merck & Co., Inc. and Gilead Sciences, Inc., providing a snapshot of their financial performance.
| Metric | Merck & Co., Inc. | Gilead Sciences, Inc. |
|---|---|---|
| Market Cap | 278B | 150B |
| Revenue | 64.2B | 28.8B |
| EBITDA | 25.7B | 4.4B |
| EBIT | 21.2B | 1.7B |
| Net Income | 17.1B | 480M |
| EPS | 6.76 | 0.38 |
| Fiscal Year | 2024 | 2024 |
Income Statement Interpretations
Merck & Co., Inc.
Merck displayed a solid upward trend in revenue, growing 54.55% from 2020 to 2024, with net income up 142.21% over the same period. Margins remained robust, with a gross margin of 76.32% and an improving net margin reaching 26.68% in 2024. The latest year showed steady revenue growth of 6.74%, significant EBIT expansion, and remarkable net margin improvement, underscoring enhanced profitability.
Gilead Sciences, Inc.
Gilead’s revenue increased 16.46% from 2020 to 2024, accompanied by a substantial 290.24% rise in net income. However, margins were mixed; gross margin was favorable at 78.26%, but EBIT margin was only 5.8%, and net margin was low at 1.67%. The 2024 performance saw moderate revenue growth of 6.04%, but EBIT and net margin declined sharply, reflecting margin compression and operational challenges.
Which one has the stronger fundamentals?
Merck’s income statement reveals stronger fundamentals with consistently favorable margins, significant EBIT and net income growth, and effective cost management. Gilead, while showing impressive net income growth over the longer term, struggles with margin volatility and recent declines in EBIT and net profitability. Merck’s stable and improving profitability metrics suggest a more resilient income profile based on the latest data.
Financial Ratios Comparison
The table below compares key financial ratios for Merck & Co., Inc. and Gilead Sciences, Inc. based on their most recent fiscal year data, providing a snapshot of their profitability, liquidity, leverage, and efficiency.
| Ratios | Merck & Co., Inc. (2024) | Gilead Sciences, Inc. (2024) |
|---|---|---|
| ROE | 36.96% | 2.48% |
| ROIC | 18.97% | 2.36% |
| P/E | 14.72 | 240.0 |
| P/B | 5.44 | 5.96 |
| Current Ratio | 1.36 | 1.60 |
| Quick Ratio | 1.15 | 1.45 |
| D/E (Debt-to-Equity) | 0.83 | 1.38 |
| Debt-to-Assets | 32.7% | 45.3% |
| Interest Coverage | 15.91 | 1.70 |
| Asset Turnover | 0.55 | 0.49 |
| Fixed Asset Turnover | 2.70 | 5.31 |
| Payout ratio | 45.80% | 8.16% |
| Dividend yield | 3.11% | 3.40% |
Interpretation of the Ratios
Merck & Co., Inc.
Merck shows strong profitability ratios, with a net margin of 26.68% and a return on equity of 36.96%, both favorable. Its valuation metrics like PE ratio at 14.72 are attractive, though the price-to-book ratio at 5.44 is less favorable. The current and quick ratios indicate adequate liquidity. Merck pays a dividend with a 3.11% yield, supported by solid free cash flow, signaling sustainable shareholder returns.
Gilead Sciences, Inc.
Gilead displays weaker profitability, with a net margin of 1.67% and ROE of only 2.48%, both unfavorable. Its PE ratio is very high at 239.97, suggesting overvaluation concerns. Liquidity ratios are strong, but debt levels and interest coverage are less favorable. Gilead also pays dividends, yielding 3.4%, yet its poor earnings and coverage ratios raise questions about long-term payout sustainability.
Which one has the best ratios?
Merck exhibits a more favorable overall ratio profile, with stronger profitability, valuation, and coverage metrics compared to Gilead. Gilead’s high debt, low returns, and stretched PE ratio contrast with Merck’s balanced financial health. Merck’s dividend appears better supported by cash flow, while Gilead faces greater risks in sustaining shareholder returns.
Strategic Positioning
This section compares the strategic positioning of Merck & Co., Inc. and Gilead Sciences, Inc. across Market position, Key segments, and Exposure to technological disruption:
Merck & Co., Inc.
- Large market cap of 278B with low beta, facing broad competition in drug manufacturing.
- Diversified segments: Pharmaceuticals (57B) and Animal Health (5.9B) drive revenue growth.
- Collaborates on HIV treatments; exposure to disruption through immunology and oncology innovations.
Gilead Sciences, Inc.
- Mid-size market cap of 150B with moderate beta, operating in specialized biopharma market.
- Concentrated on antiviral drugs, cell therapy, and oncology with core HIV and liver disease products.
- Focus on innovative therapies like cell therapy and COVID-19 treatment, with multiple biotech collaborations.
Merck & Co., Inc. vs Gilead Sciences, Inc. Positioning
Merck’s diversified pharmaceutical and animal health segments contrast with Gilead’s focused antiviral and cell therapy offerings. Merck’s scale and broad portfolio provide stability, while Gilead’s specialization targets high-growth niches but with concentrated risk.
Which has the best competitive advantage?
Merck holds a very favorable moat with ROIC significantly above WACC and growing profitability, indicating durable competitive advantage. Gilead shows a slightly unfavorable moat, shedding value despite improving ROIC trends.
Stock Comparison
The stock price movements of Merck & Co., Inc. (MRK) and Gilead Sciences, Inc. (GILD) over the past 12 months reveal contrasting trends, with MRK facing a bearish trajectory and GILD showing a bullish pattern, amid shifts in trading volumes and price acceleration.
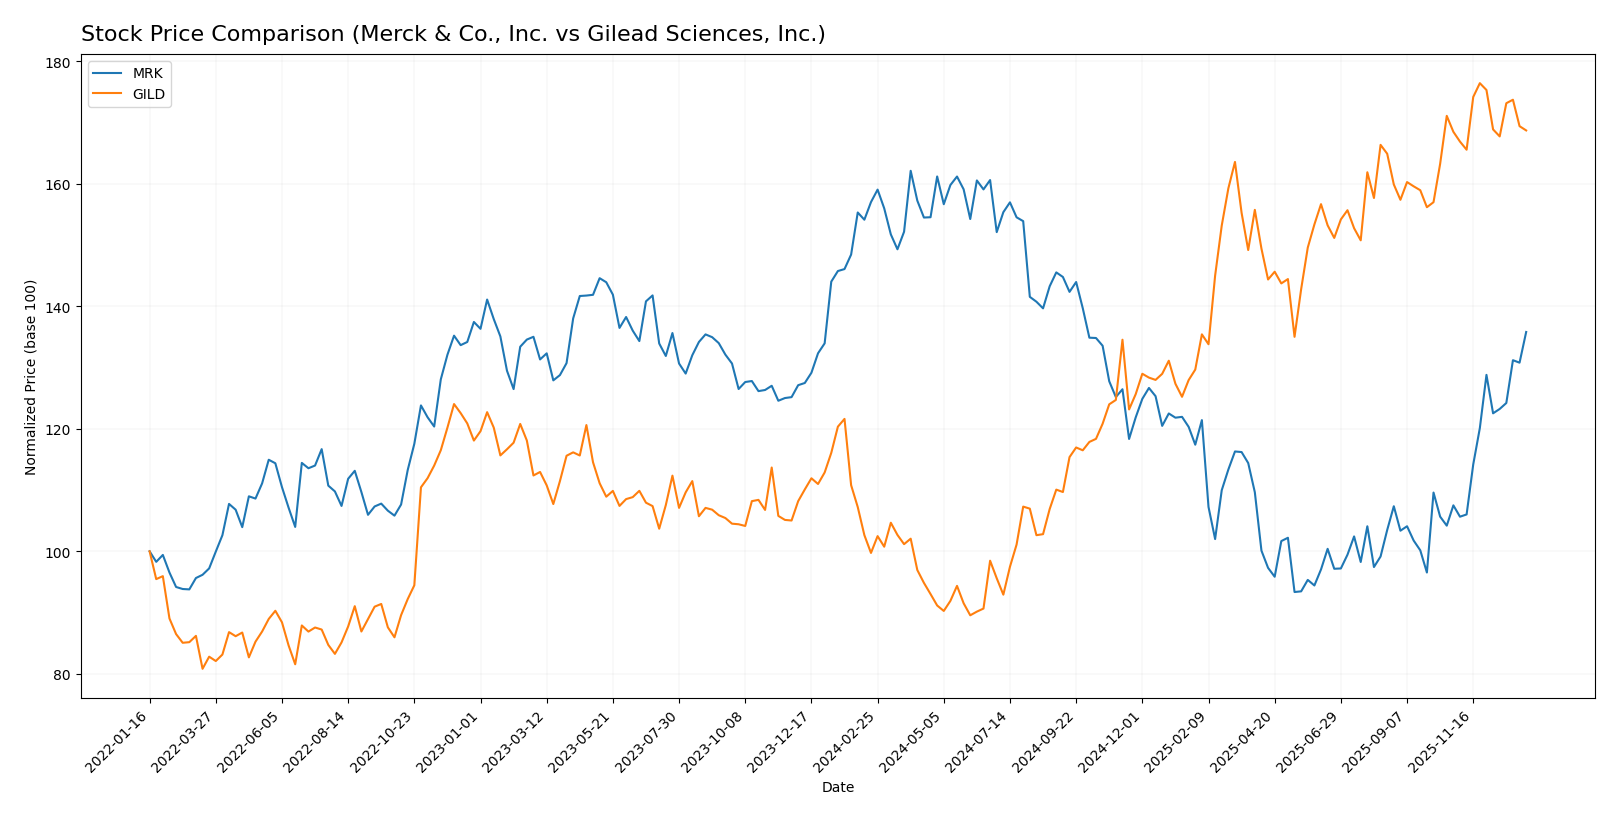
Trend Analysis
Merck & Co., Inc. (MRK) experienced a 13.51% price decline over the past year, indicating a bearish trend with accelerating downward momentum and a high volatility level of 18.04. The recent period shows a strong rebound with a 26.33% gain, supported by buyer dominance.
Gilead Sciences, Inc. (GILD) posted a 69.18% price increase over the last 12 months, reflecting a bullish trend but with decelerating momentum and slightly higher volatility at 19.55. Its recent trend is effectively neutral, with minimal price change and seller dominance.
Comparing the two, GILD delivered the highest market performance over the past year with a substantial price gain, while MRK’s overall decline contrasts with its recent recovery phase.
Target Prices
Analysts present a solid consensus on target prices for Merck & Co., Inc. and Gilead Sciences, Inc.
| Company | Target High | Target Low | Consensus |
|---|---|---|---|
| Merck & Co., Inc. | 135 | 90 | 118.78 |
| Gilead Sciences, Inc. | 151 | 105 | 133.64 |
The consensus target prices suggest moderate upside potential for both stocks compared to current prices of $110.53 for Merck and $121.10 for Gilead, reflecting generally positive analyst expectations.
Analyst Opinions Comparison
This section compares analysts’ ratings and grades for Merck & Co., Inc. and Gilead Sciences, Inc.:
Rating Comparison
MRK Rating
- Rating: A- with a very favorable status indicating strong financial standing.
- Discounted Cash Flow Score: 5, considered very favorable, suggesting undervaluation potential.
- ROE Score: 5, very favorable, showing efficient profit generation from shareholders’ equity.
- ROA Score: 5, very favorable, indicating effective asset utilization to generate earnings.
- Debt To Equity Score: 1, very unfavorable, reflecting high financial risk from debt levels.
- Overall Score: 4, favorable, summarizing a solid financial position.
GILD Rating
- Rating: A- with a very favorable status indicating strong financial standing.
- Discounted Cash Flow Score: 5, considered very favorable, suggesting undervaluation potential.
- ROE Score: 5, very favorable, showing efficient profit generation from shareholders’ equity.
- ROA Score: 5, very favorable, indicating effective asset utilization to generate earnings.
- Debt To Equity Score: 1, very unfavorable, reflecting high financial risk from debt levels.
- Overall Score: 4, favorable, summarizing a solid financial position.
Which one is the best rated?
Both Merck and Gilead share identical ratings and scores across all categories, including strong DCF, ROE, and ROA scores but a very unfavorable debt to equity score. Neither company is rated better based on the data provided.
Scores Comparison
The scores comparison between Merck & Co., Inc. (MRK) and Gilead Sciences, Inc. (GILD) is as follows:
MRK Scores
- Altman Z-Score: 4.52, indicating a safe zone for financial stability.
- Piotroski Score: 6, reflecting average financial strength.
GILD Scores
- Altman Z-Score: 4.01, also in the safe zone for financial stability.
- Piotroski Score: 8, reflecting very strong financial health.
Which company has the best scores?
Gilead Sciences shows very strong financial health with a Piotroski Score higher than Merck’s average score. Both companies are in the safe zone according to their Altman Z-Scores, indicating low bankruptcy risk.
Grades Comparison
Here is a comparison of recent grades and ratings assigned to Merck & Co., Inc. and Gilead Sciences, Inc.:
Merck & Co., Inc. Grades
The following table summarizes Merck’s recent grades from recognized grading companies:
| Grading Company | Action | New Grade | Date |
|---|---|---|---|
| Wolfe Research | Upgrade | Outperform | 2026-01-08 |
| Citigroup | Maintain | Neutral | 2026-01-07 |
| UBS | Maintain | Buy | 2026-01-07 |
| BMO Capital | Upgrade | Outperform | 2025-12-18 |
| B of A Securities | Maintain | Buy | 2025-12-15 |
| Morgan Stanley | Maintain | Equal Weight | 2025-12-12 |
| Scotiabank | Maintain | Sector Outperform | 2025-12-04 |
| Goldman Sachs | Maintain | Buy | 2025-12-02 |
| Wells Fargo | Upgrade | Overweight | 2025-11-24 |
| Deutsche Bank | Maintain | Hold | 2025-11-18 |
Merck’s grades generally trend toward outperform and buy recommendations, with multiple recent upgrades, indicating positive analyst sentiment.
Gilead Sciences, Inc. Grades
Here is a summary of Gilead’s recent grades from reputable sources:
| Grading Company | Action | New Grade | Date |
|---|---|---|---|
| Citigroup | Maintain | Buy | 2026-01-07 |
| Morgan Stanley | Maintain | Overweight | 2025-12-12 |
| Wells Fargo | Maintain | Overweight | 2025-12-10 |
| Needham | Maintain | Buy | 2025-11-13 |
| Truist Securities | Maintain | Buy | 2025-11-03 |
| Cantor Fitzgerald | Maintain | Overweight | 2025-10-31 |
| Needham | Maintain | Buy | 2025-10-31 |
| RBC Capital | Maintain | Sector Perform | 2025-10-31 |
| JP Morgan | Maintain | Overweight | 2025-10-31 |
| Wells Fargo | Maintain | Overweight | 2025-10-31 |
Gilead’s grades consistently show buy and overweight ratings, with no recent upgrades or downgrades, reflecting stable positive analyst views.
Which company has the best grades?
Both Merck and Gilead have an overall consensus rating of “Buy.” Merck displays several recent upgrades to outperform and overweight ratings, suggesting improving analyst confidence. Gilead maintains steady buy and overweight ratings without recent changes. Investors might interpret Merck’s upgrades as signals of potential outperformance, while Gilead’s stable grades imply consistent expectations.
Strengths and Weaknesses
The table below summarizes the main strengths and weaknesses of Merck & Co., Inc. (MRK) and Gilead Sciences, Inc. (GILD) based on their recent financial and operational data.
| Criterion | Merck & Co., Inc. (MRK) | Gilead Sciences, Inc. (GILD) |
|---|---|---|
| Diversification | Strong diversification with major revenues from Pharmaceutical (57.4B in 2024) and Animal Health (5.9B) segments | Moderate diversification; heavy reliance on HIV products (~19.6B) with growing cell therapy and oncology products |
| Profitability | High profitability with net margin 26.7%, ROIC 19.0%, and favorable overall financial ratios | Low profitability with net margin 1.7%, ROIC 2.4%, and mostly unfavorable financial ratios |
| Innovation | Demonstrates durable competitive advantage with growing ROIC (+215%) indicating successful innovation and capital use | Profitability is increasing (ROIC growth +551%) but still destroying value overall; innovation in cell therapy and oncology shows promise |
| Global presence | Strong global presence with large pharmaceutical sales and stable animal health market | Global presence focused on antiviral markets; expanding in cell therapy and other specialty areas |
| Market Share | Large market share in pharmaceuticals and animal health segments with stable growth | Leading position in HIV treatment but faces significant competition and challenges in sustaining returns |
Key takeaways: Merck shows a strong, diversified business with excellent profitability and a durable competitive advantage, making it a favorable investment choice. Gilead, while innovating and growing profitability, currently struggles with value creation and faces higher risks, suggesting cautious consideration.
Risk Analysis
Below is a comparative risk table for Merck & Co., Inc. (MRK) and Gilead Sciences, Inc. (GILD) based on the most recent 2024 data:
| Metric | Merck & Co., Inc. (MRK) | Gilead Sciences, Inc. (GILD) |
|---|---|---|
| Market Risk | Low beta (0.298), stable price range | Low beta (0.349), moderate volatility |
| Debt level | Moderate leverage (D/E 0.83), neutral risk | Higher leverage (D/E 1.38), elevated risk |
| Regulatory Risk | Moderate, typical for pharma sector | Moderate, with ongoing drug approvals and trials |
| Operational Risk | Diversified pharma and animal health segments | Focused biopharma with pipeline dependency |
| Environmental Risk | Standard industry impact, no major concerns | Standard industry impact, no major concerns |
| Geopolitical Risk | Low, US-based with global reach | Moderate, global markets exposure |
Merck’s moderate debt and low market volatility reduce its financial risk, while Gilead’s higher leverage and lower interest coverage increase its vulnerability. Both face typical regulatory and operational risks inherent to pharma, but Gilead’s reliance on fewer key products elevates operational risk. Investors should weigh Merck’s stable financials against Gilead’s growth potential but higher financial risk.
Which Stock to Choose?
Merck & Co., Inc. (MRK) shows a favorable income evolution with strong profitability, including a 26.68% net margin and a 36.96% ROE. Its debt levels are moderate with a net debt to EBITDA of 0.97, supporting a very favorable rating and a durable competitive advantage.
Gilead Sciences, Inc. (GILD) exhibits a mixed income evolution with a low 1.67% net margin and weak profitability metrics such as a 2.48% ROE. The company carries higher debt with a net debt to EBITDA of 3.77, resulting in an unfavorable global ratio evaluation despite a very favorable overall rating.
Investors seeking stability and strong profitability might find Merck’s metrics and durable moat more appealing, while those tolerant to risk and focusing on potential recovery could consider Gilead’s improving ROIC trend despite current value destruction.
Disclaimer: Investment carries a risk of loss of initial capital. The past performance is not a reliable indicator of future results. Be sure to understand risks before making an investment decision.
Go Further
I encourage you to read the complete analyses of Merck & Co., Inc. and Gilead Sciences, Inc. to enhance your investment decisions: