Home > Comparison > Healthcare > JNJ vs GILD
The strategic rivalry between Johnson & Johnson and Gilead Sciences defines the current trajectory of the healthcare sector. Johnson & Johnson operates as a diversified healthcare giant with robust pharmaceutical and medical device segments. In contrast, Gilead specializes in biopharmaceutical innovation targeting unmet medical needs. This analysis explores their divergent models to determine which offers a superior risk-adjusted return for diversified portfolios.
Table of contents
Companies Overview
Johnson & Johnson and Gilead Sciences shape critical segments of the global healthcare market with distinct strategic priorities.
Johnson & Johnson: Healthcare Innovator Focused on Advanced Medicine
Johnson & Johnson dominates the healthcare sector with a $587B market cap, focusing on innovative medicine and medical devices. It generates revenue through prescription drugs for complex diseases and advanced medical technology products. Post-2023, it strategically exited consumer health to emphasize higher-growth, innovation-driven pharmaceuticals and MedTech solutions serving hospitals and professionals.
Gilead Sciences, Inc.: Biopharma Specialist in Unmet Medical Needs
Gilead Sciences commands a $192B market cap as a biopharmaceutical leader specializing in treatments for HIV/AIDS, liver diseases, and oncology. Its core revenue stems from proprietary antiviral and cell therapy drugs. In recent years, it has concentrated on expanding its portfolio through collaborations and targeting unmet medical needs worldwide, leveraging innovation in specialized therapies.
Strategic Collision: Innovation-Driven Pharma vs. Focused Biopharma
Johnson & Johnson pursues a diversified model balancing pharmaceuticals and MedTech, unlike Gilead’s biotech-centered, drug-only focus. Both compete fiercely in specialty pharmaceuticals but differ in scale and scope. Johnson & Johnson’s broad platform contrasts with Gilead’s niche precision. Investors face distinct profiles: a sprawling healthcare conglomerate versus a focused biopharma innovator.
Income Statement Comparison
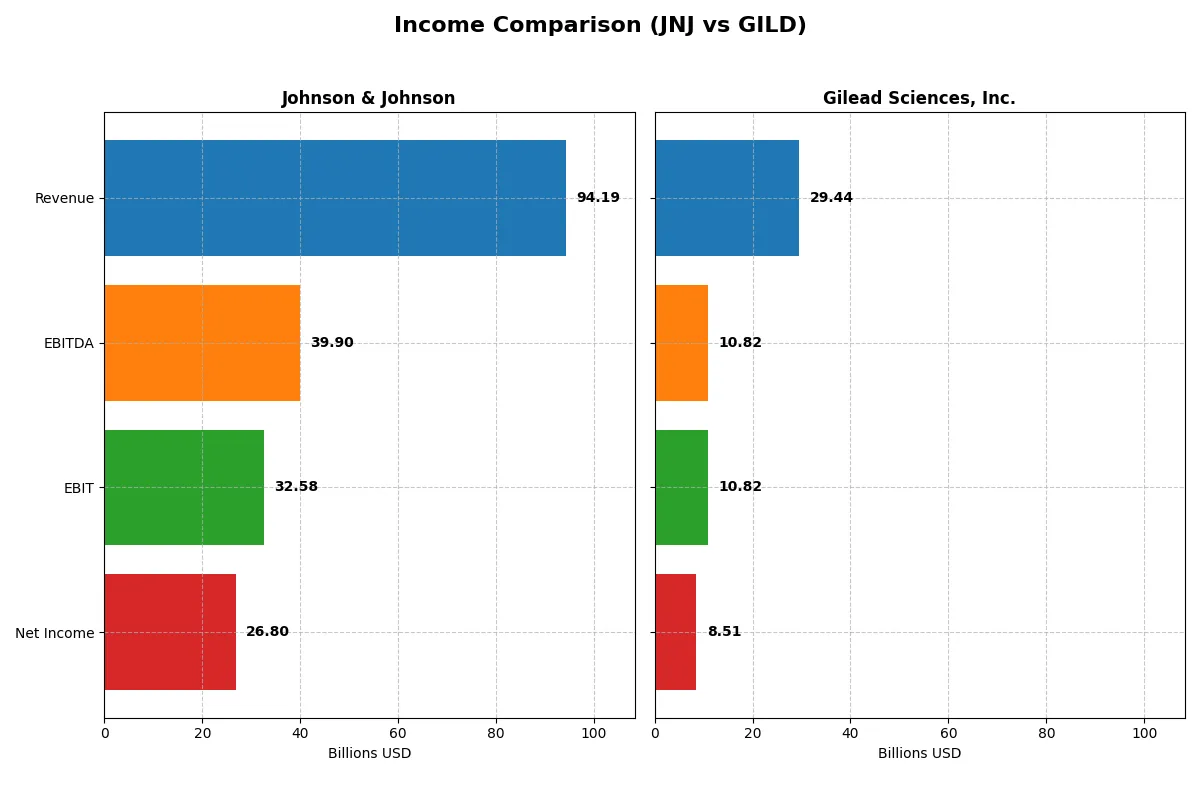
This table dissects the core profitability and scalability of Johnson & Johnson and Gilead Sciences to reveal who dominates the bottom line:
| Metric | Johnson & Johnson (JNJ) | Gilead Sciences, Inc. (GILD) |
|---|---|---|
| Revenue | 94.2B | 29.4B |
| Cost of Revenue | 25.6B | 3.9B |
| Operating Expenses | 42.9B | 13.7B |
| Gross Profit | 68.6B | 25.5B |
| EBITDA | 39.9B | 10.8B |
| EBIT | 32.6B | 10.8B |
| Interest Expense | 971M | 1.0B |
| Net Income | 26.8B | 8.5B |
| EPS | 11.03 | 6.84 |
| Fiscal Year | 2025 | 2025 |
Income Statement Analysis: The Bottom-Line Duel
This income statement comparison reveals the true efficiency and profitability dynamics behind Johnson & Johnson and Gilead Sciences’ financial engines.
Johnson & Johnson Analysis
Johnson & Johnson’s revenue grew steadily from $79.9B in 2022 to $94.2B in 2025, with net income rising from $17.9B to $26.8B. Its gross margin remains strong at 72.8%, while net margin expanded to 28.5%, signaling resilient profitability. In 2025, JNJ’s sharp EBIT growth (+86.8%) and EPS nearly doubled, underscoring impressive momentum and operational efficiency despite rising expenses.
Gilead Sciences Analysis
Gilead’s revenue showed modest growth, reaching $29.4B in 2025 from $27.3B in 2021, with net income jumping from $6.2B to $8.5B. Its gross margin outperforms JNJ at 86.7%, and net margin slightly edges higher at 28.9%. The latest year marks a dramatic EBIT increase (+549%) and a surge in EPS (+1684%), reflecting exceptional cost control and profitability gains despite slower revenue growth.
Margin Power vs. Earnings Momentum
Both companies exhibit strong profitability, but Gilead’s superior gross margin and explosive EBIT and EPS growth outpace JNJ’s steady revenue and margin improvements. Gilead’s profile suits investors prioritizing rapid earnings acceleration, while JNJ offers stable top-line growth with solid margin expansion. The fundamental winner on efficiency and growth momentum is Gilead, highlighting a high-leverage earnings story.
Financial Ratios Comparison
These vital ratios act as a diagnostic tool to expose the underlying fiscal health, valuation premiums, and capital efficiency of the companies compared below:
| Ratios | Johnson & Johnson (JNJ) | Gilead Sciences, Inc. (GILD) |
|---|---|---|
| ROE | 32.87% | 0% |
| ROIC | 13.71% | 0% |
| P/E | 18.81 | 17.94 |
| P/B | 6.18 | 0 |
| Current Ratio | 1.03 | 0 |
| Quick Ratio | 0.77 | 0 |
| D/E | 0.59 | 0 |
| Debt-to-Assets | 24.06% | 0% |
| Interest Coverage | 26.36 | 11.54 |
| Asset Turnover | 0.47 | 0 |
| Fixed Asset Turnover | 4.07 | 0 |
| Payout ratio | 46.19% | 46.19% |
| Dividend yield | 2.46% | 2.57% |
| Fiscal Year | 2025 | 2025 |
Efficiency & Valuation Duel: The Vital Signs
Financial ratios act as a company’s DNA, uncovering hidden risks and operational strengths that drive investment decisions.
Johnson & Johnson
Johnson & Johnson demonstrates robust profitability, with a 32.87% ROE and a strong 28.46% net margin, signaling efficient operations. Its P/E ratio of 18.81 suggests a fairly valued stock, while a 2.46% dividend yield rewards shareholders steadily. The company balances disciplined capital allocation with solid growth reinvestment in R&D.
Gilead Sciences, Inc.
Gilead posts a favorable 28.9% net margin but shows zero ROE and ROIC, raising concerns about capital efficiency. Its P/E stands at 17.94, reflecting neutral valuation. The 2.57% dividend yield indicates consistent shareholder returns despite operational challenges. Limited liquidity ratios and asset turnover pose cautionary signals for investors.
Premium Valuation vs. Operational Safety
Johnson & Johnson offers a stronger balance of profitability and capital efficiency, supported by reliable dividends and R&D investment. Gilead’s attractive dividend yield contrasts with weaker returns on equity and capital. Investors prioritizing operational stability may favor Johnson & Johnson, while those seeking yield might consider Gilead’s risk profile.
Which one offers the Superior Shareholder Reward?
I compare Johnson & Johnson (JNJ) and Gilead Sciences (GILD) on dividend yield, payout ratio, and buyback intensity. JNJ yields 2.46% with a 46% payout, supported by strong free cash flow and steady buybacks. GILD offers a slightly higher 2.57% yield, also with a 46% payout ratio, but its buyback activity is less transparent. JNJ’s balanced distribution and robust capital allocation show sustainable total returns. GILD’s reinvestment and occasional payout spikes pose higher risk. I conclude JNJ offers a more attractive and reliable shareholder reward in 2026.
Comparative Score Analysis: The Strategic Profile
The radar chart reveals the fundamental DNA and trade-offs of Johnson & Johnson and Gilead Sciences, highlighting their core financial strengths and weaknesses:
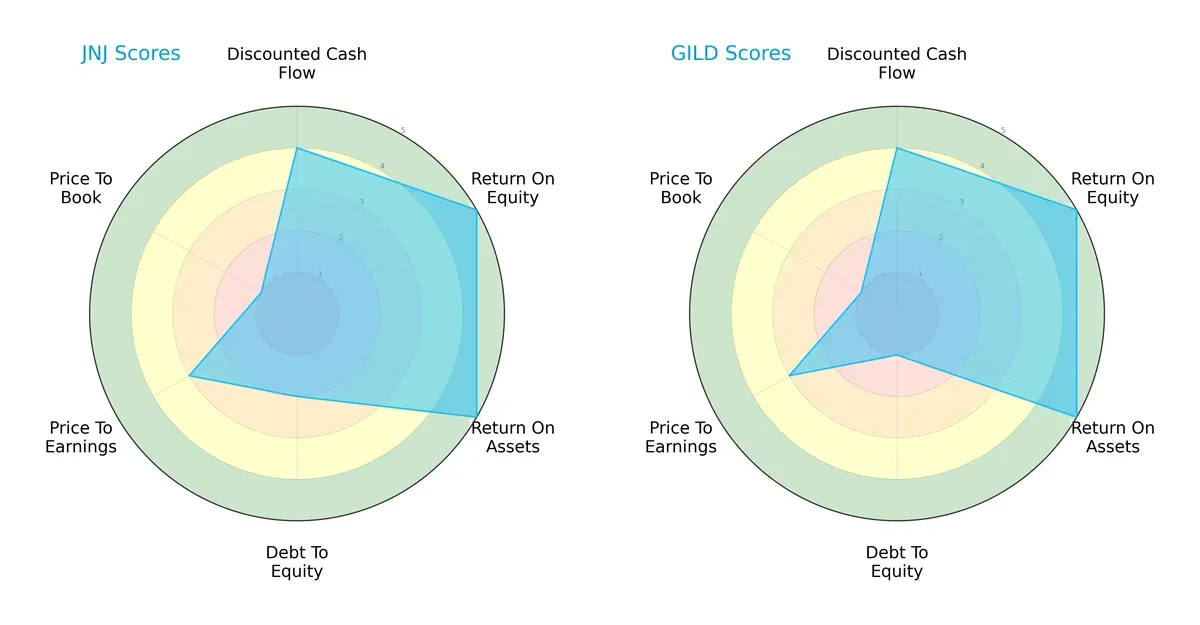
Johnson & Johnson shows a balanced profile with solid scores in discounted cash flow (4), ROE (5), and ROA (5), but weak debt management (2) and valuation metrics (P/E 3, P/B 1). Gilead leverages its operational efficiency (ROE 5, ROA 5) and superior debt control (1), yet struggles with valuation similarly (P/E 3, P/B 1). JNJ offers steadier overall stability, while GILD depends more on its capital structure advantage.
Bankruptcy Risk: Solvency Showdown
Johnson & Johnson’s Altman Z-Score (5.18) outpaces Gilead’s (4.38), indicating a stronger buffer against financial distress in this cycle:
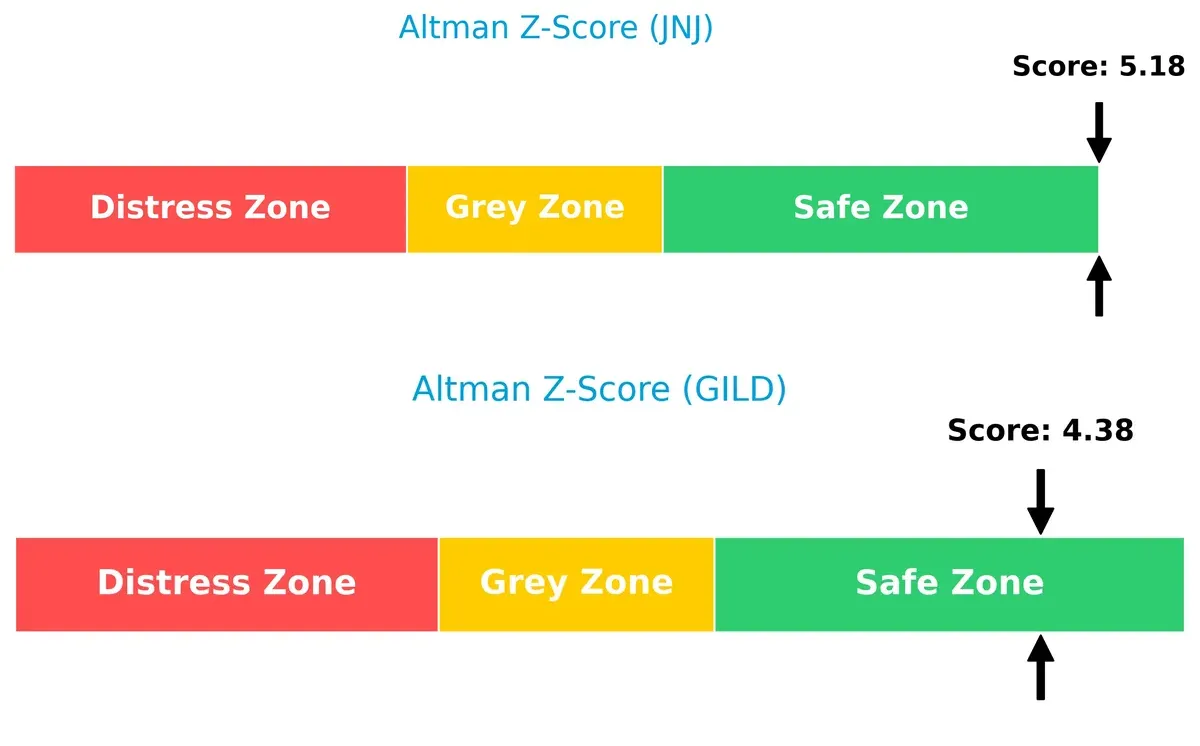
Both firms reside safely above the distress threshold of 3, but JNJ’s higher score reflects greater resilience to economic downturns, a critical factor given current market volatility.
Financial Health: Quality of Operations
Gilead’s Piotroski F-Score of 8 signals robust financial health, contrasting with Johnson & Johnson’s moderate score of 4, which flags potential red flags in operational metrics:
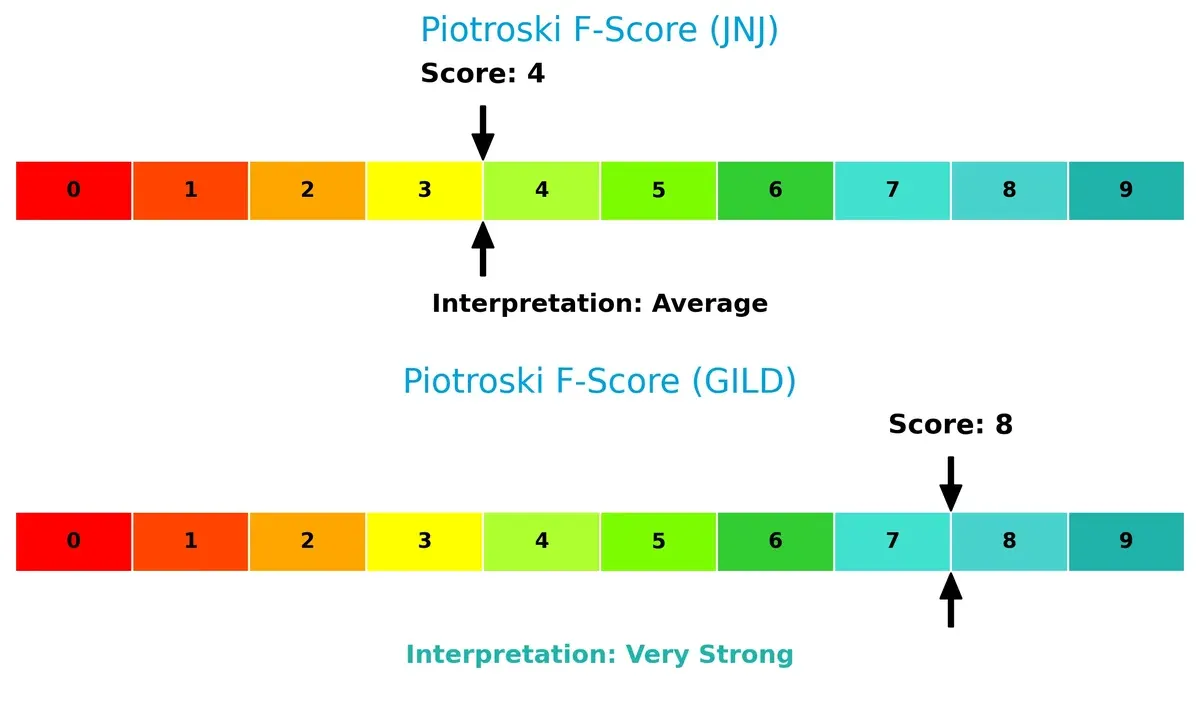
GILD exhibits strong profitability and efficiency fundamentals, making it preferable for investors wary of internal financial weakness. JNJ’s average score urges caution and deeper scrutiny of internal controls.
How are the two companies positioned?
This section dissects the operational DNA of Johnson & Johnson and Gilead Sciences by comparing revenue distribution and internal dynamics. Our goal is to confront their economic moats and identify which model offers the most resilient, sustainable competitive advantage today.
Revenue Segmentation: The Strategic Mix
The following visual comparison dissects how Johnson & Johnson and Gilead Sciences diversify their income streams and where their primary sector bets lie:
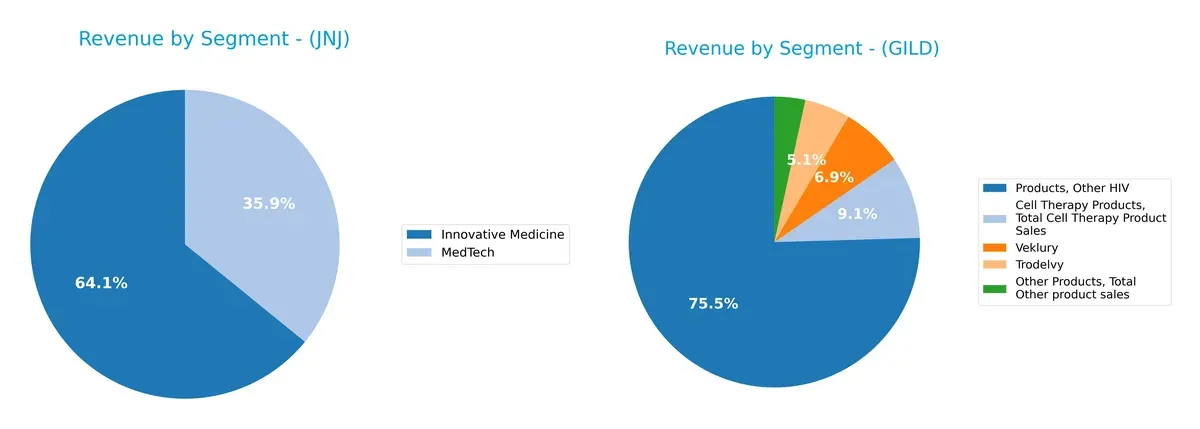
Johnson & Johnson anchors its revenue in Innovative Medicine at $60.4B and MedTech at $33.8B, showing a balanced, diversified mix. Gilead Sciences pivots heavily on HIV products at $19.6B, dwarfing other segments like Veklury and Trodelvy. J&J’s diversified model reduces concentration risk and supports ecosystem lock-in, while Gilead’s reliance on a dominant antiviral portfolio poses higher dependency risk amid shifting therapeutic landscapes.
Strengths and Weaknesses Comparison
This table compares the Strengths and Weaknesses of Johnson & Johnson and Gilead Sciences, Inc.:
JNJ Strengths
- Diversified revenue streams across Innovative Medicine, MedTech, and Consumer segments
- Strong profitability with net margin at 28.46% and ROE at 32.87%
- Favorable capital structure with low debt-to-assets at 24.06%
- Global presence with significant sales in U.S., Europe, and Asia-Pacific
- Consistent dividend yield of 2.46%
GILD Strengths
- Favorable net margin near 28.9%
- Low debt and favorable debt-to-assets ratio
- Strong dividend yield at 2.57%
- Market leadership in antiviral and cell therapy products
- Solid U.S. revenue base exceeding 20B
JNJ Weaknesses
- Unfavorable quick ratio at 0.77 indicating liquidity concerns
- Unfavorable asset turnover at 0.47 may imply lower operational efficiency
- High price-to-book ratio at 6.18 could signal overvaluation
- Neutral current ratio at 1.03 suggests marginal short-term financial health
GILD Weaknesses
- Zero ROE and ROIC indicate weak profitability on invested capital
- Unavailable WACC limits cost of capital assessment
- Unfavorable current and quick ratios suggest liquidity risk
- Poor asset and fixed asset turnover may reflect inefficiencies
Johnson & Johnson’s broad diversification and strong profitability contrast with Gilead’s concentrated product base and liquidity challenges. These differences shape each company’s strategic priorities in managing growth and financial resilience.
The Moat Duel: Analyzing Competitive Defensibility
A structural moat shields long-term profits from relentless competitive pressure. Its strength determines who thrives and who fades in the market:
Johnson & Johnson: Diversified Innovation Moat
JNJ’s moat stems from its broad portfolio in pharmaceuticals and medical devices, anchored by strong R&D and brand trust. It shows high ROIC (+8.6% vs WACC) but a slight declining trend, signaling value creation with caution. New drug launches and medical tech expansions could reinforce or threaten this edge in 2026.
Gilead Sciences, Inc.: Focused Therapeutic Moat
GILD’s moat relies on specialized antiviral and oncology drugs, contrasting JNJ’s diversification. Despite unavailable ROIC data, its superior gross margin (86.7%) and explosive EBIT growth (+549%) reveal efficient capital use. Pipeline advancements and cell therapy investments offer promising growth and market disruption potential.
Moat Resilience: Diversification vs. Specialization
JNJ holds a wider moat through its diversified innovation and consistent value creation, despite a slight ROIC decline. GILD’s specialized focus yields higher margins and growth spikes but lacks clear ROIC visibility. I see JNJ better positioned to defend market share amid evolving healthcare challenges.
Which stock offers better returns?
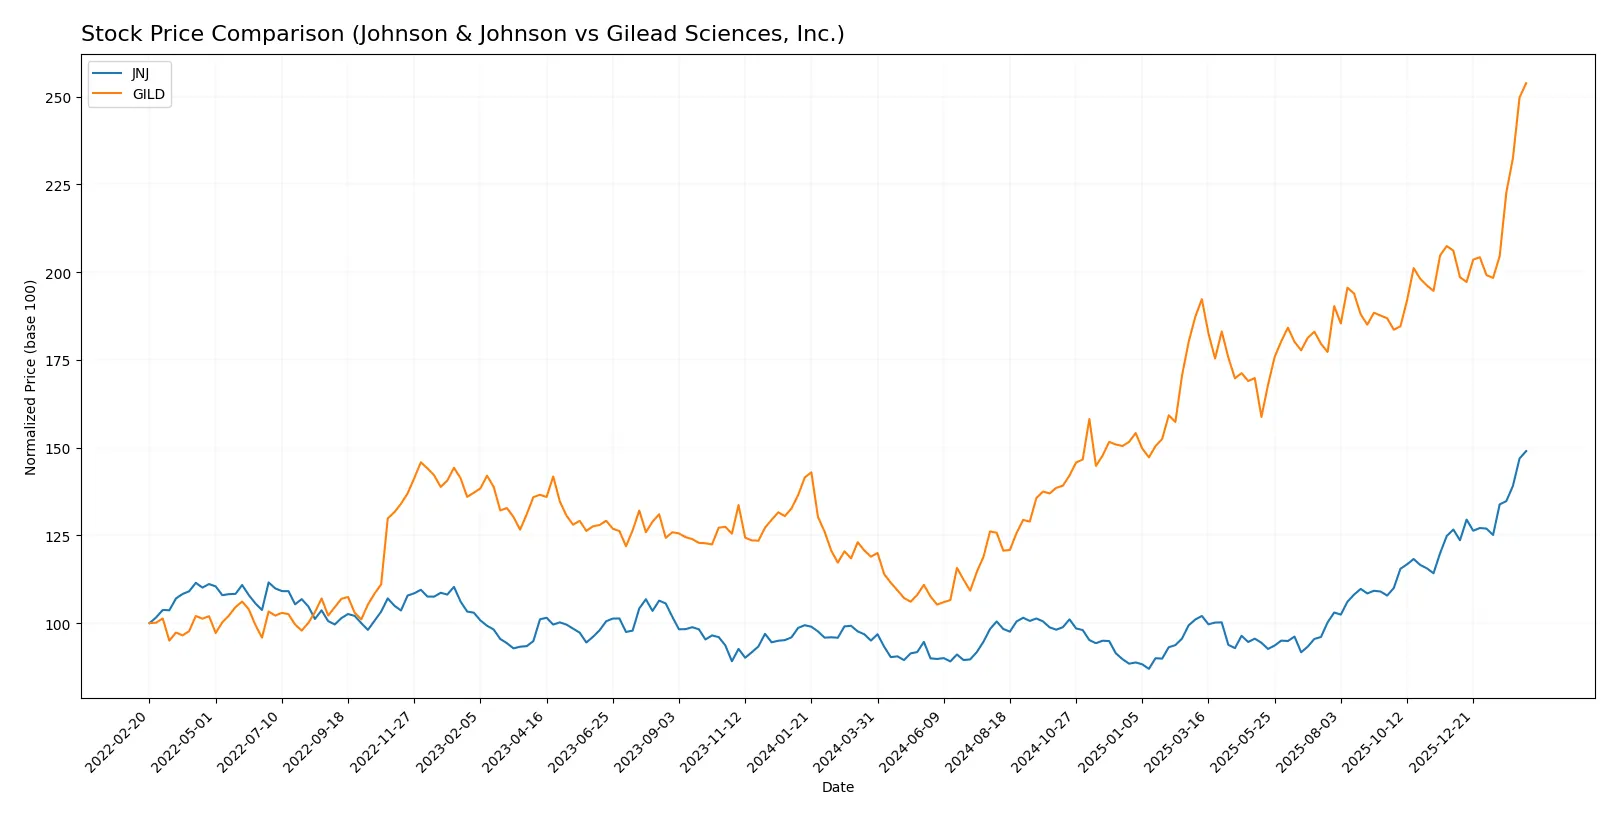
Both Johnson & Johnson and Gilead Sciences exhibit strong upward price momentum over the past year, with notable acceleration in gains and persistent buyer dominance in trading volumes.
Trend Comparison
Johnson & Johnson’s stock price rose 56.83% over the past 12 months, reflecting a bullish trend with accelerating gains and elevated volatility, peaking at 243.45 and bottoming at 142.06.
Gilead Sciences gained 113.44% over the same period, marking a stronger bullish trend with acceleration, a high of 154.98, a low of 64.27, and slightly lower volatility than JNJ.
Comparing trends, Gilead Sciences delivered superior market performance with a more than twofold price increase relative to Johnson & Johnson’s gains over the last year.
Target Prices
Analysts present a balanced target price consensus for Johnson & Johnson and Gilead Sciences, reflecting measured optimism.
| Company | Target Low | Target High | Consensus |
|---|---|---|---|
| Johnson & Johnson | 190 | 265 | 229.33 |
| Gilead Sciences, Inc. | 105 | 177 | 154.2 |
The consensus targets for both stocks align closely with current prices, suggesting moderate upside potential and cautious confidence among experts.

Don’t Let Luck Decide Your Entry Point
Optimize your entry points with our advanced ProRealTime indicators. You’ll get efficient buy signals with precise price targets for maximum performance. Start outperforming now!
How do institutions grade them?
Johnson & Johnson Grades
The following table shows recent grades from reputable financial institutions for Johnson & Johnson:
| Grading Company | Action | New Grade | Date |
|---|---|---|---|
| RBC Capital | Maintain | Outperform | 2026-02-03 |
| Morgan Stanley | Upgrade | Overweight | 2026-01-28 |
| Freedom Capital Markets | Maintain | Hold | 2026-01-27 |
| Guggenheim | Maintain | Buy | 2026-01-23 |
| Citigroup | Maintain | Buy | 2026-01-22 |
| Wells Fargo | Maintain | Overweight | 2026-01-22 |
| TD Cowen | Maintain | Buy | 2026-01-22 |
| Morgan Stanley | Maintain | Equal Weight | 2026-01-22 |
| Stifel | Maintain | Hold | 2026-01-22 |
| B of A Securities | Maintain | Neutral | 2026-01-22 |
Gilead Sciences, Inc. Grades
Here are the latest institutional grades for Gilead Sciences, Inc., from recognized analysts:
| Grading Company | Action | New Grade | Date |
|---|---|---|---|
| RBC Capital | Maintain | Sector Perform | 2026-02-11 |
| Needham | Maintain | Buy | 2026-02-11 |
| Wells Fargo | Maintain | Overweight | 2026-02-11 |
| Truist Securities | Maintain | Buy | 2026-02-11 |
| Cantor Fitzgerald | Maintain | Overweight | 2026-02-11 |
| Scotiabank | Maintain | Sector Outperform | 2026-02-11 |
| Truist Securities | Maintain | Buy | 2026-01-27 |
| Citigroup | Maintain | Buy | 2026-01-27 |
| UBS | Maintain | Buy | 2026-01-26 |
| Morgan Stanley | Maintain | Overweight | 2026-01-13 |
Which company has the best grades?
Johnson & Johnson holds a broader consensus of Buy and Outperform ratings, including upgrades. Gilead shows strong Buy and Overweight ratings, but also sector-specific grades. Investors may interpret JNJ’s grades as stronger institutional confidence overall.
Risks specific to each company
The following categories identify critical pressure points and systemic threats facing Johnson & Johnson and Gilead Sciences in the 2026 market environment:
1. Market & Competition
Johnson & Johnson
- Dominates diversified healthcare segments but faces innovation pressure post-Kenvue spin-off.
Gilead Sciences, Inc.
- Focuses on niche biopharma with heavy reliance on HIV and liver disease markets.
2. Capital Structure & Debt
Johnson & Johnson
- Moderate debt-to-equity at 0.59, solid interest coverage of 33.55x; balance sheet stable but leverage notable.
Gilead Sciences, Inc.
- Virtually zero reported debt; interest coverage at 10.57x supports financial flexibility, but liquidity ratios absent.
3. Stock Volatility
Johnson & Johnson
- Low beta at 0.347 signals defensive stock with limited volatility.
Gilead Sciences, Inc.
- Slightly higher beta at 0.387, indicating marginally more price sensitivity to market swings.
4. Regulatory & Legal
Johnson & Johnson
- Legacy litigation risks persist, especially in pharma and device segments; regulatory scrutiny high.
Gilead Sciences, Inc.
- Faces stringent FDA approvals and patent cliffs impacting drug pipeline security.
5. Supply Chain & Operations
Johnson & Johnson
- Complex global supply chain with diversified manufacturing; potential disruption risk remains.
Gilead Sciences, Inc.
- More concentrated production focus heightens vulnerability to operational disruptions.
6. ESG & Climate Transition
Johnson & Johnson
- Established ESG programs but faces challenges reducing footprint in MedTech and pharma manufacturing.
Gilead Sciences, Inc.
- Emerging ESG initiatives; pressure to improve sustainability in biotech R&D and production processes.
7. Geopolitical Exposure
Johnson & Johnson
- Extensive global footprint exposes it to trade tensions and regulatory shifts worldwide.
Gilead Sciences, Inc.
- International markets important but less geographically diversified, increasing regional risk.
Which company shows a better risk-adjusted profile?
Johnson & Johnson’s largest risk lies in regulatory and legacy litigation pressures, dampening its otherwise robust financials and global scale. Gilead’s key risk stems from product concentration and pipeline uncertainty. However, Gilead’s strong Piotroski score and minimal debt offer a more attractive risk-reward balance. Recent ratio data confirm JNJ’s leverage is manageable but quick ratio weaknesses flag potential short-term liquidity concerns. Overall, Gilead edges ahead on risk-adjusted terms due to its cleaner balance sheet and focused innovation-driven model.
Final Verdict: Which stock to choose?
Johnson & Johnson’s superpower lies in its robust capital efficiency and consistent value creation, backed by a strong moat evidenced by ROIC well above WACC. Its point of vigilance is the slight decline in profitability metrics, suggesting investors should monitor operational execution closely. This profile suits investors seeking steady, long-term growth with defensive qualities.
Gilead Sciences boasts a strategic moat rooted in its high-margin drug portfolio and recurring revenue streams, which fuel robust cash flow generation. Compared to Johnson & Johnson, it presents a more volatile safety profile due to less transparent capital metrics. Gilead fits investors who lean toward growth at a reasonable price with a tolerance for operational fluctuations.
If you prioritize durable value creation and capital efficiency, Johnson & Johnson is the compelling choice due to its proven moat and stable income growth. However, if you seek higher growth potential with exposure to innovative biotech, Gilead offers better upside, albeit with increased risk and less financial visibility. Both present valid scenarios depending on your risk tolerance and investment horizon.
Disclaimer: Investment carries a risk of loss of initial capital. The past performance is not a reliable indicator of future results. Be sure to understand risks before making an investment decision.
Go Further
I encourage you to read the complete analyses of Johnson & Johnson and Gilead Sciences, Inc. to enhance your investment decisions: