Williams-Sonoma, Inc. and Genuine Parts Company are two prominent players in the specialty retail sector, each with distinct market focuses but overlapping in their commitment to innovation and broad product distribution. Williams-Sonoma excels in home furnishings and lifestyle brands, while Genuine Parts leads in automotive and industrial replacement parts. This comparison will help you understand which company offers the most compelling investment opportunity in 2026. Let’s explore their strengths and potential.
Table of contents
Companies Overview
I will begin the comparison between Williams-Sonoma, Inc. and Genuine Parts Company by providing an overview of these two companies and their main differences.
Williams-Sonoma Overview
Williams-Sonoma, Inc. is an omni-channel specialty retailer focused on home products. It offers a broad range of cooking, dining, furniture, and home decor items through various brands like Williams Sonoma, Pottery Barn, and West Elm. The company operates 544 stores across multiple countries and also markets products via e-commerce and catalogs. Founded in 1956 and headquartered in San Francisco, it employs approximately 19,600 people.
Genuine Parts Company Overview
Genuine Parts Company distributes automotive and industrial replacement parts across diverse sectors, including automotive, industrial, and manufacturing. Its operations span multiple countries, serving customers such as repair shops, fleet operators, and manufacturers. Founded in 1928 and based in Atlanta, Georgia, GPC employs about 63,000 people, emphasizing a broad industrial and automotive aftermarket presence with value-added services.
Key similarities and differences
Both companies operate in the consumer cyclical sector and are listed on the NYSE, but their business models differ significantly. Williams-Sonoma focuses on specialty retail of home furnishings and decor with a strong omni-channel presence, while Genuine Parts specializes in distribution of automotive and industrial parts globally. Williams-Sonoma operates fewer employees and stores but emphasizes branded lifestyle products, whereas GPC serves diverse industrial markets with a larger workforce and extensive geographic reach.
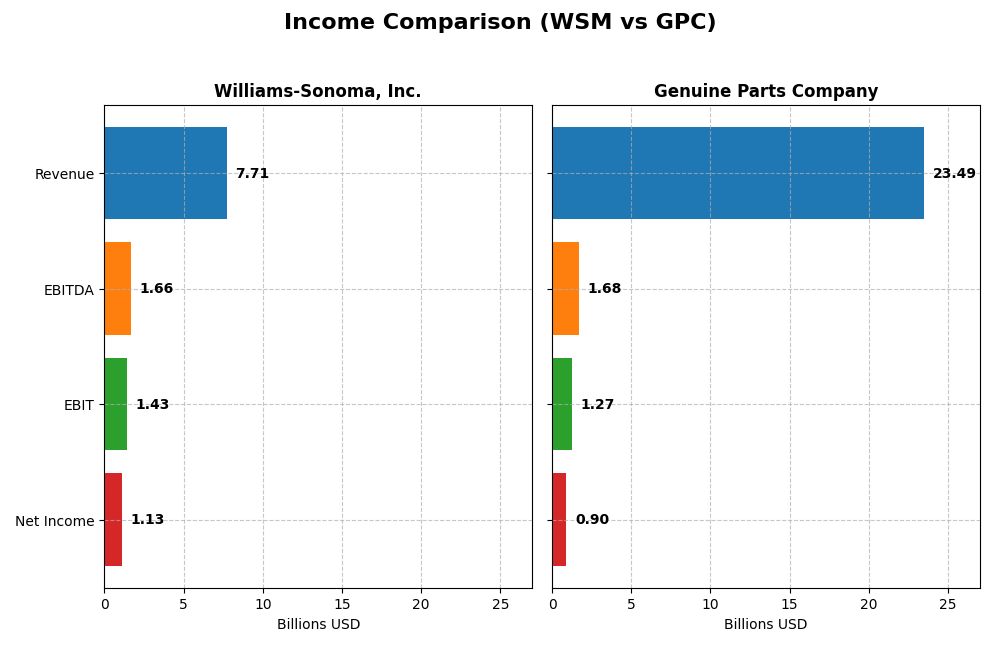
Income Statement Comparison
This table presents a side-by-side comparison of the most recent full fiscal year income statement metrics for Williams-Sonoma, Inc. and Genuine Parts Company.
| Metric | Williams-Sonoma, Inc. (WSM) | Genuine Parts Company (GPC) |
|---|---|---|
| Market Cap | 24.4B | 17.9B |
| Revenue | 7.71B | 23.49B |
| EBITDA | 1.66B | 1.68B |
| EBIT | 1.43B | 1.27B |
| Net Income | 1.13B | 904M |
| EPS | 8.91 | 6.49 |
| Fiscal Year | 2024 | 2024 |
Income Statement Interpretations
Williams-Sonoma, Inc.
Williams-Sonoma’s revenue showed moderate growth over 2020-2024, rising 13.7%, with net income increasing 65.3% over the same period. Margins remained strong and improved, with a gross margin of 46.45% and net margin of 14.59% in 2024. Despite a slight 0.5% revenue decline in 2024, profitability metrics such as EBIT and net margin grew significantly, indicating margin expansion and operational efficiency.
Genuine Parts Company
Genuine Parts Company’s revenue increased 42.0% from 2020 to 2024, with net income rising sharply by over 3200%. However, the net margin remained modest at 3.85% in 2024, signaling limited profitability relative to revenue. The latest year saw a 1.7% revenue gain but declines in EBIT (-29.6%), net margin (-32.5%), and EPS (-30.6%), reflecting challenges in cost control or operational pressures despite long-term growth.
Which one has the stronger fundamentals?
Williams-Sonoma demonstrates stronger fundamentals with consistently higher margins, favorable margin growth, and operational efficiency despite slight revenue softness in 2024. Genuine Parts shows impressive revenue and net income growth over the long term but faces margin compression and earnings declines recently. Overall, Williams-Sonoma’s income statement reflects more stable and efficient profitability metrics.
Financial Ratios Comparison
Below is a comparison of key financial ratios for Williams-Sonoma, Inc. (WSM) and Genuine Parts Company (GPC) based on their most recent annual fiscal year data.
| Ratios | Williams-Sonoma, Inc. (2024) | Genuine Parts Company (2024) |
|---|---|---|
| ROE | 52.5% | 20.8% |
| ROIC | 29.9% | 9.8% |
| P/E | 23.7 | 18.0 |
| P/B | 12.5 | 3.7 |
| Current Ratio | 1.44 | 1.16 |
| Quick Ratio | 0.74 | 0.51 |
| D/E (Debt-to-Equity) | 0.63 | 1.32 |
| Debt-to-Assets | 25.4% | 29.8% |
| Interest Coverage | Not available | 14.9 |
| Asset Turnover | 1.45 | 1.22 |
| Fixed Asset Turnover | 3.49 | 6.31 |
| Payout ratio | 24.9% | 61.4% |
| Dividend yield | 1.05% | 3.41% |
Interpretation of the Ratios
Williams-Sonoma, Inc.
Williams-Sonoma shows strong profitability with a net margin of 14.59% and an exceptionally high return on equity of 52.52%, indicating efficient use of shareholder capital. However, concerns arise from an unfavorable weighted average cost of capital and a high price-to-book ratio of 12.45. The company pays dividends with a moderate yield of 1.05%, supported by free cash flow coverage, suggesting sustainable distributions without excessive repurchases.
Genuine Parts Company
Genuine Parts Company presents a mixed picture with a low net margin of 3.85%, though it maintains a favorable return on equity of 20.84%. The debt-to-equity ratio of 1.32 and quick ratio of 0.51 raise liquidity and leverage concerns. It offers a higher dividend yield of 3.41%, supported by strong interest coverage, but the payout might be riskier given the lower profitability and moderate return on invested capital.
Which one has the best ratios?
Both companies have an equal proportion of favorable ratios at 50%, but Williams-Sonoma excels in profitability metrics like return on equity and net margin, while Genuine Parts Company has better dividend yield and interest coverage. Williams-Sonoma’s higher valuation multiples and cost of capital weigh against its strengths, making the overall ratio evaluation slightly favorable for both but with different risk profiles.
Strategic Positioning
This section compares the strategic positioning of Williams-Sonoma, Inc. and Genuine Parts Company across Market position, Key segments, and Exposure to technological disruption:
Williams-Sonoma, Inc.
- Operates omni-channel specialty retail with 544 stores globally; faces competitive retail sector pressure.
- Focuses on home products: cookware, furniture, décor, and lifestyle brands driving sales.
- Uses a 3-D imaging and augmented reality platform for home furnishings, indicating digital innovation.
Genuine Parts Company
- Distributes automotive and industrial parts across multiple countries; operates in a competitive supply industry.
- Key segments are automotive parts and industrial parts with broad industrial customer base.
- No explicit technological disruption noted; business relies on distribution and repair services.
Williams-Sonoma, Inc. vs Genuine Parts Company Positioning
Williams-Sonoma has a diversified retail focus across home product categories, leveraging digital tools like AR, while Genuine Parts concentrates on automotive and industrial parts distribution with extensive service offerings. Both operate internationally but in distinct markets.
Which has the best competitive advantage?
Both companies demonstrate a very favorable moat with growing ROIC above WACC, indicating durable competitive advantages; Williams-Sonoma’s higher ROIC premium suggests a stronger value creation over Genuine Parts.
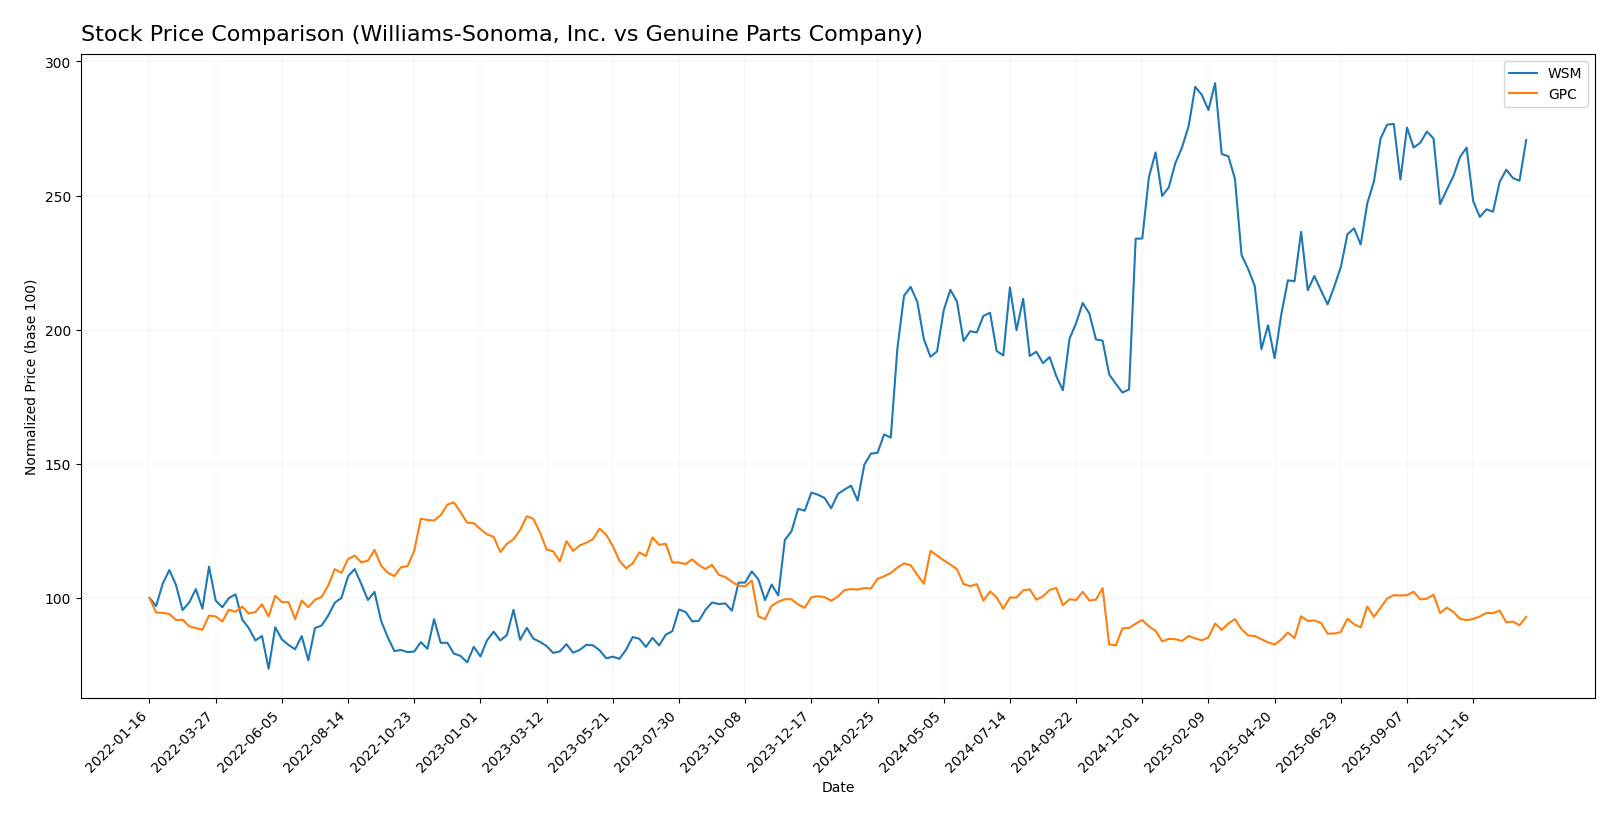
Stock Comparison
The past year has seen Williams-Sonoma, Inc. (WSM) exhibit a strong bullish momentum with significant price appreciation, while Genuine Parts Company (GPC) faced a bearish trend marked by declining prices and volume dynamics.
Trend Analysis
Williams-Sonoma, Inc. showed a bullish trend over the past 12 months with a 76.06% price increase, though the pace of growth has decelerated recently. The stock reached a high of 214.6 and a low of 113.05, displaying notable volatility with a 25.4 standard deviation.
Genuine Parts Company experienced a bearish trend with a 10.21% price decline over the year, coupled with accelerating negative momentum. Its price fluctuated between 113.61 and 162.39, with lower volatility at a 12.0 standard deviation.
Comparing the two, Williams-Sonoma delivered the highest market performance over the last 12 months, outperforming Genuine Parts which showed a downward trend.
Target Prices
The consensus target prices for Williams-Sonoma, Inc. and Genuine Parts Company reflect moderate upside potential based on analyst estimates.
| Company | Target High | Target Low | Consensus |
|---|---|---|---|
| Williams-Sonoma, Inc. | 230 | 175 | 205.75 |
| Genuine Parts Company | 150 | 140 | 145.33 |
Analysts expect Williams-Sonoma’s stock to rise moderately above the current price of $199.04, while Genuine Parts is forecasted to improve from its current $128.34, indicating positive but cautious optimism.
Analyst Opinions Comparison
This section compares analysts’ ratings and grades for Williams-Sonoma, Inc. and Genuine Parts Company:
Rating Comparison
Williams-Sonoma, Inc. Rating
- Rating: B+ indicating a very favorable overall assessment.
- Discounted Cash Flow Score: Moderate score of 3 reflects balanced valuation.
- ROE Score: Very favorable score of 5 shows strong profit generation.
- ROA Score: Very favorable score of 5 demonstrates excellent asset utilization.
- Debt To Equity Score: Moderate score of 2 indicates moderate financial risk.
- Overall Score: Moderate score of 3 reflects balanced overall financial health.
Genuine Parts Company Rating
- Rating: B indicating a very favorable overall assessment.
- Discounted Cash Flow Score: Favorable score of 4 suggests undervaluation potential.
- ROE Score: Favorable score of 4 indicates efficient equity use.
- ROA Score: Moderate score of 3 shows average asset efficiency.
- Debt To Equity Score: Very unfavorable score of 1 signals higher financial risk.
- Overall Score: Moderate score of 3 reflects balanced overall financial health.
Which one is the best rated?
Williams-Sonoma holds a higher rating of B+ versus Genuine Parts Company’s B. It scores very favorably in ROE and ROA and has a better debt-to-equity score. Genuine Parts scores higher on discounted cash flow but has a weaker debt profile.
Scores Comparison
Here is a comparison of the Altman Z-Score and Piotroski Score for Williams-Sonoma, Inc. and Genuine Parts Company:
WSM Scores
- Altman Z-Score: 7.04, in the safe zone, indicating low bankruptcy risk.
- Piotroski Score: 7, classified as strong financial health.
GPC Scores
- Altman Z-Score: 2.44, in the grey zone, indicating moderate bankruptcy risk.
- Piotroski Score: 6, classified as average financial health.
Which company has the best scores?
Williams-Sonoma, Inc. shows stronger financial stability with a higher Altman Z-Score in the safe zone and a stronger Piotroski Score compared to Genuine Parts Company’s moderate and average scores. This indicates better overall financial health based on provided data.
Grades Comparison
Here is the grades comparison for Williams-Sonoma, Inc. and Genuine Parts Company:
Williams-Sonoma, Inc. Grades
The following table summarizes recent grades and actions from established grading firms for Williams-Sonoma, Inc.:
| Grading Company | Action | New Grade | Date |
|---|---|---|---|
| Evercore ISI Group | maintain | In Line | 2025-12-23 |
| RBC Capital | maintain | Outperform | 2025-11-21 |
| Telsey Advisory Group | maintain | Outperform | 2025-11-20 |
| UBS | maintain | Neutral | 2025-11-20 |
| TD Cowen | maintain | Buy | 2025-11-20 |
| Citigroup | maintain | Neutral | 2025-11-20 |
| Telsey Advisory Group | maintain | Outperform | 2025-11-19 |
| Telsey Advisory Group | maintain | Outperform | 2025-11-14 |
| Wells Fargo | maintain | Equal Weight | 2025-11-11 |
| Evercore ISI Group | maintain | In Line | 2025-10-14 |
Williams-Sonoma shows a consistent pattern of “Outperform,” “Buy,” and “Neutral/In Line” grades, reflecting moderate confidence among analysts.
Genuine Parts Company Grades
The following table shows recent grades and actions from recognized grading firms for Genuine Parts Company:
| Grading Company | Action | New Grade | Date |
|---|---|---|---|
| Goldman Sachs | upgrade | Neutral | 2025-11-13 |
| JP Morgan | maintain | Overweight | 2025-10-23 |
| Truist Securities | maintain | Buy | 2025-10-22 |
| UBS | maintain | Neutral | 2025-10-10 |
| Evercore ISI Group | maintain | Outperform | 2025-10-01 |
| Evercore ISI Group | maintain | Outperform | 2025-08-26 |
| Loop Capital | maintain | Buy | 2025-07-24 |
| JP Morgan | maintain | Overweight | 2025-07-23 |
| Truist Securities | maintain | Buy | 2025-07-23 |
| UBS | maintain | Neutral | 2025-07-23 |
Genuine Parts Company’s grades show a solid consensus with multiple “Buy,” “Overweight,” and “Outperform” ratings, with one recent upgrade from “Sell” to “Neutral.”
Which company has the best grades?
Both companies have a consensus rating of “Hold,” but Genuine Parts Company has received a stronger proportion of “Buy” and “Overweight” grades compared to Williams-Sonoma’s mix of “Outperform,” “Buy,” and “Neutral” ratings. This suggests Genuine Parts may be viewed with slightly higher optimism, which could impact investor confidence and portfolio positioning.
Strengths and Weaknesses
Below is a comparative overview of key strengths and weaknesses for Williams-Sonoma, Inc. (WSM) and Genuine Parts Company (GPC), based on recent financial and operational data.
| Criterion | Williams-Sonoma, Inc. (WSM) | Genuine Parts Company (GPC) |
|---|---|---|
| Diversification | Moderate diversification across home furnishing segments (Pottery Barn, West Elm, Williams Sonoma) with strong ecommerce growth | Well diversified between Automotive Parts (approx. $14.8B) and Industrial Parts (approx. $8.7B) segments |
| Profitability | High profitability with net margin 14.6% and ROIC 29.9%, indicating efficient capital use | Moderate profitability; net margin lower at 3.9% but ROE strong at 20.8% and ROIC neutral at 9.8% |
| Innovation | Strong brand innovation and product differentiation in home furnishings supporting durable competitive advantage | Innovation more incremental, focused on supply chain efficiency and product availability in parts distribution |
| Global presence | Primarily North American with online sales expanding reach but limited global footprint | Broad North American and international distribution network, especially in automotive parts |
| Market Share | Leading market shares in specialty home furnishing categories | Leading distributor in automotive and industrial parts sectors with solid market penetration |
Williams-Sonoma exhibits strong profitability and innovation with a focused product portfolio, while Genuine Parts Company benefits from broader industrial diversification and a solid distribution network. Both show growing ROIC trends, indicating durable competitive advantages, but WSM leads in margin efficiency.
Risk Analysis
Below is a risk comparison table for Williams-Sonoma, Inc. (WSM) and Genuine Parts Company (GPC) based on their most recent financial and operational data from 2024.
| Metric | Williams-Sonoma, Inc. (WSM) | Genuine Parts Company (GPC) |
|---|---|---|
| Market Risk | High beta (1.58) indicates higher volatility. | Lower beta (0.75) points to less volatility. |
| Debt level | Moderate debt-to-equity (0.63), manageable leverage. | Higher debt-to-equity (1.32), elevated financial risk. |
| Regulatory Risk | Retail sector with moderate regulatory exposure globally. | Automotive and industrial parts distribution, exposed to trade regulations. |
| Operational Risk | Omni-channel retail operations with global stores; risks in supply chain and e-commerce. | Complex supply chain with global operations, subject to logistics disruptions. |
| Environmental Risk | Moderate, with increasing focus on sustainable products and packaging. | Moderate, exposure in industrial sectors with evolving environmental compliance. |
| Geopolitical Risk | Presence in North America, Europe, Asia — moderate geopolitical exposure. | Operations in multiple countries including Europe, Asia, and North America; higher geopolitical sensitivity. |
The most impactful risks are GPC’s higher debt level and geopolitical exposure, increasing financial and operational vulnerability. WSM’s higher market volatility due to beta above 1.5 is a key market risk. Both companies have moderate operational and environmental risks related to their global footprint and sector regulations. Caution is warranted regarding leverage for GPC and market fluctuations for WSM.
Which Stock to Choose?
Williams-Sonoma, Inc. (WSM) shows a favorable income evolution with strong profitability and growing net margin, supported by a very favorable ROE of 52.52% and low debt levels. Its financial ratios are slightly favorable overall, and it holds a very favorable rating of B+.
Genuine Parts Company (GPC) displays a positive long-term income growth but recent declines in profitability, reflected in a moderate net margin of 3.85% and higher debt levels. Its financial ratios are slightly favorable overall, with a very favorable rating of B, though debt metrics appear less favorable.
For investors prioritizing strong profitability and stable financial health, WSM’s robust income and very favorable rating may appear more attractive. Conversely, those valuing potential value creation with a durable competitive advantage despite higher leverage might find GPC’s profile suitable. The choice could depend on one’s risk tolerance and investment strategy focus.
Disclaimer: Investment carries a risk of loss of initial capital. The past performance is not a reliable indicator of future results. Be sure to understand risks before making an investment decision.
Go Further
I encourage you to read the complete analyses of Williams-Sonoma, Inc. and Genuine Parts Company to enhance your investment decisions: