In today’s dynamic retail landscape, Ulta Beauty, Inc. and Genuine Parts Company stand out as influential players with distinct yet overlapping market presences. Ulta Beauty captivates consumers with its comprehensive beauty products and salon services, while Genuine Parts Company commands the automotive and industrial parts distribution sector. Both companies leverage innovation to deepen customer engagement and expand reach. This article will help you decide which company offers the most compelling investment opportunity in 2026.
Table of contents
Companies Overview
I will begin the comparison between Ulta Beauty and Genuine Parts Company by providing an overview of these two companies and their main differences.
Ulta Beauty Overview
Ulta Beauty, Inc. operates as a specialty retailer of beauty products in the US, offering cosmetics, fragrances, skincare, haircare, and salon services. With 1,308 stores nationwide and a strong online presence, Ulta focuses on both branded and private label products. Founded in 1990 and based in Bolingbrook, Illinois, the company positions itself as a comprehensive beauty destination for consumers.
Genuine Parts Company Overview
Genuine Parts Company distributes automotive replacement and industrial parts across multiple continents, including North America, Europe, and Asia-Pacific. Established in 1928 and headquartered in Atlanta, Georgia, GPC serves diverse markets such as automotive aftermarket customers and industrial maintenance with an extensive product and service portfolio. It operates through Automotive and Industrial Parts segments, supporting a wide range of vehicles and industries.
Key similarities and differences
Both companies operate in the specialty retail sector but target distinct markets: Ulta Beauty focuses on consumer beauty products and services, while Genuine Parts Company serves automotive and industrial customers with replacement parts and repair services. Ulta’s business centers on direct retail and online sales, whereas GPC emphasizes distribution and value-added services across global industrial and automotive supply chains. Their geographic reach and customer bases also differ significantly.
Income Statement Comparison
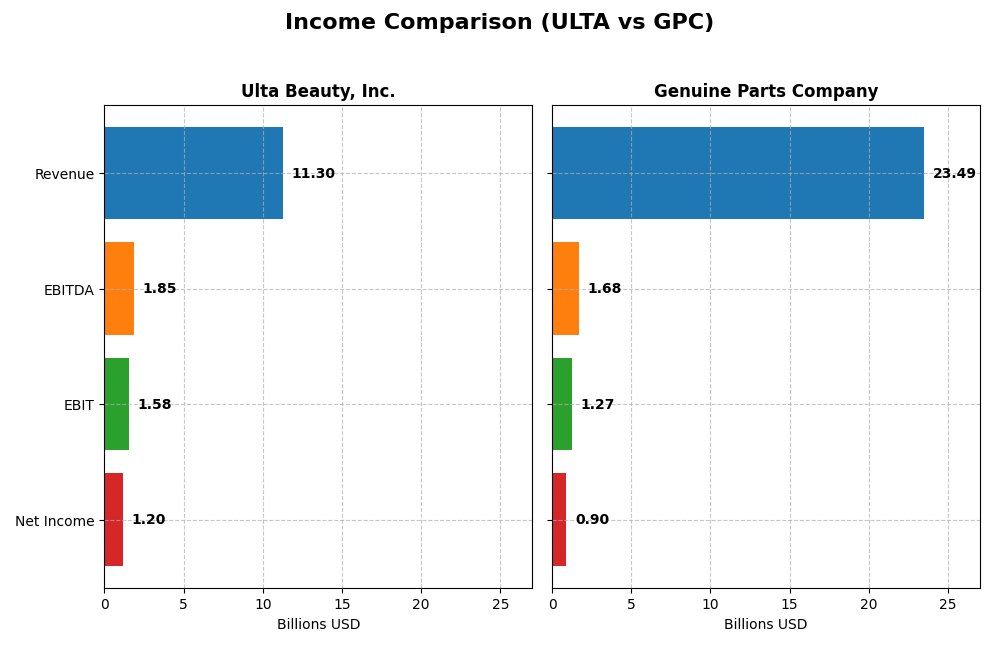
Below is a comparison of the most recent fiscal year income statement metrics for Ulta Beauty, Inc. and Genuine Parts Company.
| Metric | Ulta Beauty, Inc. | Genuine Parts Company |
|---|---|---|
| Market Cap | 29.9B | 17.9B |
| Revenue | 11.3B | 23.5B |
| EBITDA | 1.85B | 1.68B |
| EBIT | 1.58B | 1.27B |
| Net Income | 1.20B | 904M |
| EPS | 25.44 | 6.49 |
| Fiscal Year | 2024 | 2024 |
Income Statement Interpretations
Ulta Beauty, Inc.
Ulta Beauty has shown strong revenue growth of 83.61% from 2020 to 2024, with net income rising 583.09% over the same period. Margins remain favorable, with a gross margin of 38.84% and net margin at 10.63%. However, in 2024, revenue growth slowed to 0.79%, and net margin declined by 7.69%, indicating some recent pressure on profitability.
Genuine Parts Company
Genuine Parts Company’s revenue increased by 42.02% from 2020 to 2024, while net income surged 3206.58% overall. The gross margin stands at 36.29%, slightly lower than Ulta’s, and net margin is neutral at 3.85%. Despite favorable long-term growth, the latest year saw a decline in EBIT by 29.56% and net margin down 32.49%, signaling challenges in operational efficiency.
Which one has the stronger fundamentals?
Ulta Beauty displays higher and more stable margins, with consistent long-term growth and a favorable global income statement evaluation. Genuine Parts shows impressive net income growth but faces greater margin volatility and weaker recent profitability metrics. Both have favorable overall assessments, but Ulta’s stronger margins and steadier recent performance suggest relatively more robust fundamentals.
Financial Ratios Comparison
The table below presents a factual comparison of key financial ratios for Ulta Beauty, Inc. and Genuine Parts Company for the most recent fiscal year available, 2024.
| Ratios | Ulta Beauty, Inc. (ULTA) | Genuine Parts Company (GPC) |
|---|---|---|
| ROE | 48.3% | 20.8% |
| ROIC | 26.6% | 9.8% |
| P/E | 16.2 | 18.0 |
| P/B | 7.82 | 3.75 |
| Current Ratio | 1.70 | 1.16 |
| Quick Ratio | 0.60 | 0.51 |
| D/E | 0.77 | 1.32 |
| Debt-to-Assets | 32.0% | 29.8% |
| Interest Coverage | 0 (not reported) | 14.9 |
| Asset Turnover | 1.88 | 1.22 |
| Fixed Asset Turnover | 3.96 | 6.31 |
| Payout ratio | 0% | 61.4% |
| Dividend yield | 0% | 3.41% |
Interpretation of the Ratios
Ulta Beauty, Inc.
Ulta Beauty demonstrates generally strong financial ratios with favorable net margin (10.63%), ROE (48.27%), and ROIC (26.61%), reflecting high profitability and efficient capital use. However, the valuation ratio PB is unfavorable at 7.82, and the quick ratio is weak at 0.6, indicating potential liquidity concerns. The company does not pay dividends, likely prioritizing reinvestment or growth initiatives.
Genuine Parts Company
Genuine Parts shows mixed results, with a low net margin of 3.85% marked unfavorable but a solid ROE of 20.84% and favorable interest coverage at 13.15, suggesting adequate earnings relative to debt costs. The debt-to-equity ratio of 1.32 is unfavorable, indicating higher leverage. The company pays a dividend yielding 3.41%, supported by a moderate payout ratio, reflecting shareholder returns through dividends.
Which one has the best ratios?
Ulta Beauty’s ratios are overall more favorable, particularly in profitability and capital efficiency metrics, though it lacks dividend payments. Genuine Parts offers a consistent dividend and moderate profitability but is burdened by higher leverage and weaker margins. Thus, Ulta Beauty appears stronger on operational performance, while Genuine Parts balances income with shareholder returns.
Strategic Positioning
This section compares the strategic positioning of Ulta Beauty and Genuine Parts Company, covering Market position, Key segments, and Exposure to technological disruption:
Ulta Beauty, Inc.
- Leading specialty retailer in beauty products with moderate competition in the U.S.
- Focused on beauty products, salon services, and e-commerce as primary revenue drivers.
- Retail model with physical stores and e-commerce; limited explicit exposure to technological disruption noted.
Genuine Parts Company
- Major distributor in automotive and industrial parts across multiple countries, facing diverse competition.
- Diverse automotive and industrial parts segments serve various repair and maintenance markets globally.
- Exposure to automotive parts for hybrid and electric vehicles suggests adaptation to industry technological shifts.
Ulta Beauty, Inc. vs Genuine Parts Company Positioning
Ulta Beauty concentrates on beauty retail and salon services primarily in the U.S., benefiting from a focused product and service offering. Genuine Parts Company operates a more diversified business across automotive and industrial parts internationally, providing broader market exposure but potentially more complex competitive dynamics.
Which has the best competitive advantage?
Both companies show very favorable MOAT evaluations with growing ROIC trends, indicating durable competitive advantages. Ulta Beauty’s higher ROIC compared to WACC suggests a stronger value creation and more efficient capital use than Genuine Parts Company.
Stock Comparison
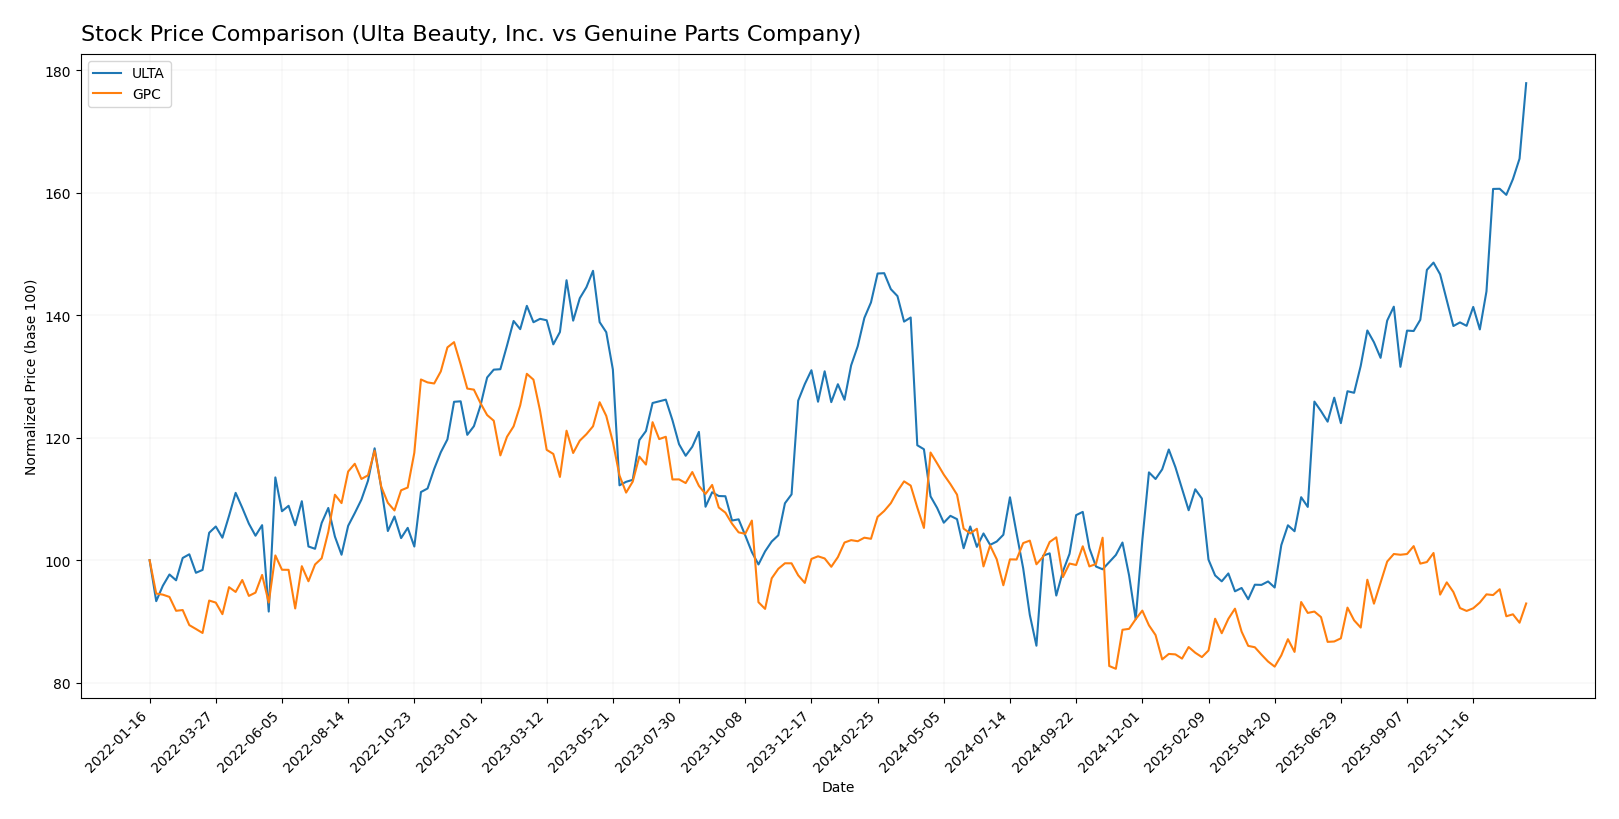
The stock prices of Ulta Beauty, Inc. and Genuine Parts Company have exhibited contrasting patterns over the past year, with Ulta showing robust gains amid accelerating momentum, while Genuine Parts experienced a notable decline with increasing volatility.
Trend Analysis
Ulta Beauty, Inc. recorded a 25.2% price increase over the past 12 months, reflecting a bullish trend with accelerating price momentum and substantial volatility, reaching a high of 666.18 and a low of 322.17.
Genuine Parts Company posted a 10.21% decline over the same period, indicating a bearish trend accompanied by accelerating downside movement and moderate volatility, with its highest price at 162.39 and lowest at 113.61.
Comparatively, Ulta Beauty delivered the highest market performance with a strong upward trajectory, while Genuine Parts lagged behind, reflecting a clear divergence in stock trends.
Target Prices
The current analyst consensus reveals clear target price ranges for Ulta Beauty, Inc. and Genuine Parts Company.
| Company | Target High | Target Low | Consensus |
|---|---|---|---|
| Ulta Beauty, Inc. | 780 | 425 | 648.4 |
| Genuine Parts Company | 150 | 140 | 145.33 |
Analysts expect Ulta Beauty’s stock to trade near its current price of 666.18 USD, with a broad range indicating some volatility. Genuine Parts Company’s consensus target of 145.33 USD suggests moderate upside from its last price of 128.34 USD.
Analyst Opinions Comparison
This section compares analysts’ ratings and financial scores for Ulta Beauty, Inc. (ULTA) and Genuine Parts Company (GPC):
Rating Comparison
ULTA Rating
- Rating: A-, indicating a very favorable overall assessment of financial health.
- Discounted Cash Flow Score: 4, a favorable score suggesting reasonable valuation.
- ROE Score: 5, very favorable, showing high efficiency in generating equity returns.
- ROA Score: 5, very favorable, indicating excellent asset utilization.
- Debt To Equity Score: 2, moderate financial risk with some leverage.
- Overall Score: 4, favorable overall financial standing.
GPC Rating
- Rating: B, also considered very favorable but lower than ULTA’s rating.
- Discounted Cash Flow Score: 4, favorable valuation similar to ULTA.
- ROE Score: 4, favorable but less efficient than ULTA in generating equity returns.
- ROA Score: 3, moderate asset utilization compared to ULTA’s higher score.
- Debt To Equity Score: 1, very unfavorable, indicating higher financial risk.
- Overall Score: 3, moderate overall financial condition.
Which one is the best rated?
Based strictly on the provided data, ULTA holds a superior rating with an A- grade and higher overall score of 4 compared to GPC’s B rating and score of 3. ULTA outperforms GPC in ROE, ROA, and maintains a moderate debt level, while GPC shows higher financial risk.
Scores Comparison
Here is a comparison of the Altman Z-Score and Piotroski Score for both companies:
ULTA Scores
- Altman Z-Score: 6.64, indicating a safe zone from bankruptcy risk.
- Piotroski Score: 6, classified as average financial strength.
GPC Scores
- Altman Z-Score: 2.44, placing it in the grey zone with moderate bankruptcy risk.
- Piotroski Score: 6, also classified as average financial strength.
Which company has the best scores?
ULTA shows a stronger Altman Z-Score, firmly in the safe zone, compared to GPC’s grey zone rating. Both companies share the same average Piotroski Score of 6, reflecting comparable financial strength in that metric.
Grades Comparison
Here is the comparison of recent grades and ratings for Ulta Beauty, Inc. and Genuine Parts Company:
Ulta Beauty, Inc. Grades
This table summarizes recent grades and actions from reputable grading companies for Ulta Beauty, Inc.:
| Grading Company | Action | New Grade | Date |
|---|---|---|---|
| B of A Securities | Maintain | Neutral | 2026-01-08 |
| UBS | Maintain | Buy | 2026-01-07 |
| Argus Research | Maintain | Buy | 2026-01-02 |
| Oppenheimer | Maintain | Outperform | 2025-12-10 |
| TD Cowen | Upgrade | Buy | 2025-12-08 |
| Morgan Stanley | Maintain | Overweight | 2025-12-08 |
| Guggenheim | Maintain | Neutral | 2025-12-05 |
| UBS | Maintain | Buy | 2025-12-05 |
| Canaccord Genuity | Maintain | Buy | 2025-12-05 |
| Baird | Maintain | Outperform | 2025-12-05 |
Ulta Beauty shows predominantly positive grades with multiple “Buy” and “Outperform” ratings, indicating a generally optimistic outlook by analysts.
Genuine Parts Company Grades
This table presents recent grades and actions from recognized grading firms for Genuine Parts Company:
| Grading Company | Action | New Grade | Date |
|---|---|---|---|
| Goldman Sachs | Upgrade | Neutral | 2025-11-13 |
| JP Morgan | Maintain | Overweight | 2025-10-23 |
| Truist Securities | Maintain | Buy | 2025-10-22 |
| UBS | Maintain | Neutral | 2025-10-10 |
| Evercore ISI Group | Maintain | Outperform | 2025-10-01 |
| Evercore ISI Group | Maintain | Outperform | 2025-08-26 |
| Loop Capital | Maintain | Buy | 2025-07-24 |
| JP Morgan | Maintain | Overweight | 2025-07-23 |
| Truist Securities | Maintain | Buy | 2025-07-23 |
| UBS | Maintain | Neutral | 2025-07-23 |
Genuine Parts Company has a mix of “Buy”, “Outperform”, and “Neutral” grades with some recent upgrades, showing steady confidence from analysts.
Which company has the best grades?
Ulta Beauty holds a stronger consensus with a “Buy” rating supported by 26 buys versus Genuine Parts Company’s “Hold” consensus with a nearly even split between buys and holds. This suggests Ulta may be viewed more favorably by analysts, potentially impacting investor sentiment and portfolio positioning accordingly.
Strengths and Weaknesses
Below is a comparison table summarizing the strengths and weaknesses of Ulta Beauty, Inc. (ULTA) and Genuine Parts Company (GPC) based on their recent financial and operational data.
| Criterion | Ulta Beauty, Inc. (ULTA) | Genuine Parts Company (GPC) |
|---|---|---|
| Diversification | Moderate product and service diversification with strong e-commerce and salon services | Broad product segmentation across automotive and industrial parts |
| Profitability | High net margin (10.63%) and excellent ROE (48.27%) | Lower net margin (3.85%) but solid ROE (20.84%) |
| Innovation | Strong innovation indicated by high asset turnover (1.88) and fixed asset turnover (3.96) | Moderate innovation with high fixed asset turnover (6.31) but slower growth |
| Global presence | Primarily domestic with growth in e-commerce channels | Established global presence with diverse industrial markets |
| Market Share | Strong in beauty retail with durable competitive advantage (ROIC > WACC by 19.1%) | Strong industrial and automotive parts market share with positive ROIC margin (3.7%) |
Ulta Beauty exhibits strong profitability and innovation with a durable competitive advantage, driven by its e-commerce and salon service growth. Genuine Parts Company shows balanced diversification and stable profitability but faces margin pressure, requiring cautious monitoring despite its solid global footprint.
Risk Analysis
Below is a comparison of key risks for Ulta Beauty, Inc. (ULTA) and Genuine Parts Company (GPC) based on 2024 data and recent market conditions:
| Metric | Ulta Beauty, Inc. (ULTA) | Genuine Parts Company (GPC) |
|---|---|---|
| Market Risk | Moderate (Beta 0.85) | Moderate (Beta 0.75) |
| Debt level | Moderate (Debt-to-Equity 0.77) | Higher (Debt-to-Equity 1.32) |
| Regulatory Risk | Moderate (Consumer product safety) | Moderate (Automotive & industrial regulations) |
| Operational Risk | Moderate (Retail & supply chain) | Moderate (Global supply chain complexity) |
| Environmental Risk | Low (Limited direct impact) | Moderate (Industrial parts manufacturing) |
| Geopolitical Risk | Low (Primarily US market) | Moderate (Global operations in multiple countries) |
Ulta’s most impactful risks stem from operational dependencies on retail trends and supply chain resilience, while Genuine Parts faces higher financial risk due to leverage and geopolitical exposure from its global footprint. Both have moderate market and regulatory risks but differ in debt profiles and geographic diversification.
Which Stock to Choose?
Ulta Beauty, Inc. shows a favorable income evolution with strong profitability metrics, including a 48.27% ROE and 26.61% ROIC, modest debt levels, and a very favorable A- rating, supported by a very favorable moat indicating durable competitive advantage.
Genuine Parts Company exhibits moderate income growth with a lower net margin and ROIC compared to Ulta, higher debt ratios, but maintains a very favorable B rating and a very favorable moat status, reflecting consistent value creation despite some financial constraints.
Investors with a growth-oriented profile might find Ulta’s strong profitability and robust financial ratios appealing, while those prioritizing stability and dividend yield could view Genuine Parts as slightly favorable due to its moderate ratios and consistent value creation; both present differing risk-return profiles.
Disclaimer: Investment carries a risk of loss of initial capital. The past performance is not a reliable indicator of future results. Be sure to understand risks before making an investment decision.
Go Further
I encourage you to read the complete analyses of Ulta Beauty, Inc. and Genuine Parts Company to enhance your investment decisions: