In today’s dynamic specialty retail sector, PDD Holdings Inc. and Genuine Parts Company stand out with distinct yet overlapping market footprints. PDD Holdings drives innovation through its digital commerce platforms, transforming consumer access to diverse products globally. Genuine Parts Company, with a century-long legacy, excels in automotive and industrial parts distribution across multiple continents. This comparison will help you identify which company offers the most compelling investment opportunity in 2026. Let’s explore their strengths and risks together.
Table of contents
Companies Overview
I will begin the comparison between PDD Holdings Inc. and Genuine Parts Company by providing an overview of these two companies and their main differences.
PDD Holdings Inc. Overview
PDD Holdings Inc. is a multinational commerce group operating e-commerce platforms including Pinduoduo and Temu. Its mission centers on integrating businesses and consumers into the digital economy by offering a broad range of products such as agricultural produce, apparel, electronics, and household goods. Founded in 2015 and based in Dublin, Ireland, PDD has established itself firmly within the specialty retail sector.
Genuine Parts Company Overview
Genuine Parts Company specializes in distributing automotive replacement parts and industrial supplies through its Automotive Parts and Industrial Parts segments. Established in 1928 and headquartered in Atlanta, Georgia, it serves a diverse client base across multiple industries including automotive, manufacturing, and energy. The company operates primarily in the United States and several international markets, emphasizing service and repair alongside product distribution.
Key similarities and differences
Both PDD and Genuine Parts operate within the specialty retail sector but target distinct markets: PDD focuses on online consumer goods via e-commerce, while Genuine Parts concentrates on automotive and industrial parts distribution. PDD leverages digital platforms to connect consumers and businesses, whereas Genuine Parts emphasizes physical supply chains and value-added services. Their geographic footprints also differ, with PDD headquartered in Ireland and Genuine Parts in the US, serving broader international regions.
Income Statement Comparison
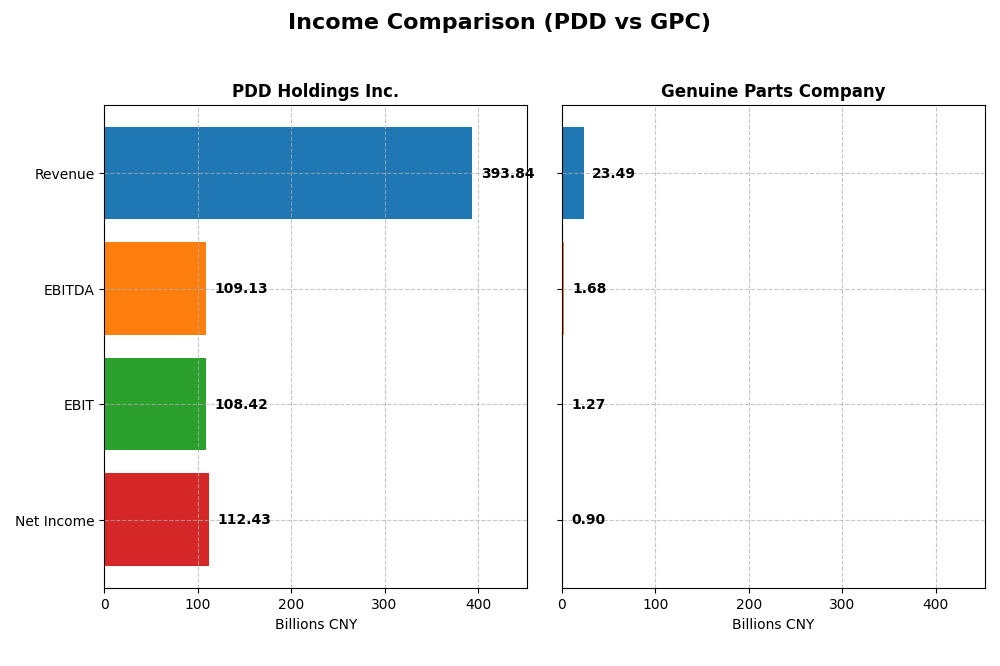
The table below presents a side-by-side comparison of the most recent fiscal year income statement metrics for PDD Holdings Inc. and Genuine Parts Company.
| Metric | PDD Holdings Inc. (2024) | Genuine Parts Company (2024) |
|---|---|---|
| Market Cap | 169B CNY | 17.9B USD |
| Revenue | 394B CNY | 23.5B USD |
| EBITDA | 109B CNY | 1.68B USD |
| EBIT | 108B CNY | 1.27B USD |
| Net Income | 112B CNY | 904M USD |
| EPS | 81.24 CNY | 6.49 USD |
| Fiscal Year | 2024 | 2024 |
Income Statement Interpretations
PDD Holdings Inc.
PDD Holdings has demonstrated strong revenue and net income growth from 2020 to 2024, with revenue surging from 59.5B CNY to nearly 394B CNY and net income climbing from a loss to 112.4B CNY. Margins have improved markedly, with a gross margin of 60.92% and an EBIT margin of 27.53% in 2024. The latest year showed accelerated growth, with net income up 87% and margin expansion supporting robust profitability.
Genuine Parts Company
Genuine Parts Company’s revenue grew modestly from 16.5B USD in 2020 to 23.5B USD in 2024, while net income rebounded from a small loss to 904M USD. Margins remain more compressed, with a gross margin of 36.29% and a subdued EBIT margin of 5.42% in 2024. The most recent year saw a slight revenue increase but a notable decline in EBIT and net margin, indicating pressure on operational efficiency.
Which one has the stronger fundamentals?
PDD Holdings shows stronger fundamentals with consistently favorable margin improvements, substantial revenue and net income growth, and zero interest expense contributing to financial leverage. Genuine Parts Company, although profitable over the longer term, faces margin compression and recent declines in profitability metrics. Overall, PDD’s financial performance reflects more favorable income statement trends and growth dynamics.
Financial Ratios Comparison
This table presents the most recent key financial ratios for PDD Holdings Inc. and Genuine Parts Company, allowing a straightforward comparison of their operational efficiency, profitability, liquidity, and leverage as of fiscal year 2024.
| Ratios | PDD Holdings Inc. | Genuine Parts Company |
|---|---|---|
| ROE | 35.9% | 20.8% |
| ROIC | 28.4% | 9.8% |
| P/E | 8.7 | 18.0 |
| P/B | 3.13 | 3.75 |
| Current Ratio | 2.21 | 1.16 |
| Quick Ratio | 2.20 | 0.51 |
| D/E | 0.034 | 1.32 |
| Debt-to-Assets | 2.1% | 29.8% |
| Interest Coverage | 0 (not reported) | 14.9 |
| Asset Turnover | 0.78 | 1.22 |
| Fixed Asset Turnover | 66.3 | 6.31 |
| Payout Ratio | 0 | 61.4% |
| Dividend Yield | 0% | 3.41% |
Interpretation of the Ratios
PDD Holdings Inc.
PDD Holdings shows predominantly strong ratios with a high net margin of 28.55%, robust ROE at 35.89%, and a favorable ROIC of 28.35%. The company benefits from a very low debt-to-equity ratio of 0.03 and excellent liquidity ratios above 2. However, the price-to-book ratio of 3.13 is somewhat elevated, and the dividend yield is zero, reflecting no dividend payments likely due to reinvestment in growth and development phases.
Genuine Parts Company
Genuine Parts Company presents mixed results with a modest net margin of 3.85% and a favorable ROE of 20.84%, but a neutral ROIC at 9.82%. Its leverage is higher, with a debt-to-equity ratio of 1.32, and liquidity is weaker, especially the quick ratio at 0.51. The company pays dividends with a 3.41% yield, supported by a reasonable payout, although some ratios reflect caution on financial strength and operational efficiency.
Which one has the best ratios?
PDD Holdings demonstrates a more favorable overall ratio profile, with a higher proportion of strong metrics, superior profitability, and better liquidity, despite not paying dividends. Genuine Parts shows a more conservative dividend yield but has several weaker financial ratios, including leverage and liquidity concerns. Therefore, PDD’s ratios are generally stronger and more favorable in this comparison.
Strategic Positioning
This section compares the strategic positioning of PDD Holdings Inc. and Genuine Parts Company, focusing on market position, key segments, and exposure to technological disruption:
PDD
- Leading multinational e-commerce platform with low beta, operating in consumer cyclical.
- Diverse portfolio including online marketing and transaction services driving growth.
- Positioned in digital economy with potential exposure to e-commerce technological shifts.
GPC
- Specialty retail distributor with moderate beta, focused on automotive and industrial parts.
- Concentrated on automotive and industrial parts distribution across multiple global markets.
- Exposure to automotive replacement and industrial parts markets, less focused on digital disruption.
PDD vs GPC Positioning
PDD pursues a diversified digital commerce model across multiple product categories, leveraging online marketing and transaction services. GPC maintains a concentrated approach in automotive and industrial parts distribution, supported by extensive geographic reach. Each approach offers distinct operational scopes and market exposures based on their segment focus.
Which has the best competitive advantage?
Both companies show very favorable moats with growing ROIC above WACC. PDD’s higher ROIC spread and rapid growth suggest a stronger competitive advantage in value creation and profitability durability.
Stock Comparison
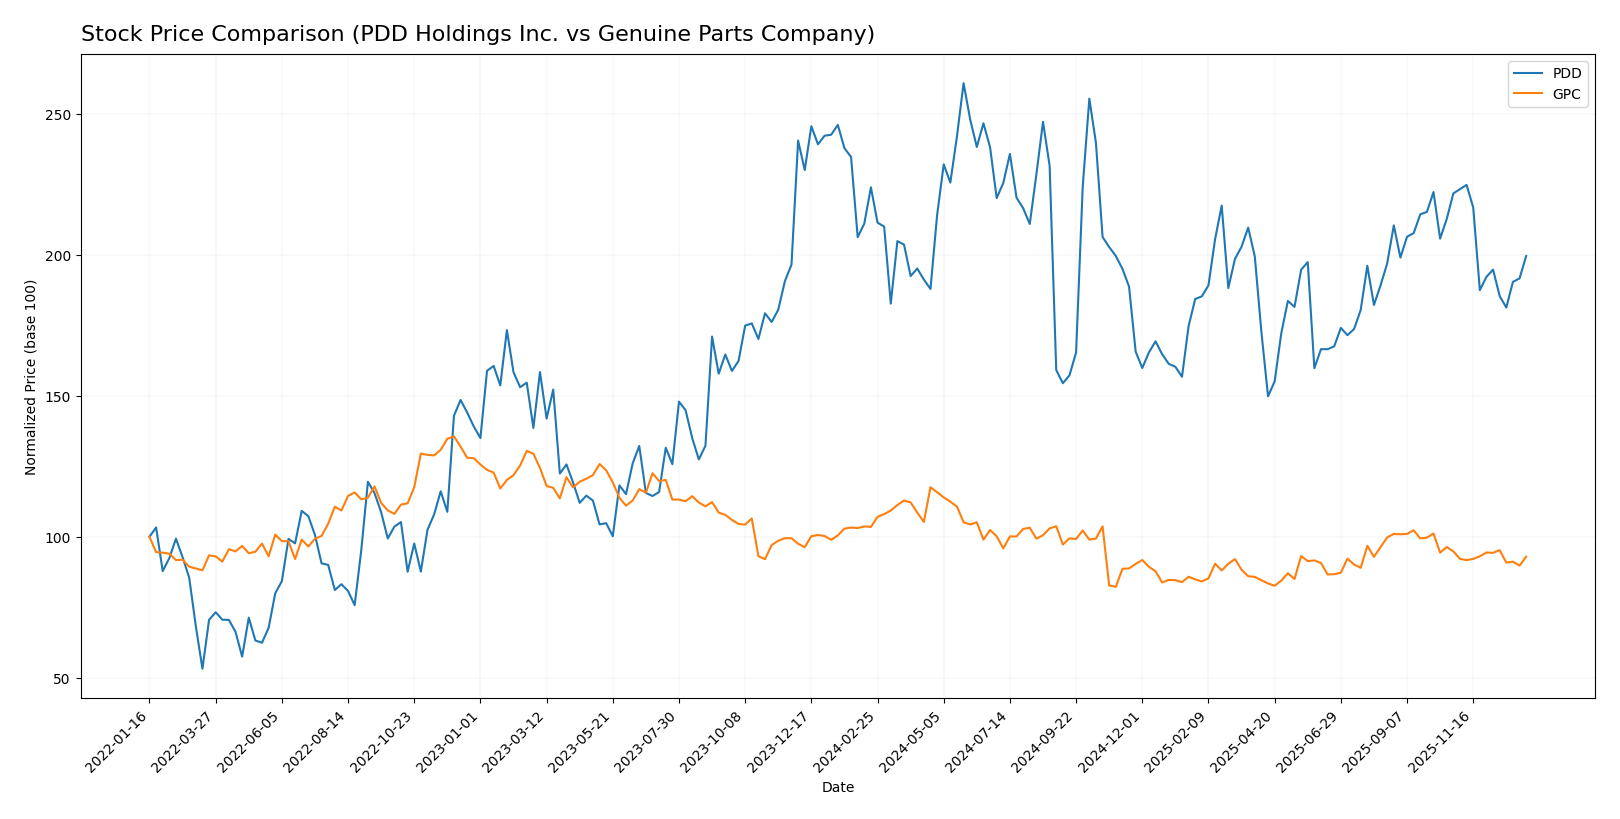
The stock price chart reveals notable bearish trends for both PDD Holdings Inc. and Genuine Parts Company over the past 12 months, with significant price declines and distinct trading volume dynamics.
Trend Analysis
PDD Holdings Inc. experienced a bearish trend with a -10.88% price change over the past 12 months, showing deceleration and a high volatility level of 15.64. The stock ranged between 90.5 and 157.57.
Genuine Parts Company also displayed a bearish trend with a -10.21% price change over the same period, but with accelerating decline and moderate volatility at 12.0. The price fluctuated between 113.61 and 162.39.
Comparing the two, PDD Holdings showed a slightly larger price decline than Genuine Parts Company, indicating a weaker market performance over the last year.
Target Prices
The current analyst consensus presents a balanced outlook on target prices for PDD Holdings Inc. and Genuine Parts Company.
| Company | Target High | Target Low | Consensus |
|---|---|---|---|
| PDD Holdings Inc. | 170 | 120 | 147.29 |
| Genuine Parts Company | 150 | 140 | 145.33 |
Analysts expect PDD’s stock to appreciate from its current price of 120.55 toward the consensus of 147.29, indicating moderate upside potential. Genuine Parts Company’s consensus target of 145.33 also suggests upside from its current price of 128.34, reflecting positive market sentiment.
Analyst Opinions Comparison
This section compares analysts’ ratings and grades for PDD Holdings Inc. and Genuine Parts Company:
Rating Comparison
PDD Rating
- Rating: A+, considered very favorable by analysts.
- Discounted Cash Flow Score: 4, indicating favorable valuation.
- ROE Score: 5, very favorable efficiency in generating profit from equity.
- ROA Score: 5, very favorable asset utilization.
- Debt To Equity Score: 5, very favorable low financial risk.
- Overall Score: 4, favorable overall financial standing.
GPC Rating
- Rating: B, also considered very favorable overall.
- Discounted Cash Flow Score: 4, indicating favorable valuation.
- ROE Score: 4, favorable efficiency in generating profit.
- ROA Score: 3, moderate asset utilization effectiveness.
- Debt To Equity Score: 1, very unfavorable high financial risk.
- Overall Score: 3, moderate overall financial standing.
Which one is the best rated?
Based strictly on the provided data, PDD holds a higher rating (A+) and better scores in ROE, ROA, debt to equity, and overall score compared to GPC, which has a lower rating (B) and weaker debt to equity and ROA scores.
Scores Comparison
The comparison of scores between PDD Holdings Inc. and Genuine Parts Company is as follows:
PDD Scores
- Altman Z-Score: 2.84, in the grey zone indicating moderate bankruptcy risk.
- Piotroski Score: 6, classified as average financial strength.
GPC Scores
- Altman Z-Score: 2.44, also in the grey zone with moderate bankruptcy risk.
- Piotroski Score: 6, classified as average financial strength.
Which company has the best scores?
Both PDD and GPC have Altman Z-Scores placing them in the grey zone, indicating moderate financial risk, and identical Piotroski Scores reflecting average financial strength. Based strictly on these scores, neither company demonstrates a clear advantage.
Grades Comparison
Here is a comparison of the recent grades assigned to PDD Holdings Inc. and Genuine Parts Company by reputable grading firms:
PDD Holdings Inc. Grades
The following table shows the latest grades from established financial institutions for PDD Holdings Inc.:
| Grading Company | Action | New Grade | Date |
|---|---|---|---|
| Freedom Capital Markets | Maintain | Buy | 2026-01-06 |
| B of A Securities | Maintain | Neutral | 2025-11-19 |
| B of A Securities | Maintain | Neutral | 2025-08-26 |
| Barclays | Maintain | Overweight | 2025-08-26 |
| Benchmark | Maintain | Buy | 2025-08-26 |
| New Street Research | Downgrade | Neutral | 2025-08-26 |
| China Renaissance | Downgrade | Hold | 2025-05-28 |
| Benchmark | Maintain | Buy | 2025-05-28 |
| JP Morgan | Maintain | Neutral | 2025-05-28 |
| Jefferies | Maintain | Buy | 2025-05-27 |
Overall, PDD’s grades show a predominance of Buy and Neutral ratings, with some recent downgrades to Hold and Neutral, indicating mixed but generally positive sentiment.
Genuine Parts Company Grades
The following table summarizes Genuine Parts Company’s grades from recognized rating agencies:
| Grading Company | Action | New Grade | Date |
|---|---|---|---|
| Goldman Sachs | Upgrade | Neutral | 2025-11-13 |
| JP Morgan | Maintain | Overweight | 2025-10-23 |
| Truist Securities | Maintain | Buy | 2025-10-22 |
| UBS | Maintain | Neutral | 2025-10-10 |
| Evercore ISI Group | Maintain | Outperform | 2025-10-01 |
| Evercore ISI Group | Maintain | Outperform | 2025-08-26 |
| Loop Capital | Maintain | Buy | 2025-07-24 |
| JP Morgan | Maintain | Overweight | 2025-07-23 |
| Truist Securities | Maintain | Buy | 2025-07-23 |
| UBS | Maintain | Neutral | 2025-07-23 |
Genuine Parts Company’s ratings are largely positive, with several Buy, Overweight, and Outperform grades, and a recent upgrade from Sell to Neutral by Goldman Sachs.
Which company has the best grades?
PDD Holdings Inc. holds a consensus Buy rating with a majority of Buy and Neutral grades, while Genuine Parts Company’s consensus is Hold, with a broader mix including Outperform and Overweight ratings. Investors may interpret PDD’s grades as signaling stronger near-term growth potential, whereas GPC’s ratings suggest more moderate expectations.
Strengths and Weaknesses
Below is a comparison of key strengths and weaknesses for PDD Holdings Inc. and Genuine Parts Company based on the most recent financial and operational data.
| Criterion | PDD Holdings Inc. | Genuine Parts Company |
|---|---|---|
| Diversification | Focused on online marketing and transaction services with growing revenue streams in these segments. | Balanced revenue from automotive and industrial parts, providing sector diversification. |
| Profitability | High net margin (28.55%) and ROE (35.89%) indicate strong profitability. | Lower net margin (3.85%) but solid ROE (20.84%), suggesting moderate profitability. |
| Innovation | Strong innovation reflected in high ROIC (28.35%) and rapid ROIC growth (333%), showing efficient capital use and expansion. | Moderate innovation with neutral ROIC (9.82%) growth; steady but less dynamic. |
| Global presence | Predominantly focused on Chinese market with rapid online service growth. | Established global footprint in automotive and industrial distribution. |
| Market Share | Rapidly increasing market share in e-commerce and online marketing sectors in China. | Stable market share in automotive parts distribution with a mature customer base. |
Key takeaways: PDD exhibits robust profitability and innovation with rapid growth in online services, representing a strong growth play. Genuine Parts Company offers diversification and steady profitability, appealing to investors seeking stability and global presence. Both have durable competitive advantages but differ in growth dynamics and market focus.
Risk Analysis
Below is a comparison of key risks for PDD Holdings Inc. and Genuine Parts Company as of 2024, helping investors understand potential vulnerabilities.
| Metric | PDD Holdings Inc. | Genuine Parts Company |
|---|---|---|
| Market Risk | Extremely low beta (0.006) indicates minimal volatility | Moderate beta (0.753) suggests average market sensitivity |
| Debt level | Very low debt-to-equity (0.03), low debt-to-assets (2.1%) | High debt-to-equity (1.32), but moderate debt-to-assets (29.78%) |
| Regulatory Risk | Moderate, operating mainly in China and Ireland with evolving e-commerce regulations | Moderate, US and international exposure with complex automotive regulations |
| Operational Risk | Focus on digital economy and e-commerce, risks tied to platform scalability and competition | Broad distribution network and manufacturing services, risks from supply chain disruptions |
| Environmental Risk | Limited direct impact but growing e-commerce packaging concerns | Exposure to industrial and automotive sectors with environmental compliance needs |
| Geopolitical Risk | High, due to reliance on China market and US-China trade tensions | Moderate, diversified global presence reduces single-country risk |
PDD’s low market risk and debt level are strengths, but geopolitical tensions and regulatory uncertainty in China are key risks. Genuine Parts faces higher financial leverage and operational risks but benefits from diversification. Investors should weigh the significant geopolitical risk for PDD and financial leverage risk for Genuine Parts carefully.
Which Stock to Choose?
PDD Holdings Inc. shows strong income growth with a 59.04% revenue increase in 2024 and favorable profitability ratios, including a 28.55% net margin and 35.89% ROE. Its low debt levels and very favorable rating (A+) reflect solid financial health and a durable competitive advantage.
Genuine Parts Company exhibits modest income growth of 1.71% in 2024 with mixed profitability metrics, such as a 3.85% net margin and 20.84% ROE. Higher debt levels and a slightly favorable rating (B) indicate moderate financial risk but stable operations with a durable competitive advantage.
Investors seeking high growth and robust profitability might view PDD as more appealing due to its very favorable rating and strong income statement. Conversely, those valuing stability and moderate growth could find GPC suitable, given its solid competitive moat and slightly favorable financial ratios.
Disclaimer: Investment carries a risk of loss of initial capital. The past performance is not a reliable indicator of future results. Be sure to understand risks before making an investment decision.
Go Further
I encourage you to read the complete analyses of PDD Holdings Inc. and Genuine Parts Company to enhance your investment decisions: