Home > Comparison > Technology > WIT vs G
The strategic rivalry between Wipro Limited and Genpact Limited shapes the evolving landscape of the global technology sector. Wipro operates as a diversified IT services powerhouse with extensive offerings across consulting, infrastructure, and product segments. Genpact focuses on business process outsourcing and IT services with a specialization in finance and supply chain solutions. This analysis will identify which company’s model offers superior risk-adjusted returns for a diversified portfolio amid shifting industry dynamics.
Table of contents
Companies Overview
Wipro Limited and Genpact Limited stand as prominent players in the global IT services market, each commanding significant attention.
Wipro Limited: Global IT Services Powerhouse
Wipro Limited excels as a diversified IT and consulting firm with a revenue engine driven by IT services, IT products, and government enterprise solutions. Its core strength lies in delivering digital advisory, application development, cloud infrastructure, and business process services. In 2026, Wipro emphasizes expanding cloud and analytics capabilities to deepen its digital transformation leadership.
Genpact Limited: Business Process and IT Innovator
Genpact Limited operates primarily as a business process outsourcing and IT services provider spanning multiple sectors such as banking, healthcare, and manufacturing. It generates revenue through finance, accounting, procurement, and digital transformation services. The company’s 2026 strategy focuses on enhancing ESG services and analytics to support sustainable business operations and client value creation.
Strategic Collision: Similarities & Divergences
Both companies compete in IT services but diverge in philosophy: Wipro adopts a broad, integrated IT-product-service model, while Genpact specializes in business process outsourcing with a strong ESG overlay. Their battleground is digital transformation and analytics, targeting enterprise efficiency and sustainability. Wipro offers a larger-scale, diversified tech platform, whereas Genpact presents a focused, service-driven growth profile.
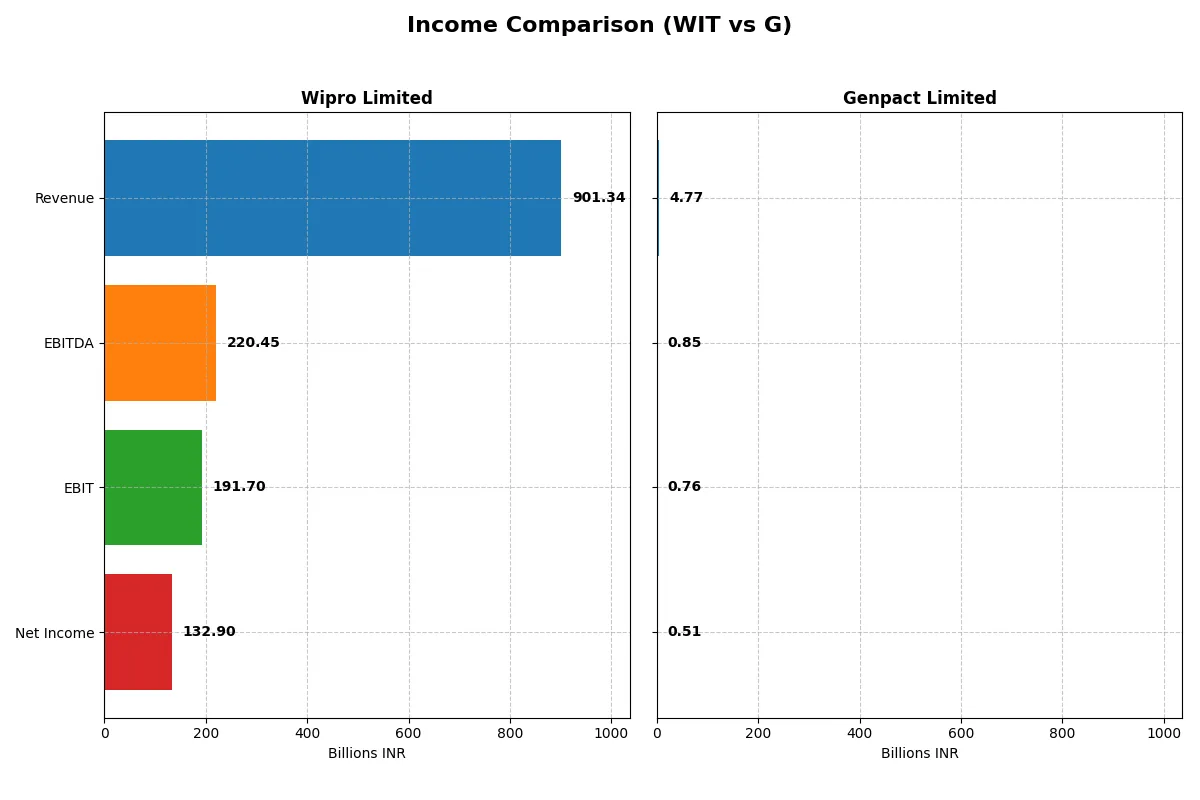
Income Statement Comparison
This data dissects the core profitability and scalability of both corporate engines to reveal who dominates the bottom line:
| Metric | Wipro Limited (WIT) | Genpact Limited (G) |
|---|---|---|
| Revenue | 901.3B INR | 4.77B USD |
| Cost of Revenue | 625.1B INR | 3.08B USD |
| Operating Expenses | 122.7B INR | 988M USD |
| Gross Profit | 276.3B INR | 1.69B USD |
| EBITDA | 220.5B INR | 853M USD |
| EBIT | 191.7B INR | 756M USD |
| Interest Expense | 14.9B INR | 79.5M USD |
| Net Income | 132.9B INR | 514M USD |
| EPS | 12.56 INR | 2.88 USD |
| Fiscal Year | 2025 | 2024 |
Income Statement Analysis: The Bottom-Line Duel
This income statement comparison reveals which company delivers superior operational efficiency and bottom-line performance over recent years.
Wipro Limited Analysis
Wipro’s revenue remained stable near 900B INR between 2024 and 2025, while net income rose sharply by 20%. Gross margin holds firm at 30.65%, and net margin expanded to 14.74%, signaling improving profitability. The 19% EBIT growth highlights strong operational leverage and disciplined cost management in its latest fiscal year.
Genpact Limited Analysis
Genpact grew revenue steadily by 6.5% to $4.77B in 2024, with net income retreating 19% despite a solid 35.45% gross margin. EBIT margin stays healthy at 15.87%, but net margin contraction to 10.78% reflects margin pressure. The company shows momentum in top-line growth but faces challenges sustaining bottom-line profitability.
Margin Strength vs. Growth Stability
Wipro commands higher net and EBIT margins with consistent earnings growth, demonstrating superior efficiency. Genpact delivers robust revenue gains but struggles with margin volatility and recent net income decline. For investors prioritizing profitability and operational discipline, Wipro’s profile appears more attractive given its resilient margin expansion and earnings momentum.
Financial Ratios Comparison
These vital ratios act as a diagnostic tool to expose the underlying fiscal health, valuation premiums, and capital efficiency of the companies compared:
| Ratios | Wipro Limited (WIT) | Genpact Limited (G) |
|---|---|---|
| ROE | 16.0% | 21.5% |
| ROIC | 10.5% | 13.0% |
| P/E | 20.6 | 14.9 |
| P/B | 3.30 | 3.21 |
| Current Ratio | 2.72 | 2.16 |
| Quick Ratio | 2.71 | 2.16 |
| D/E | 0.23 | 0.60 |
| Debt-to-Assets | 14.9% | 29.0% |
| Interest Coverage | 10.3 | 8.8 |
| Asset Turnover | 0.70 | 0.96 |
| Fixed Asset Turnover | 8.48 | 11.7 |
| Payout ratio | 47.2% | 21.1% |
| Dividend yield | 2.29% | 1.42% |
| Fiscal Year | 2025 | 2024 |
Efficiency & Valuation Duel: The Vital Signs
Financial ratios act as a company’s DNA, uncovering hidden risks and highlighting operational strengths critical for investment decisions.
Wipro Limited
Wipro demonstrates solid profitability with a 16.04% ROE and favorable 14.74% net margin, reflecting efficient operations. Its valuation is moderate, with a neutral P/E of 20.6 but an unfavorable P/B of 3.3, suggesting some premium pricing. The 2.29% dividend yield rewards shareholders, signaling balanced capital returns.
Genpact Limited
Genpact posts a stronger 21.5% ROE and a healthy 10.78% net margin, indicating robust profitability. Its P/E of 14.92 is attractive, implying undervaluation relative to peers. The lower 1.42% dividend yield is neutral, with a modest reinvestment strategy. Debt levels are higher but manageable, maintaining operational flexibility.
Balanced Profitability vs. Valuation Appeal
Wipro offers a very favorable operational profile and steady shareholder returns but trades at a slightly higher valuation. Genpact presents a compelling valuation with excellent profitability but carries more debt risk. Investors seeking stable income may favor Wipro; those prioritizing value and growth might lean toward Genpact.
Which one offers the Superior Shareholder Reward?
I see Wipro Limited (WIT) pays a 2.29% dividend yield with a high 47.2% payout ratio, well-covered by its strong free cash flow (FCF) of 91%. WIT also executes moderate buybacks, balancing income and capital return sustainably. Genpact Limited (G) yields 1.42%, with a 21.1% payout ratio and solid FCF coverage at 86%. However, G’s buyback program is less aggressive. Historically, WIT’s higher yield and payout combined with consistent buybacks deliver a more attractive total return profile in 2026. I favor Wipro for superior shareholder reward and sustainable capital allocation.
Comparative Score Analysis: The Strategic Profile
The radar chart reveals the fundamental DNA and trade-offs of both Wipro Limited and Genpact Limited, highlighting core financial strengths and valuation nuances:
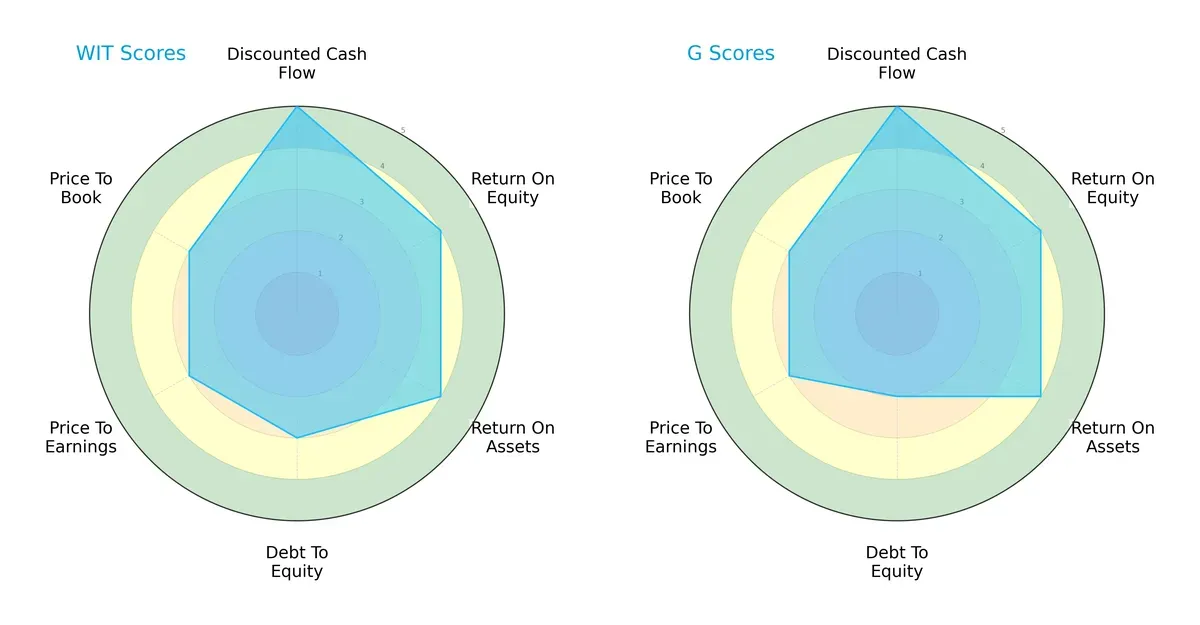
Both firms excel in discounted cash flow (DCF) and profitability metrics like ROE and ROA, scoring a robust 5 and 4 respectively. Wipro shows a more moderate debt-to-equity score (3) compared to Genpact’s lower 2, indicating Genpact maintains a stronger balance sheet leverage position. Valuation scores (PE and PB) are identical, suggesting similar market pricing. Overall, Wipro presents a balanced profile with steady leverage, while Genpact leverages its stronger debt management as a strategic edge.
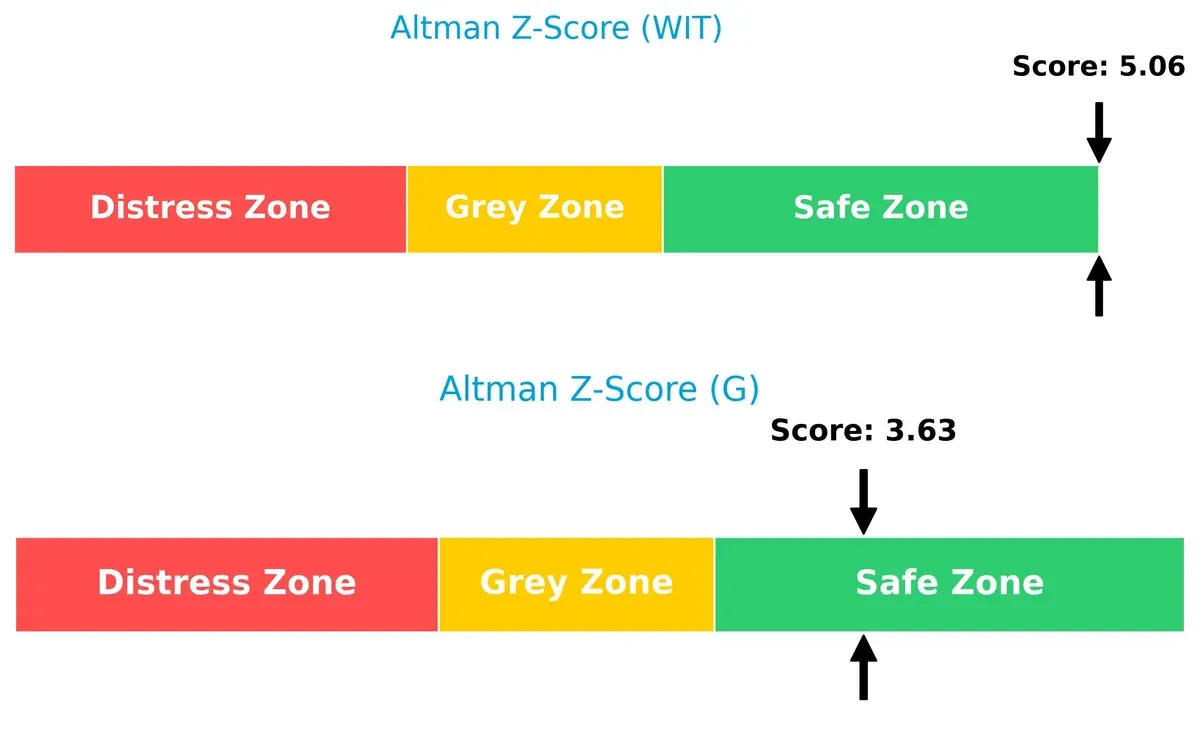
Bankruptcy Risk: Solvency Showdown
Wipro’s Altman Z-Score of 5.06 versus Genpact’s 3.63 places both firms firmly in the safe zone. This margin suggests Wipro holds a more resilient solvency position against economic downturns:
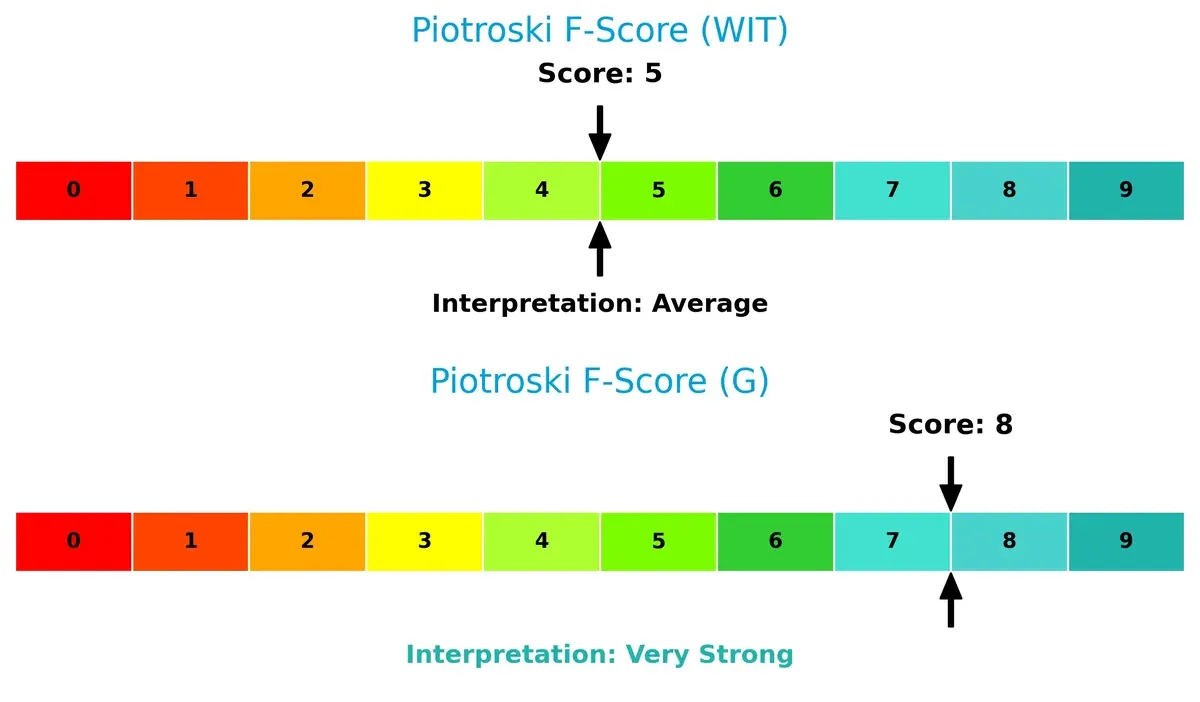
Financial Health: Quality of Operations
Genpact’s Piotroski F-Score of 8 significantly outpaces Wipro’s 5, signaling superior internal financial health and operational quality. Wipro’s average score flags potential red areas in profitability or efficiency metrics worth monitoring:
How are the two companies positioned?
This section dissects Wipro and Genpact’s operational DNA by comparing their revenue distribution and internal strengths and weaknesses. The goal is to confront their economic moats and reveal which model offers the most resilient, sustainable competitive advantage today.
Revenue Segmentation: The Strategic Mix
This visual comparison dissects how Wipro Limited and Genpact Limited diversify their income streams and where their primary sector bets lie:
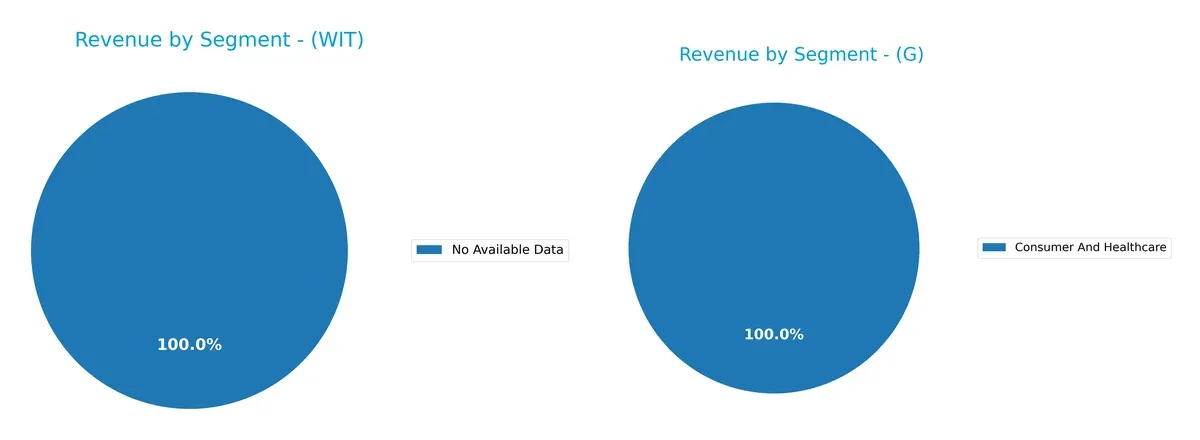
Genpact leans heavily on its Consumer and Healthcare segment, generating $1.69B in 2024, anchoring its revenue mix. Wipro’s segmentation data is unavailable, preventing direct diversification comparison. Genpact’s focus suggests a strategic bet on healthcare’s growth and recurring demand, but it also heightens concentration risk without broader segment balance. This reliance could impact resilience if sector dynamics shift abruptly.
Strengths and Weaknesses Comparison
This table compares the Strengths and Weaknesses of Wipro Limited and Genpact Limited:
Wipro Limited Strengths
- Strong profitability with 14.74% net margin
- Favorable ROE at 16.04%
- Low debt-to-assets ratio at 14.93%
- High current and quick ratios above 2.7
- Efficient fixed asset turnover at 8.48
- Dividend yield at 2.29%
Genpact Limited Strengths
- Robust ROE of 21.5%
- Higher ROIC at 12.96% than Wipro
- Diverse revenue streams across multiple sectors
- Global presence with sizable Americas, Europe, Asia revenues
- Favorable fixed asset turnover of 11.66
- Favorable PE ratio at 14.92
Wipro Limited Weaknesses
- Unfavorable PB ratio at 3.3 implies stock may be overvalued
- Neutral asset turnover at 0.7 below sector leaders
- PE ratio neutral at 20.6 limits valuation upside
- Limited product and geographic segmentation data available
Genpact Limited Weaknesses
- Higher debt-to-equity ratio at 0.6 signals more leverage risk
- PB ratio slightly unfavorable at 3.21
- Dividend yield lower at 1.42%, neutral status
- Neutral asset turnover at 0.96 suggests moderate asset use efficiency
Wipro shows broadly favorable financial health and conservative leverage, supporting stable profitability. Genpact demonstrates stronger returns and broader diversification but carries more leverage risk. Each company’s profile suggests different strategic priorities in balancing growth, risk, and operational efficiency.
The Moat Duel: Analyzing Competitive Defensibility
A structural moat is the key barrier that shields long-term profits from competitive erosion, securing sustainable economic returns for firms like these:
Wipro Limited: Cost Leadership and Diversified IT Services
Wipro’s moat stems from a cost advantage and broad service portfolio, supporting solid margins and 14.7% net margin in 2025. However, declining ROIC signals rising competitive pressures in 2026.
Genpact Limited: Operational Excellence and Growing ROIC
Genpact leverages process innovation and strong client relationships, reflected in a 6% ROIC premium over WACC and a 35.5% gross margin. Its rising profitability underpins a durable moat heading into 2026.
Cost Efficiency vs. Operational Excellence: Which Moat Holds Stronger?
Genpact’s growing ROIC and margin expansion denote a deeper, more durable moat than Wipro’s eroding returns. Genpact is better positioned to defend market share amid intensifying competition.
Which stock offers better returns?
The past year shows divergent price movements: Wipro Limited declines steadily, while Genpact Limited posts a robust gain despite recent softness.
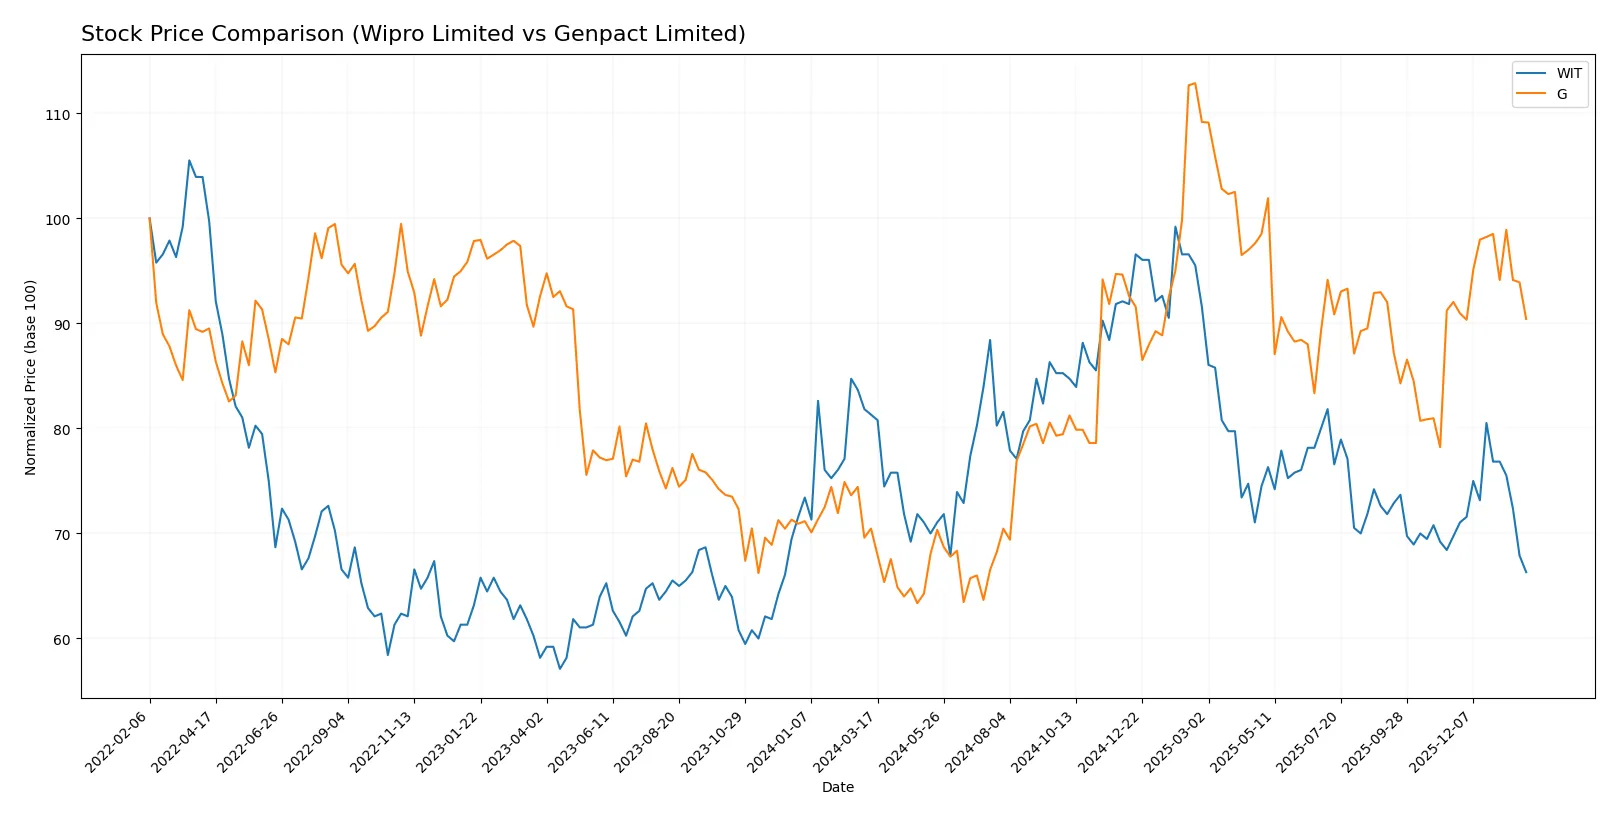
Trend Comparison
Wipro Limited’s stock fell 18.45% over the past 12 months, marking a clear bearish trend with decelerating losses and a low volatility of 0.31.
Genpact Limited gained 28.31% in the same period, a bullish trend despite deceleration, accompanied by higher volatility at 6.08.
Genpact outperformed Wipro significantly, delivering the highest market return while both stocks showed deceleration in their price momentum.
Target Prices
Analysts set a clear target consensus for Wipro Limited and Genpact Limited, reflecting measured optimism.
| Company | Target Low | Target High | Consensus |
|---|---|---|---|
| Wipro Limited | 7.0 | 7.7 | 7.35 |
| Genpact Limited | 50 | 53 | 51.5 |
The consensus targets for both companies stand well above current prices, suggesting upside potential. Wipro trades at 2.52 versus a 7.35 consensus, while Genpact’s 44.1 price lags its 51.5 target.

Don’t Let Luck Decide Your Entry Point
Optimize your entry points with our advanced ProRealTime indicators. You’ll get efficient buy signals with precise price targets for maximum performance. Start outperforming now!
How do institutions grade them?
Wipro Limited Grades
The following table summarizes recent grade updates from major institutions for Wipro Limited.
| Grading Company | Action | New Grade | Date |
|---|---|---|---|
| UBS | Upgrade | Neutral | 2025-01-02 |
| Wedbush | Maintain | Underperform | 2024-01-16 |
| JP Morgan | Maintain | Underweight | 2023-05-24 |
| Bernstein | Downgrade | Underperform | 2023-03-22 |
| Bernstein | Downgrade | Underperform | 2023-03-21 |
| Goldman Sachs | Upgrade | Buy | 2022-09-13 |
| Goldman Sachs | Upgrade | Buy | 2022-09-12 |
| Morgan Stanley | Downgrade | Underweight | 2022-07-14 |
| Morgan Stanley | Downgrade | Underweight | 2022-07-13 |
| Macquarie | Upgrade | Outperform | 2022-06-02 |
Genpact Limited Grades
This table shows the latest grade assessments from reputable firms for Genpact Limited.
| Grading Company | Action | New Grade | Date |
|---|---|---|---|
| JP Morgan | Maintain | Neutral | 2025-08-20 |
| Needham | Maintain | Buy | 2025-08-08 |
| Mizuho | Maintain | Neutral | 2025-07-01 |
| Needham | Maintain | Buy | 2025-06-30 |
| TD Cowen | Maintain | Buy | 2025-06-27 |
| Needham | Maintain | Buy | 2025-05-08 |
| Baird | Maintain | Neutral | 2025-05-08 |
| Mizuho | Maintain | Neutral | 2025-02-10 |
| Needham | Maintain | Buy | 2025-02-07 |
| Jefferies | Upgrade | Buy | 2025-01-21 |
Which company has the best grades?
Genpact Limited consistently receives Buy and Neutral ratings, indicating stable confidence from analysts. Wipro Limited’s grades show more variability with recent Neutral and Underperform ratings, suggesting higher uncertainty. Investors may interpret Genpact’s steadier grades as a sign of more reliable institutional support.
Risks specific to each company
The following categories identify the critical pressure points and systemic threats facing both firms in the 2026 market environment:
1. Market & Competition
Wipro Limited
- Faces intense competition in IT services across diverse sectors, requiring constant innovation.
Genpact Limited
- Operates in BPO and IT services with growing competition in digital transformation and ESG advisory.
2. Capital Structure & Debt
Wipro Limited
- Maintains a low debt-to-equity ratio (0.23), indicating conservative leverage and financial stability.
Genpact Limited
- Higher debt-to-equity ratio (0.6) suggests moderate financial risk, requiring careful debt management.
3. Stock Volatility
Wipro Limited
- Exhibits low beta (0.555), implying lower stock volatility and defensive characteristics.
Genpact Limited
- Slightly higher beta (0.755), indicating moderate stock price fluctuations compared to Wipro.
4. Regulatory & Legal
Wipro Limited
- Subject to Indian and global IT regulations, including data privacy and government contracting scrutiny.
Genpact Limited
- Faces multi-jurisdictional regulatory challenges, including compliance in financial services and ESG reporting.
5. Supply Chain & Operations
Wipro Limited
- Complex global operations with exposure to disruptions in IT product supply chains.
Genpact Limited
- Relies on global outsourcing networks sensitive to geopolitical and operational disruptions.
6. ESG & Climate Transition
Wipro Limited
- Increasing pressure to meet sustainability targets within Indian and international markets.
Genpact Limited
- Provides ESG advisory, but must manage own transition risks amid rising client expectations.
7. Geopolitical Exposure
Wipro Limited
- Predominantly India-based with exposure to regional political and economic volatility.
Genpact Limited
- Headquartered in Bermuda with broad international footprint, facing diverse geopolitical risks.
Which company shows a better risk-adjusted profile?
Wipro’s most impactful risk lies in fierce market competition requiring continuous innovation. Genpact’s greatest risk stems from its elevated debt level, increasing financial vulnerability. I see Wipro as having a better risk-adjusted profile due to its conservative leverage and lower stock volatility. Notably, Wipro’s debt-to-equity ratio of 0.23 contrasts sharply with Genpact’s 0.6, underscoring greater financial prudence.
Final Verdict: Which stock to choose?
Wipro Limited’s superpower lies in its robust capital efficiency and consistent value creation, delivering solid returns above its cost of capital. Its key point of vigilance is a slightly declining profitability trend, which calls for monitoring. This stock suits portfolios targeting steady, long-term growth with moderate risk tolerance.
Genpact Limited commands a strategic moat through its expanding return on invested capital and growing profitability, reflecting a durable competitive advantage. Compared to Wipro, it offers a stronger growth trajectory but with a bit more leverage risk. It fits well within portfolios seeking growth at a reasonable price with an appetite for measured volatility.
If you prioritize stable capital efficiency and value creation, Wipro appears the compelling choice due to its proven ability to generate cash and maintain financial resilience. However, if you seek accelerating profitability and a durable moat with higher growth potential, Genpact offers better upside, albeit with somewhat elevated leverage concerns. Both present analytical scenarios depending on your investment profile.
Disclaimer: Investment carries a risk of loss of initial capital. The past performance is not a reliable indicator of future results. Be sure to understand risks before making an investment decision.
Go Further
I encourage you to read the complete analyses of Wipro Limited and Genpact Limited to enhance your investment decisions: