Leidos Holdings, Inc. (LDOS) and Genpact Limited (G) both operate in the dynamic Information Technology Services sector, yet they serve distinct markets with overlapping innovation strategies. Leidos focuses heavily on defense, intelligence, and health sectors, while Genpact excels in business process outsourcing and digital transformation across diverse industries. This comparison aims to reveal which company offers the most promising investment opportunity for traders and investors alike. Let’s explore their potential together.
Table of contents
Companies Overview
I will begin the comparison between Leidos Holdings, Inc. and Genpact Limited by providing an overview of these two companies and their main differences.
Leidos Holdings, Inc. Overview
Leidos Holdings, Inc. specializes in providing technology services and solutions primarily in defense, intelligence, civil, and health sectors. The company operates through three segments: Defense Solutions, Civil, and Health. It serves government agencies, including the U.S. Department of Defense and NASA, as well as commercial customers, focusing on national security, IT modernization, and health-related services. Founded in 1969 and headquartered in Reston, Virginia, Leidos has a market cap of approximately 24.4B USD.
Genpact Limited Overview
Genpact Limited offers business process outsourcing and IT services across multiple industries including banking, consumer goods, and manufacturing. Operating through segments such as Banking, Capital Markets, and Insurance, it provides CFO advisory, ESG services, finance and accounting, supply chain, and IT transformation services. Founded in 1997 and based in Hamilton, Bermuda, Genpact employs around 145K people and has a market cap near 8.3B USD.
Key similarities and differences
Both companies operate in the information technology services sector and serve a diverse set of industries globally. Leidos focuses heavily on defense, intelligence, and government-related contracts, emphasizing national security and health solutions. In contrast, Genpact concentrates on business process outsourcing and digital transformation across financial, consumer, and manufacturing sectors. Leidos has a smaller workforce but a larger market cap, reflecting its specialized government contracting niche, whereas Genpact’s broader service offerings support a much larger employee base.
Income Statement Comparison
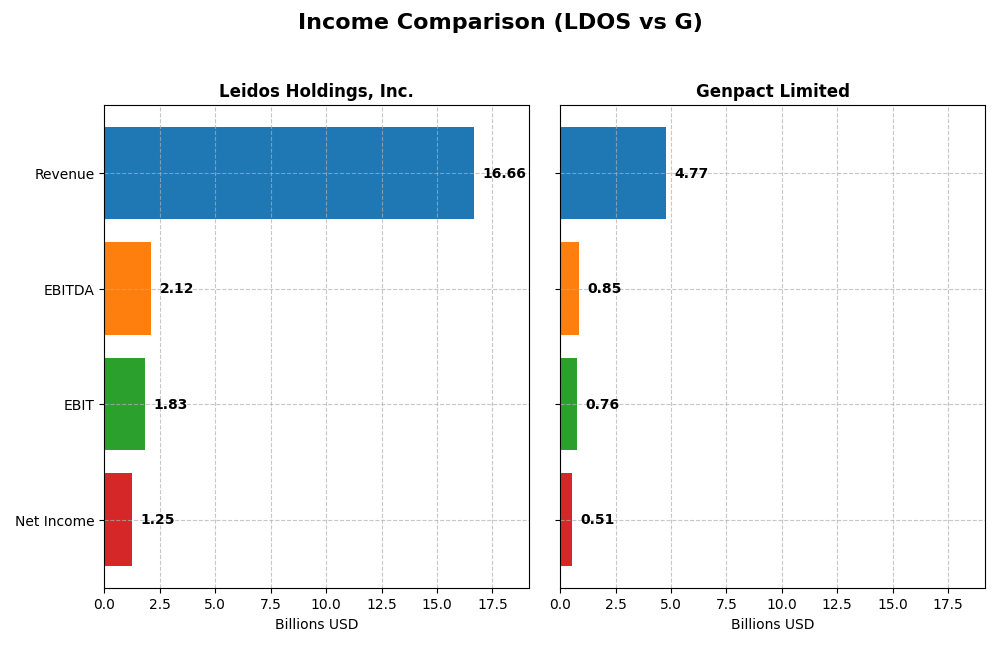
This table compares key income statement metrics for Leidos Holdings, Inc. and Genpact Limited for their most recent fiscal year, providing a snapshot of their financial performance.
| Metric | Leidos Holdings, Inc. | Genpact Limited |
|---|---|---|
| Market Cap | 24.4B | 8.3B |
| Revenue | 16.7B | 4.8B |
| EBITDA | 2.12B | 853M |
| EBIT | 1.83B | 756M |
| Net Income | 1.25B | 514M |
| EPS | 9.36 | 2.88 |
| Fiscal Year | 2024 | 2024 |
Income Statement Interpretations
Leidos Holdings, Inc.
Leidos Holdings showed steady revenue growth from $12.3B in 2020 to $16.7B in 2024, nearly a 36% increase. Net income doubled from $628M to $1.25B over the period, with net margin improving to 7.53%. The 2024 fiscal year saw strong EBIT growth near 198%, signaling margin expansion and operational efficiency gains.
Genpact Limited
Genpact’s revenue rose from $3.7B in 2020 to $4.77B in 2024, a 28.5% increase. Net income grew 66.6% overall but declined in 2024 to $514M from $631M in 2023, causing a net margin drop to 10.78%. Despite favorable gross and EBIT margins, the recent decline in net margin and EPS marks a caution point.
Which one has the stronger fundamentals?
Both companies exhibit favorable income statement fundamentals with revenue and net income growth. Leidos demonstrates stronger margin improvements, especially in EBIT and net margin, supported by robust EPS growth. Genpact maintains higher gross and net margins but faced a recent net margin and EPS decline. Overall, Leidos’s margin expansion and income growth over the latest year suggest comparatively stronger fundamentals.
Financial Ratios Comparison
Below is a comparison of key financial ratios for Leidos Holdings, Inc. (LDOS) and Genpact Limited (G) based on their most recent fiscal year data.
| Ratios | Leidos Holdings, Inc. (LDOS) FY 2024 | Genpact Limited (G) FY 2024 |
|---|---|---|
| ROE | 28.4% | 21.5% |
| ROIC | 13.9% | 13.0% |
| P/E | 15.7 | 14.9 |
| P/B | 4.47 | 3.21 |
| Current Ratio | 1.21 | 2.16 |
| Quick Ratio | 1.13 | 2.16 |
| D/E (Debt-to-Equity) | 1.20 | 0.60 |
| Debt-to-Assets | 40.4% | 28.98% |
| Interest Coverage | 9.47 | 8.83 |
| Asset Turnover | 1.27 | 0.96 |
| Fixed Asset Turnover | 10.74 | 11.66 |
| Payout Ratio | 16.6% | 21.1% |
| Dividend Yield | 1.05% | 1.42% |
Interpretation of the Ratios
Leidos Holdings, Inc.
Leidos shows a mix of strong and neutral ratios, with a favorable 28.42% ROE and 13.85% ROIC indicating efficient capital use. However, a high PB ratio of 4.47 and a debt-to-equity ratio of 1.2 suggest some concerns on valuation and leverage. The company pays dividends with a 1.05% yield, reflecting moderate shareholder returns without excessive risk.
Genpact Limited
Genpact presents generally favorable ratios, including a 10.78% net margin and a solid 21.5% ROE. Its low debt-to-assets ratio of 28.98% and strong liquidity ratios above 2.0 signal financial stability. Genpact also pays dividends with a 1.42% yield, supporting shareholder returns alongside a reasonable PE of 14.92 and manageable leverage.
Which one has the best ratios?
Genpact holds a more favorable overall ratio profile, with 71.43% of ratios rated favorable compared to Leidos’ 50%. Its stronger liquidity, lower leverage, and better valuation metrics outweigh Leidos’ higher ROE and capital returns, though both companies maintain dividend payouts with moderate yields.
Strategic Positioning
This section compares the strategic positioning of Leidos Holdings, Inc. and Genpact Limited, focusing on market position, key segments, and exposure to technological disruption:
Leidos Holdings, Inc.
- Leading defense and civil IT services provider with significant U.S. government contracts, facing moderate competitive pressure.
- Diverse segments: Defense Solutions, Civil, and Health, driven by national security and federal health solutions.
- Exposed to technological disruption through cybersecurity, cloud computing, and digital transformation in defense and civil markets.
Genpact Limited
- Global business process outsourcing and IT services provider serving financial, healthcare, and manufacturing sectors amid competitive markets.
- Concentrated segments: Banking, Consumer Goods, and High Tech, driven by finance, healthcare, and digital transformation.
- Faces disruption in digital solutions, analytics, and ESG services within BPO and IT services sectors.
Leidos vs Genpact Positioning
Leidos adopts a diversified approach across defense, civil, and health markets with strong U.S. government ties, while Genpact concentrates on business process outsourcing and IT services in financial and healthcare sectors. Leidos benefits from national security contracts; Genpact leverages digital and ESG transformation.
Which has the best competitive advantage?
Both companies demonstrate a very favorable moat with growing ROIC trends and efficient capital use. Leidos shows a higher ROIC premium over WACC, indicating a slightly stronger competitive advantage in value creation and profitability.
Stock Comparison
The stock price trajectories of Leidos Holdings, Inc. (LDOS) and Genpact Limited (G) over the past 12 months reveal significant bullish momentum, with LDOS showing higher volatility and deceleration, while G displays accelerating gains and stronger recent buyer dominance.

Trend Analysis
Leidos Holdings, Inc. (LDOS) experienced a robust 51.37% price increase over the past year, indicating a bullish trend with deceleration. The stock’s volatility is notable with a 20.61 std deviation, reaching a high of 198.42 and a low of 124.91.
Genpact Limited (G) posted a 30.69% price rise over the same period, also bullish but with accelerating momentum. Volatility is moderate at a 6.15 std deviation, with highs at 55.05 and lows at 30.9. Recent gains of 24.35% reflect strong upward slope and buyer dominance.
Comparing both, LDOS delivered the highest overall market performance in price appreciation, though Genpact’s recent accelerating trend and buyer dominance mark a dynamic trading environment.
Target Prices
The analyst consensus for target prices indicates positive potential upside for both Leidos Holdings, Inc. and Genpact Limited.
| Company | Target High | Target Low | Consensus |
|---|---|---|---|
| Leidos Holdings, Inc. | 230 | 216 | 222.2 |
| Genpact Limited | 53 | 50 | 51.5 |
Overall, analysts expect Leidos Holdings to trade significantly above its current price of $190.82, while Genpact’s consensus target of $51.5 also suggests upside from the current $47.44 price level.
Analyst Opinions Comparison
This section compares analysts’ ratings and grades for Leidos Holdings, Inc. (LDOS) and Genpact Limited (G):
Rating Comparison
LDOS Rating
- Rating: A-, considered Very Favorable by analysts.
- Discounted Cash Flow Score: 5, indicating a very favorable valuation based on future cash flows.
- ROE Score: 5, showing excellent efficiency generating profit from shareholders’ equity.
- ROA Score: 4, favorable use of assets to generate earnings.
- Debt To Equity Score: 1, considered very unfavorable due to higher financial risk from debt.
- Overall Score: 4, reflecting a favorable overall financial standing.
G Rating
- Rating: A-, also rated Very Favorable by analysts.
- Discounted Cash Flow Score: 5, similarly very favorable for valuation metrics.
- ROE Score: 4, favorable but slightly lower efficiency compared to LDOS.
- ROA Score: 4, equally favorable asset utilization.
- Debt To Equity Score: 2, moderate financial risk with comparatively better balance sheet.
- Overall Score: 4, also indicating a favorable overall financial position.
Which one is the best rated?
Both LDOS and G share an identical overall rating of A- and an overall score of 4, reflecting favorable assessments. LDOS outperforms G in ROE but carries higher debt risk, while G shows a slightly better debt-to-equity score but a lower ROE.
Scores Comparison
The comparison of Leidos Holdings, Inc. and Genpact Limited scores is as follows:
Leidos Holdings, Inc. Scores
- Altman Z-Score: 4.15, indicating a safe zone status.
- Piotroski Score: 8, reflecting very strong financial health.
Genpact Limited Scores
- Altman Z-Score: 3.68, indicating a safe zone status.
- Piotroski Score: 8, reflecting very strong financial health.
Which company has the best scores?
Both Leidos and Genpact have Altman Z-Scores within the safe zone and identical Piotroski Scores of 8, indicating very strong financial health for both companies based on the provided data.
Grades Comparison
Here is a comparison of the latest available grades from recognized grading companies for the two companies:
Leidos Holdings, Inc. Grades
The table below shows recent grades assigned to Leidos Holdings, Inc. by reputable financial institutions.
| Grading Company | Action | New Grade | Date |
|---|---|---|---|
| Citigroup | Maintain | Buy | 2026-01-13 |
| Stifel | Downgrade | Hold | 2026-01-08 |
| B of A Securities | Maintain | Buy | 2025-11-07 |
| Truist Securities | Maintain | Buy | 2025-11-05 |
| UBS | Maintain | Neutral | 2025-11-05 |
| Cantor Fitzgerald | Maintain | Overweight | 2025-10-31 |
| Argus Research | Maintain | Buy | 2025-09-24 |
| B of A Securities | Maintain | Buy | 2025-09-04 |
| RBC Capital | Upgrade | Outperform | 2025-09-04 |
| UBS | Maintain | Neutral | 2025-08-07 |
Leidos exhibits a predominantly positive grading trend with multiple Buy and Outperform ratings, though some Neutral and Hold grades indicate moderate caution.
Genpact Limited Grades
The table below presents recent grades given to Genpact Limited by established grading firms.
| Grading Company | Action | New Grade | Date |
|---|---|---|---|
| JP Morgan | Maintain | Neutral | 2025-08-20 |
| Needham | Maintain | Buy | 2025-08-08 |
| Mizuho | Maintain | Neutral | 2025-07-01 |
| Needham | Maintain | Buy | 2025-06-30 |
| TD Cowen | Maintain | Buy | 2025-06-27 |
| Baird | Maintain | Neutral | 2025-05-08 |
| Needham | Maintain | Buy | 2025-05-08 |
| Mizuho | Maintain | Neutral | 2025-02-10 |
| Needham | Maintain | Buy | 2025-02-07 |
| Jefferies | Upgrade | Buy | 2025-01-21 |
Genpact shows a mixed grading profile with a balance of Buy and Neutral ratings but no ratings below Hold or Sell.
Which company has the best grades?
Leidos Holdings, Inc. has received a stronger overall grade consensus with 19 Buy ratings and a consensus of “Buy,” compared to Genpact Limited’s mix of Buy and Neutral ratings and a consensus of “Hold.” This difference suggests investors may perceive Leidos as having somewhat better growth or value prospects, potentially influencing portfolio inclusion decisions.
Strengths and Weaknesses
Below is a comparative overview of key strengths and weaknesses for Leidos Holdings, Inc. (LDOS) and Genpact Limited (G), based on the most recent financial and operational data.
| Criterion | Leidos Holdings, Inc. (LDOS) | Genpact Limited (G) |
|---|---|---|
| Diversification | Strong with National Security, Defense, Civil segments; broad government and commercial exposure | More focused on Consumer & Healthcare; expanding in financial and tech services |
| Profitability | ROIC 13.85%, ROE 28.42%, net margin 7.53% – solid profitability but net margin neutral | ROIC 12.96%, ROE 21.5%, net margin 10.78% – better net margin and overall profitability |
| Innovation | Demonstrates durable competitive advantage and growing ROIC indicating successful innovation | Also shows durable moat and growing ROIC, innovation in process automation and digital services |
| Global presence | Strong U.S. and defense market presence, expanding civil and health sectors | Global footprint in business process outsourcing and IT services, strong in emerging markets |
| Market Share | Leading in defense and national security solutions segments | Leading in business process outsourcing, growing in high tech and healthcare sectors |
Key takeaways: Leidos excels in diversification and defense sector dominance with strong profitability metrics, while Genpact offers higher net margins and a favorable ratio profile driven by focused innovation in process services. Both companies exhibit durable competitive moats with growing returns, suggesting solid investment potential with different strategic strengths.
Risk Analysis
Below is a comparative table of key risks for Leidos Holdings, Inc. (LDOS) and Genpact Limited (G) based on the most recent 2024 data:
| Metric | Leidos Holdings, Inc. (LDOS) | Genpact Limited (G) |
|---|---|---|
| Market Risk | Beta 0.59 (low volatility) | Beta 0.76 (moderate) |
| Debt level | DE ratio 1.2 (unfavorable) | DE ratio 0.6 (neutral) |
| Regulatory Risk | Moderate (defense & government contracts) | Moderate (global outsourcing regulations) |
| Operational Risk | Medium (complex defense projects) | Medium (BPO & IT service delivery) |
| Environmental Risk | Low to moderate (some exposure in infrastructure) | Moderate (focus on ESG services) |
| Geopolitical Risk | High (US and allied defense markets) | Moderate (global operations, some country risk) |
Leidos faces elevated geopolitical risk due to its defense contracts and a relatively high debt-to-equity ratio, posing some financial leverage concerns. Genpact shows stronger balance sheet metrics with moderate operational and regulatory risks tied to its global outsourcing footprint. Market volatility is lower for Leidos, reflecting stable defense sector demand.
Which Stock to Choose?
Leidos Holdings, Inc. (LDOS) shows a favorable income evolution with a 7.53% net margin and strong growth in EBIT and EPS over 2024. Its financial ratios are slightly favorable overall, with high ROE (28.42%) and ROIC (13.85%), yet it carries moderate debt (D/E 1.2). The company’s rating is very favorable (A-), supported by a strong Altman Z-Score (4.15) and Piotroski score (8), indicating sound financial health.
Genpact Limited (G) presents a favorable income statement with a higher net margin of 10.78% and solid growth over the period despite a recent EPS decline. Its financial ratios are favorable overall, including a sound ROE (21.5%) and ROIC (12.96%), with lower debt levels (D/E 0.6). The rating is also very favorable (A-), complemented by a safe Altman Z-Score (3.68) and a strong Piotroski score (8), signaling financial stability.
Investors seeking growth potential might view LDOS’s strong profitability improvements and very favorable moat as attractive, while those prioritizing stability and lower leverage could find G’s consistent income and healthier balance sheet more appealing. Both companies demonstrate durable competitive advantages with favorable ratings, suggesting their suitability depends on individual risk tolerance and investment strategy.
Disclaimer: Investment carries a risk of loss of initial capital. The past performance is not a reliable indicator of future results. Be sure to understand risks before making an investment decision.
Go Further
I encourage you to read the complete analyses of Leidos Holdings, Inc. and Genpact Limited to enhance your investment decisions: