In the rapidly evolving Information Technology Services sector, Jack Henry & Associates, Inc. (JKHY) and Genpact Limited (G) stand out as key players with distinct yet overlapping market focuses. Jack Henry excels in financial technology solutions tailored for U.S. banks and credit unions, while Genpact offers extensive business process outsourcing and digital transformation services globally. This article will explore which company presents a more compelling investment opportunity for your portfolio.

Table of contents
Companies Overview
I will begin the comparison between Jack Henry & Associates, Inc. and Genpact Limited by providing an overview of these two companies and their main differences.
Jack Henry & Associates, Inc. Overview
Jack Henry & Associates, Inc. delivers technology solutions and payment processing services primarily to financial services organizations in the US. It operates through multiple segments, offering core banking systems, payment processing, and complementary services tailored for banks and credit unions. Founded in 1976, it holds a strong position in information technology services for financial institutions with a market cap of 14B USD and employs over 7K staff.
Genpact Limited Overview
Genpact Limited provides business process outsourcing and IT services across Asia, the Americas, and Europe. It serves diverse industries including banking, consumer goods, and manufacturing. Founded in 1997 and based in Bermuda, Genpact focuses on finance and accounting, supply chain, and IT transformation services. It employs approximately 145K people and has a market cap of 8.3B USD, reflecting its broad global footprint.
Key similarities and differences
Both companies operate in the information technology services sector, yet Jack Henry & Associates specializes in financial technology solutions for US institutions, while Genpact offers broader business process outsourcing and IT services globally. Jack Henry’s focus is on core banking and payments, contrasting with Genpact’s emphasis on finance, supply chain, and digital transformation services. Their workforce size and geographic reach also differ significantly, reflecting distinct business models.
Income Statement Comparison
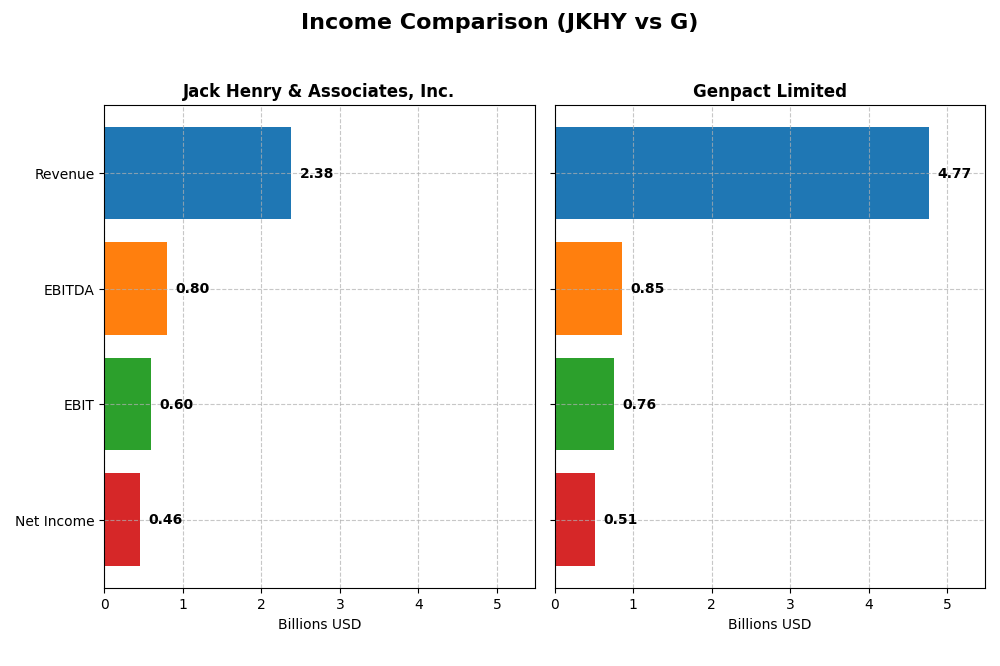
The table below presents a side-by-side comparison of key income statement metrics for Jack Henry & Associates, Inc. and Genpact Limited for their most recent fiscal years.
| Metric | Jack Henry & Associates, Inc. | Genpact Limited |
|---|---|---|
| Market Cap | 14.0B | 8.3B |
| Revenue | 2.38B | 4.77B |
| EBITDA | 801M | 853M |
| EBIT | 596M | 756M |
| Net Income | 456M | 514M |
| EPS | 6.24 | 2.88 |
| Fiscal Year | 2025 | 2024 |
Income Statement Interpretations
Jack Henry & Associates, Inc.
Jack Henry & Associates, Inc. exhibited steady revenue growth from 2021 to 2025, increasing by 35.1%. Net income rose by 46.3% over the period, supported by improving net margins, which reached 19.19% in 2025. The company’s gross and EBIT margins remained favorable, with EBIT margin at 25.11%. The latest year showed moderate revenue growth of 7.2%, alongside strong profit and margin expansion.
Genpact Limited
Genpact Limited’s revenue grew by 28.5% between 2020 and 2024, with net income increasing 66.6% overall. Margins remained favorable, albeit lower than Jack Henry, with a 10.78% net margin and 15.87% EBIT margin in 2024. The most recent fiscal year saw revenue growth of 6.5%, but net margin and EPS declined, indicating some pressure on profitability despite top-line expansion.
Which one has the stronger fundamentals?
Jack Henry & Associates shows stronger fundamentals with higher and more consistent margins, significant net income growth, and a favorable margin trend in the most recent year. Genpact, while delivering solid revenue and net income growth, encountered margin compression and EPS declines recently. Overall, Jack Henry’s income statement metrics suggest a more robust and stable profitability profile.
Financial Ratios Comparison
The table below presents a selection of key financial ratios for Jack Henry & Associates, Inc. (JKHY) and Genpact Limited (G) based on their most recent fiscal year data, offering a snapshot of profitability, valuation, liquidity, leverage, efficiency, and dividend metrics.
| Ratios | Jack Henry & Associates, Inc. (JKHY) | Genpact Limited (G) |
|---|---|---|
| ROE | 21.39% | 21.50% |
| ROIC | 17.63% | 12.96% |
| P/E | 28.88 | 14.92 |
| P/B | 6.18 | 3.21 |
| Current Ratio | 1.27 | 2.16 |
| Quick Ratio | 1.27 | 2.16 |
| D/E (Debt to Equity) | 0.00 | 0.60 |
| Debt-to-Assets | 0.00 | 28.98% |
| Interest Coverage | 54.49 | 8.83 |
| Asset Turnover | 0.78 | 0.96 |
| Fixed Asset Turnover | 10.75 | 11.66 |
| Payout Ratio | 36.13% | 21.12% |
| Dividend Yield | 1.25% | 1.42% |
Interpretation of the Ratios
Jack Henry & Associates, Inc.
Jack Henry & Associates displays strong profitability ratios, including a 21.39% return on equity and 17.63% return on invested capital, with a favorable weighted average cost of capital at 7.17%. However, valuation ratios such as P/E at 28.88 and P/B at 6.18 are less favorable, suggesting a premium price. The company pays dividends with a 1.25% yield, supported by stable free cash flow coverage.
Genpact Limited
Genpact shows solid financial health with a 21.5% return on equity and a favorable 6.88% WACC, while its P/E ratio at 14.92 is attractive. The current ratio of 2.16 and quick ratio of 2.16 highlight good liquidity. Genpact pays dividends yielding 1.42%, with a manageable debt-to-assets ratio of 28.98%, indicating balanced leverage and shareholder returns.
Which one has the best ratios?
Both companies present favorable overall financial ratios, but Genpact edges slightly ahead with a better valuation reflected in its lower P/E and stronger liquidity metrics. Jack Henry excels in profitability margins but carries higher valuation multiples. Each company shows prudent debt management and consistent dividend yields, providing distinct profiles for investors to consider.
Strategic Positioning
This section compares the strategic positioning of Jack Henry & Associates, Inc. and Genpact Limited, including Market position, Key segments, and Exposure to technological disruption:
Jack Henry & Associates, Inc.
- Strong US-focused technology provider with niche financial markets; moderate competitive pressure.
- Core, Payments, and Complementary segments drive growth in financial services technology.
- Positioned in financial tech with stable legacy systems; digital and payment solutions expansion.
Genpact Limited
- Global IT and business process outsourcing with diversified geographic presence; faces broad competition.
- Diverse segments include Banking, Consumer Goods, and High Tech, emphasizing BPO and IT services.
- Focus on digital transformation, analytics, and ESG services, exposed to rapid IT service innovation.
Jack Henry & Associates, Inc. vs Genpact Limited Positioning
Jack Henry & Associates shows a concentrated focus on US financial technology sectors, offering specialized core and payment solutions. Genpact displays diversification across industries and geographies, leveraging broad BPO and IT service capabilities for growth.
Which has the best competitive advantage?
Both companies demonstrate very favorable MOATs with growing ROIC trends, indicating durable competitive advantages. Jack Henry’s focused niche in financial services contrasts with Genpact’s diversified global IT and BPO model.
Stock Comparison
The past year highlights distinct bullish trends for Jack Henry & Associates, Inc. (JKHY) and Genpact Limited (G), with notable price appreciations and increasing trading volumes reflecting accelerating momentum for both stocks.

Trend Analysis
Jack Henry & Associates, Inc. (JKHY) shows a bullish trend with a 9.46% price increase over the past 12 months, accompanied by accelerating momentum and a volatility measure of 9.15. The stock reached a high of 192.6 and a low of 146.26.
Genpact Limited (G) exhibits a stronger bullish trend with a 30.69% price increase over the same period, also with acceleration and lower volatility at 6.15. The stock’s price ranged between 30.9 and 55.05.
Comparing the two, Genpact Limited has delivered the highest market performance with a significantly larger price gain, despite Jack Henry’s recent acceleration and stronger buyer dominance in trading volume.
Target Prices
Here is the latest consensus on target prices for selected technology service companies.
| Company | Target High | Target Low | Consensus |
|---|---|---|---|
| Jack Henry & Associates, Inc. | 220 | 161 | 196 |
| Genpact Limited | 53 | 50 | 51.5 |
Analysts expect Jack Henry & Associates to trade near 196, slightly above its current price of 192.6, indicating moderate upside potential. Genpact’s consensus target of 51.5 also suggests a modest increase from the current 47.44 price level.
Analyst Opinions Comparison
This section compares analysts’ ratings and grades for Jack Henry & Associates, Inc. and Genpact Limited:
Rating Comparison
JKHY Rating
- Rating: A-; classified as Very Favorable by analysts.
- Discounted Cash Flow Score: 4, indicating a Favorable valuation outlook.
- ROE Score: 4, showing Favorable profitability from shareholders’ equity.
- ROA Score: 5, rated Very Favorable for effective asset utilization.
- Debt To Equity Score: 4, Favorable for financial stability and lower risk.
- Overall Score: 4, rated Favorable overall.
G Rating
- Rating: A-; also rated Very Favorable by analysts.
- Discounted Cash Flow Score: 5, reflecting a Very Favorable valuation view.
- ROE Score: 4, also Favorable for shareholder profitability.
- ROA Score: 4, considered Favorable for asset usage efficiency.
- Debt To Equity Score: 2, Moderate, indicating higher leverage risk.
- Overall Score: 4, also Favorable overall.
Which one is the best rated?
Both companies share the same overall rating of A- and an overall score of 4, categorized as Favorable. Genpact scores higher on discounted cash flow, while Jack Henry leads in asset utilization and debt management, reflecting strengths in different areas.
Scores Comparison
Here is a comparison of the Altman Z-Score and Piotroski Score for both companies:
JKHY Scores
- Altman Z-Score: 12.58, indicating a safe financial zone with very low bankruptcy risk.
- Piotroski Score: 8, classified as very strong financial health and value potential.
G Scores
- Altman Z-Score: 3.68, also in the safe zone but significantly lower than JKHY.
- Piotroski Score: 8, equally very strong in financial health and investment value.
Which company has the best scores?
JKHY holds a substantially higher Altman Z-Score than G, suggesting stronger financial stability and lower bankruptcy risk. Both companies share identical very strong Piotroski Scores, indicating comparable financial health from that perspective.
Grades Comparison
Here is a comparison of the recent grades assigned to Jack Henry & Associates, Inc. and Genpact Limited by leading grading companies:
Jack Henry & Associates, Inc. Grades
The following table summarizes recent grades from recognized analysts for Jack Henry & Associates, Inc.:
| Grading Company | Action | New Grade | Date |
|---|---|---|---|
| Wolfe Research | Upgrade | Outperform | 2026-01-08 |
| UBS | Maintain | Neutral | 2026-01-08 |
| RBC Capital | Upgrade | Outperform | 2025-12-16 |
| Baird | Maintain | Neutral | 2025-12-15 |
| Keefe, Bruyette & Woods | Upgrade | Outperform | 2025-12-08 |
| Goldman Sachs | Maintain | Neutral | 2025-11-07 |
| Wells Fargo | Maintain | Equal Weight | 2025-11-06 |
| Compass Point | Upgrade | Buy | 2025-11-06 |
| DA Davidson | Maintain | Buy | 2025-10-29 |
| Goldman Sachs | Maintain | Neutral | 2025-10-13 |
Overall, Jack Henry & Associates, Inc. shows a positive trend with multiple upgrades to “Outperform” and “Buy” ratings, balanced by several “Neutral” assessments.
Genpact Limited Grades
The following table presents recent grades assigned to Genpact Limited by notable grading firms:
| Grading Company | Action | New Grade | Date |
|---|---|---|---|
| JP Morgan | Maintain | Neutral | 2025-08-20 |
| Needham | Maintain | Buy | 2025-08-08 |
| Mizuho | Maintain | Neutral | 2025-07-01 |
| Needham | Maintain | Buy | 2025-06-30 |
| TD Cowen | Maintain | Buy | 2025-06-27 |
| Baird | Maintain | Neutral | 2025-05-08 |
| Needham | Maintain | Buy | 2025-05-08 |
| Mizuho | Maintain | Neutral | 2025-02-10 |
| Needham | Maintain | Buy | 2025-02-07 |
| Jefferies | Upgrade | Buy | 2025-01-21 |
Genpact Limited’s grades mostly indicate stability with a strong presence of “Buy” ratings maintained by several firms and some “Neutral” views.
Which company has the best grades?
Jack Henry & Associates, Inc. has received more upgrades towards “Outperform” compared to Genpact Limited’s consistent “Buy” and “Neutral” ratings. This suggests investors may view Jack Henry as having stronger recent momentum, while Genpact maintains steady but less dynamic analyst support.
Strengths and Weaknesses
Below is a comparison table highlighting the strengths and weaknesses of Jack Henry & Associates, Inc. (JKHY) and Genpact Limited (G) based on recent financial and operational data.
| Criterion | Jack Henry & Associates, Inc. (JKHY) | Genpact Limited (G) |
|---|---|---|
| Diversification | Moderate: Focused on financial technology with segments in Payments, Core, and Complementary services. | Moderate to High: Diverse services in Consumer & Healthcare, Financial Services, and High Tech sectors. |
| Profitability | High: Net margin 19.19%, ROE 21.39%, ROIC 17.63%, consistently above WACC. | Solid: Net margin 10.78%, ROE 21.5%, ROIC 12.96%, also above WACC. |
| Innovation | Strong: Growing ROIC indicates effective use of capital and innovation in fintech solutions. | Strong: High ROIC growth (54.6%) suggests dynamic innovation and operational improvements. |
| Global presence | Focused primarily in the U.S. financial services market. | Broad: Global footprint with diversified industry presence. |
| Market Share | Leading in U.S. banking systems and payments technology. | Significant in business process outsourcing and IT services globally. |
Jack Henry & Associates excels in profitability and stable growth in its niche fintech market, while Genpact shows strong innovation and a broader global and industry diversification. Both companies demonstrate favorable financial health, but JKHY is more specialized, and Genpact offers wider market exposure.
Risk Analysis
Below is a comparative table outlining key risks for Jack Henry & Associates, Inc. (JKHY) and Genpact Limited (G) based on their most recent financial data and operational environments:
| Metric | Jack Henry & Associates, Inc. (JKHY) | Genpact Limited (G) |
|---|---|---|
| Market Risk | Moderate (Beta 0.73, tech sector) | Moderate (Beta 0.76, global IT services) |
| Debt Level | Very Low (Debt/Equity = 0, favorable) | Moderate (Debt/Equity = 0.6, neutral) |
| Regulatory Risk | Moderate (US financial services focus) | Moderate (Global BPO with multi-jurisdiction exposure) |
| Operational Risk | Low (Strong operational efficiency, Altman Z-score 12.58) | Moderate (Complex global operations, Z-score 3.68) |
| Environmental Risk | Low (Limited direct environmental impact) | Moderate (ESG services focus, exposure to regulations) |
| Geopolitical Risk | Low (US-based operations) | Moderate (Global presence, including Asia and Europe) |
The most likely and impactful risks stem from Genpact’s moderate debt and geopolitical exposure due to its diversified global footprint, which may add volatility. Jack Henry benefits from a stronger balance sheet and lower operational risk but faces market risk tied to the US financial tech sector. Investors should monitor Genpact’s regulatory and geopolitical developments closely, and for Jack Henry, valuation multiples suggest cautious entry despite solid fundamentals.
Which Stock to Choose?
Jack Henry & Associates, Inc. (JKHY) shows a favorable income evolution with a 7.21% revenue growth last year and strong profitability metrics, including a 19.19% net margin. Its financial ratios are mostly favorable, with a low debt level and a very favorable credit rating of A-. The company demonstrates a very favorable economic moat with a ROIC well above its WACC and a growing trend over 2021-2025.
Genpact Limited (G) exhibits a steady income evolution with a 6.48% revenue growth last year and favorable profitability, though net margin is lower at 10.78%. Its financial ratios are broadly favorable, despite moderate leverage, and it holds a very favorable credit rating of A-. The firm also maintains a very favorable moat status, showing value creation with a rising ROIC trend from 2020 to 2024.
Investors focused on growth might find JKHY appealing due to its higher profitability and strong economic moat durability. Conversely, those prioritizing a balance between valuation and stable returns could view G as attractive, given its favorable ratings and moderate leverage. Both companies display favorable financial health, and the choice might depend on specific investor risk tolerance and strategy preferences.
Disclaimer: Investment carries a risk of loss of initial capital. The past performance is not a reliable indicator of future results. Be sure to understand risks before making an investment decision.
Go Further
I encourage you to read the complete analyses of Jack Henry & Associates, Inc. and Genpact Limited to enhance your investment decisions: