In the fast-evolving world of information technology services, Genpact Limited and Globant S.A. stand out as influential players driving innovation and digital transformation. Both companies operate globally, offering diverse IT solutions with a focus on business process outsourcing and cutting-edge technology services. Their overlapping markets and commitment to innovation make them compelling candidates for comparison. Join me as we explore which company presents the most attractive investment opportunity.

Table of contents
Companies Overview
I will begin the comparison between Genpact Limited and Globant S.A. by providing an overview of these two companies and their main differences.
Genpact Limited Overview
Genpact Limited is a business process outsourcing and IT services company operating globally across India, Asia, the Americas, and Europe. It serves multiple sectors including banking, consumer goods, life sciences, and manufacturing. Genpact offers a broad range of services such as CFO advisory, ESG reporting, finance and accounting, supply chain, IT support, and digital transformation solutions. The company was founded in 1997 and is headquartered in Hamilton, Bermuda.
Globant S.A. Overview
Globant S.A. is a technology services firm based in Luxembourg, delivering digital and IT solutions worldwide. Its offerings include e-commerce, digital lending, cloud transformation, AI-driven data services, and innovative platforms like augmented coding and conversational interfaces. Globant also focuses on sectors such as healthcare, media, and entertainment, emphasizing agile delivery and sustainable business solutions. The company started in 2003 and changed its name to Globant in 2012.
Key similarities and differences
Both Genpact and Globant operate in the Information Technology Services industry with global footprints and a focus on digital transformation. Genpact emphasizes business process outsourcing and finance-related services, whereas Globant prioritizes cutting-edge technology solutions such as AI, cloud, and interactive platforms. Genpact has a larger workforce and market cap, while Globant shows higher beta and more diverse digital innovation offerings.
Income Statement Comparison
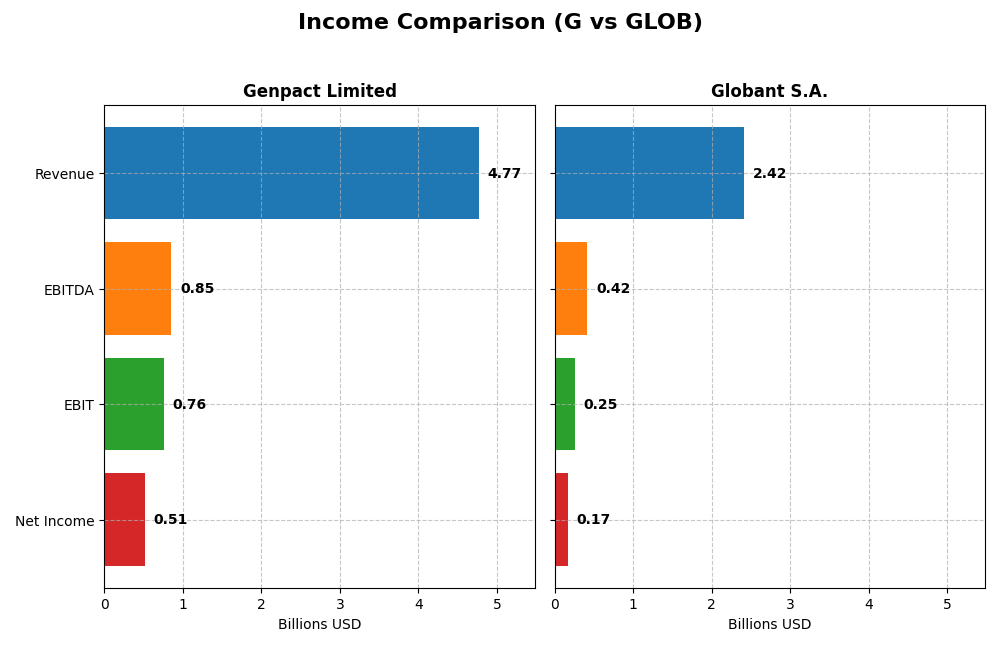
The table below provides a side-by-side comparison of key income statement metrics for Genpact Limited and Globant S.A. for the fiscal year 2024.
| Metric | Genpact Limited | Globant S.A. |
|---|---|---|
| Market Cap | 8.3B | 3.0B |
| Revenue | 4.77B | 2.42B |
| EBITDA | 853M | 417M |
| EBIT | 756M | 254M |
| Net Income | 514M | 166M |
| EPS | 2.88 | 3.82 |
| Fiscal Year | 2024 | 2024 |
Income Statement Interpretations
Genpact Limited
Genpact’s revenue increased steadily from $3.7B in 2020 to $4.77B in 2024, with net income rising from $308M to $514M over the same period. Margins improved notably, with a gross margin of 35.45% and a net margin of 10.78% in 2024. The latest year saw revenue growth moderate at 6.5%, while net margin declined by 23.6%, indicating some pressure on profitability despite favorable operating expense control.
Globant S.A.
Globant showed robust revenue growth from $814M in 2020 to $2.42B in 2024, with net income climbing from $54M to $166M. Margins remain stable with a gross margin of 35.74% and a net margin of 6.86% in 2024. The most recent year featured a strong 15.3% revenue growth and a slight net margin decline of 9.3%, though earnings per share increased by 2.2%, reflecting solid operational leverage.
Which one has the stronger fundamentals?
Both companies present favorable income statement evaluations with improving revenue and net income trends. Genpact benefits from higher net margins and a stronger net income growth over the period, but its recent margin contraction signals caution. Globant exhibits faster revenue expansion and earnings growth, albeit with lower net margins. Fundamentally, each demonstrates strengths, with Globant showing higher growth intensity and Genpact exhibiting more robust profitability metrics.
Financial Ratios Comparison
The table below presents a side-by-side comparison of key financial ratios for Genpact Limited (G) and Globant S.A. (GLOB) based on their most recent fiscal year data from 2024.
| Ratios | Genpact Limited (G) | Globant S.A. (GLOB) |
|---|---|---|
| ROE | 21.5% | 8.4% |
| ROIC | 13.0% | 6.8% |
| P/E | 14.9 | 57.6 |
| P/B | 3.21 | 4.86 |
| Current Ratio | 2.16 | 1.54 |
| Quick Ratio | 2.16 | 1.54 |
| D/E (Debt-to-Equity) | 0.60 | 0.21 |
| Debt-to-Assets | 29.0% | 13.0% |
| Interest Coverage | 8.83 | 7.87 |
| Asset Turnover | 0.96 | 0.76 |
| Fixed Asset Turnover | 11.7 | 8.70 |
| Payout Ratio | 21.1% | 0% |
| Dividend Yield | 1.42% | 0% |
Interpretation of the Ratios
Genpact Limited
Genpact exhibits mostly strong financial ratios, with favorable net margin at 10.78%, ROE at 21.5%, and ROIC at 12.96%, indicating efficient profitability and capital use. The current and quick ratios of 2.16 reflect good liquidity, though the PB ratio of 3.21 is unfavorable. Genpact pays dividends with a neutral yield of 1.42%, suggesting moderate shareholder returns supported by stable payout policies.
Globant S.A.
Globant shows mixed financial ratios, with a neutral net margin of 6.86% and unfavorable ROE of 8.44%, indicating weaker profitability compared to peers. Its PE ratio at 57.64 and PB of 4.86 are unfavorable, reflecting high valuation multiples. The company does not pay dividends, which may reflect reinvestment strategy or growth focus, accompanied by moderate liquidity ratios around 1.54 and favorable debt metrics.
Which one has the best ratios?
Genpact has a more favorable ratio profile overall, with 71.43% of ratios positive, demonstrating stronger profitability, liquidity, and capital efficiency. Globant, with only 42.86% favorable ratios and several unfavorable valuation metrics, shows a less robust financial position. Therefore, Genpact presents a generally stronger financial health based on the evaluated ratios.
Strategic Positioning
This section compares the strategic positioning of Genpact Limited and Globant S.A., including their market position, key segments, and exposure to technological disruption:
Genpact Limited
- Strong market position in IT services with moderate competitive pressure (marketCap 8.3B, beta 0.76).
- Diversified segments: Banking, Consumer Healthcare, High Tech, Manufacturing, and various advisory and IT services.
- Focus on traditional IT services with added ESG and finance advisory; limited disruption exposure mentioned.
Globant S.A.
- Smaller market cap of 3B with higher competitive volatility (beta 1.20).
- Concentrated on technology services: digital solutions, cloud, AI, gaming, healthcare, and media.
- High exposure to cutting-edge technologies including blockchain, metaverse, AI, and cloud transformation.
Genpact Limited vs Globant S.A. Positioning
Genpact operates with a diversified business model across several traditional IT and business process segments, offering stability. Globant pursues a concentrated strategy focused on innovative digital and technology services, potentially higher growth but with more volatility.
Which has the best competitive advantage?
Genpact shows a very favorable moat with ROIC above WACC and growing profitability, indicating a durable competitive advantage. Globant’s moat is slightly unfavorable as it currently sheds value despite improving ROIC trends.
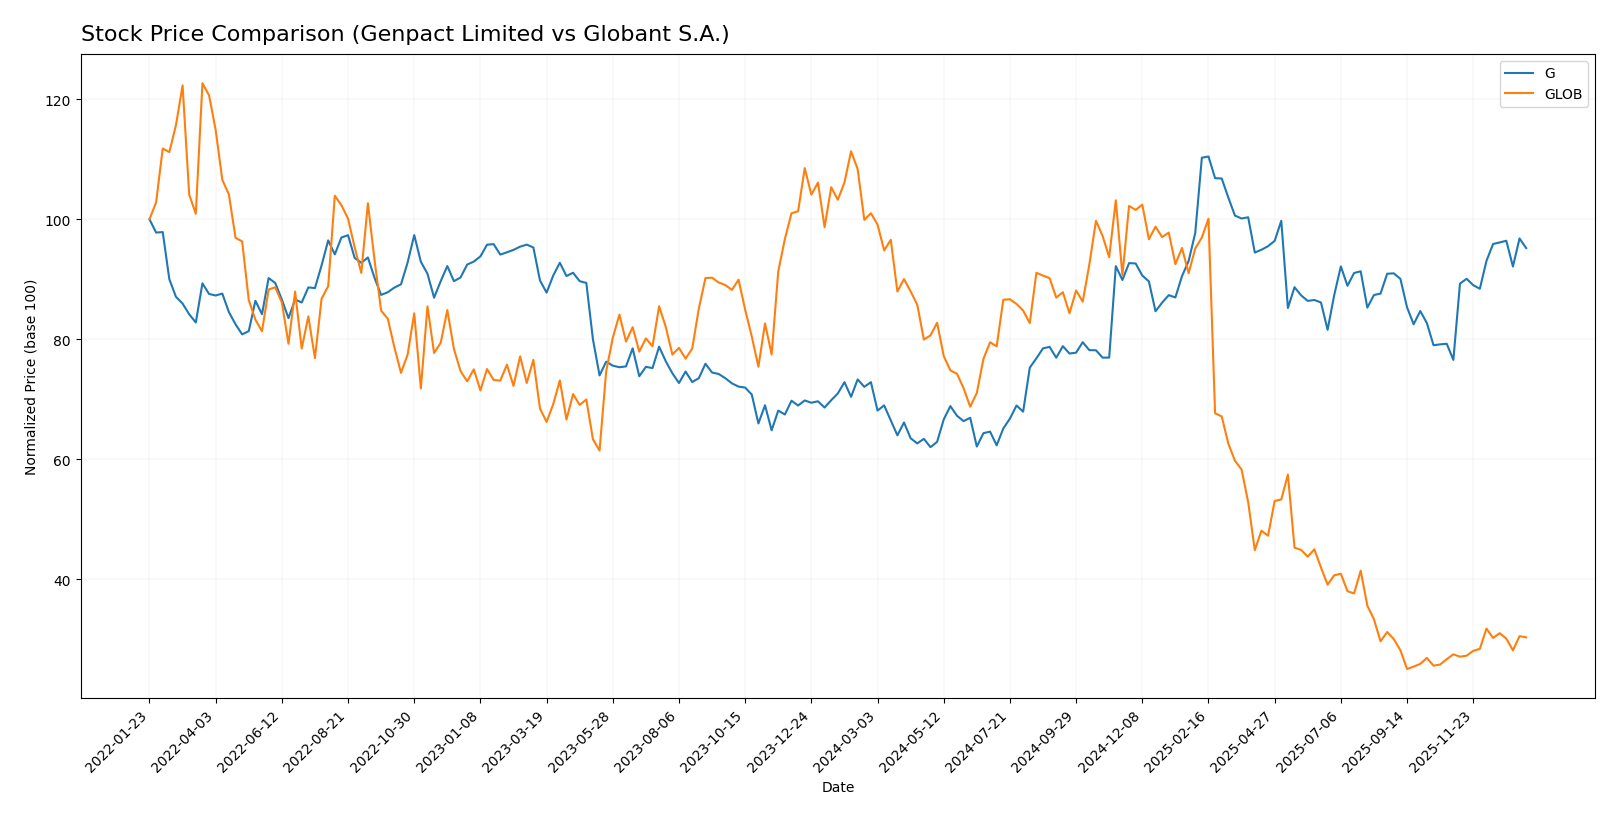
Stock Comparison
The stock price movements over the past year reveal a pronounced bullish trend for Genpact Limited contrasted with a sharp bearish trend for Globant S.A., alongside notable trading volume dynamics.
Trend Analysis
Genpact Limited’s stock shows a strong bullish trend with a 30.69% increase over the past 12 months, marked by accelerating momentum and moderate volatility (6.15 std deviation). The price range spanned from 30.9 to 55.05.
Globant S.A. experienced a significant bearish trend with a 70.01% decrease over the same period, despite acceleration in the decline and very high volatility (61.44 std deviation). Prices fluctuated between 56.11 and 231.36.
Comparatively, Genpact Limited delivered the highest market performance with a strong upward trend, while Globant S.A.’s stock faced a steep decline, reflecting divergent investor sentiment and market dynamics.
Target Prices
Here is the latest target price consensus from reliable analysts for these two technology services companies.
| Company | Target High | Target Low | Consensus |
|---|---|---|---|
| Genpact Limited | 53 | 50 | 51.5 |
| Globant S.A. | 80 | 68 | 72.5 |
Analysts expect moderate upside for Genpact, with a consensus target about 8.5% above its current price of 47.44 USD. Globant’s consensus target suggests a roughly 7% potential increase from its current price near 67.93 USD.
Analyst Opinions Comparison
This section compares analysts’ ratings and grades for Genpact Limited and Globant S.A.:
Rating Comparison
Genpact Limited Rating
- Rating: A- indicating a very favorable overall assessment.
- Discounted Cash Flow Score: 5, very favorable valuation metric.
- ROE Score: 4, favorable efficiency at generating shareholder profit.
- ROA Score: 4, favorable asset utilization for earnings.
- Debt To Equity Score: 2, moderate financial risk with some leverage.
- Overall Score: 4, favorable summary of financial health.
Globant S.A. Rating
- Rating: A- indicating a very favorable overall assessment.
- Discounted Cash Flow Score: 5, very favorable valuation metric.
- ROE Score: 3, moderate efficiency at generating shareholder profit.
- ROA Score: 3, moderate asset utilization for earnings.
- Debt To Equity Score: 3, moderate financial risk with higher leverage.
- Overall Score: 4, favorable summary of financial health.
Which one is the best rated?
Both companies hold an identical overall rating of A- with favorable overall scores. Genpact shows stronger returns on equity and assets, and lower debt-to-equity risk, positioning it slightly better in financial efficiency and risk metrics than Globant.
Scores Comparison
This table compares the financial health scores of Genpact Limited and Globant S.A.:
Genpact Limited Scores
- Altman Z-Score: 3.68, indicating a safe zone, low bankruptcy risk.
- Piotroski Score: 8, classified as very strong financial health.
Globant S.A. Scores
- Altman Z-Score: 3.05, indicating a safe zone, low bankruptcy risk.
- Piotroski Score: 5, classified as average financial health.
Which company has the best scores?
Genpact Limited shows a higher Altman Z-Score and a significantly stronger Piotroski Score than Globant S.A., indicating better overall financial strength based on the provided data.
Grades Comparison
Here is a comparison of the recent grades assigned to Genpact Limited and Globant S.A.:
Genpact Limited Grades
The following table presents recent grade updates from verified grading companies for Genpact Limited:
| Grading Company | Action | New Grade | Date |
|---|---|---|---|
| JP Morgan | Maintain | Neutral | 2025-08-20 |
| Needham | Maintain | Buy | 2025-08-08 |
| Mizuho | Maintain | Neutral | 2025-07-01 |
| Needham | Maintain | Buy | 2025-06-30 |
| TD Cowen | Maintain | Buy | 2025-06-27 |
| Baird | Maintain | Neutral | 2025-05-08 |
| Needham | Maintain | Buy | 2025-05-08 |
| Mizuho | Maintain | Neutral | 2025-02-10 |
| Needham | Maintain | Buy | 2025-02-07 |
| Jefferies | Upgrade | Buy | 2025-01-21 |
Genpact’s grades mostly maintain a “Buy” or “Neutral” rating, with a notable upgrade from Jefferies early in 2025.
Globant S.A. Grades
Below are recent grade changes and maintenances for Globant S.A. from recognized grading firms:
| Grading Company | Action | New Grade | Date |
|---|---|---|---|
| Jefferies | Downgrade | Hold | 2025-11-20 |
| UBS | Maintain | Neutral | 2025-11-18 |
| JP Morgan | Maintain | Neutral | 2025-11-14 |
| Needham | Maintain | Buy | 2025-11-14 |
| Canaccord Genuity | Maintain | Hold | 2025-11-14 |
| Goldman Sachs | Maintain | Neutral | 2025-10-09 |
| UBS | Maintain | Neutral | 2025-08-20 |
| Goldman Sachs | Maintain | Neutral | 2025-08-18 |
| Needham | Maintain | Buy | 2025-08-15 |
| JP Morgan | Downgrade | Neutral | 2025-08-15 |
Globant’s ratings show a mixture of “Neutral,” “Hold,” and “Buy” grades, with recent downgrades from Jefferies and JP Morgan.
Which company has the best grades?
Genpact Limited generally holds stronger and more consistent “Buy” grades compared to Globant S.A., which has experienced recent downgrades and more “Neutral” or “Hold” opinions. This divergence may influence investors’ perception of relative growth and risk profiles.
Strengths and Weaknesses
Below is a comparison table highlighting the key strengths and weaknesses of Genpact Limited and Globant S.A. based on the most recent financial and strategic data.
| Criterion | Genpact Limited (G) | Globant S.A. (GLOB) |
|---|---|---|
| Diversification | Moderate diversification across Consumer & Healthcare, Financial Services, and High Tech sectors | Less diversified; primarily focused on digital transformation services |
| Profitability | Strong profitability: net margin 10.78%, ROE 21.5%, ROIC 12.96% | Weaker profitability: net margin 6.86%, ROE 8.44%, ROIC 6.82% |
| Innovation | Consistent investment in IT and business process outsourcing innovations | Focus on innovation but high P/E (57.64) suggests premium valuation and pressure to deliver growth |
| Global presence | Established global footprint with diverse client base | Growing global presence but smaller scale compared to Genpact |
| Market Share | Larger market share in business process outsourcing and IT services | Smaller market share, niche in digital services with potential for growth |
Key takeaways: Genpact shows a very favorable economic moat with strong profitability and diversified revenue streams, making it a safer investment. Globant, while innovating and growing ROIC, is still shedding value and carries higher valuation risks, suggesting more caution for investors.
Risk Analysis
Below is a comparative table of key risks for Genpact Limited (G) and Globant S.A. (GLOB) as of the most recent fiscal year 2024.
| Metric | Genpact Limited (G) | Globant S.A. (GLOB) |
|---|---|---|
| Market Risk | Moderate beta (0.755), stable IT services demand | Higher beta (1.204), more volatile with broad tech exposure |
| Debt Level | Moderate debt-to-assets at 29%, interest coverage strong (9.51x) | Low debt-to-assets at 13%, good interest coverage (8.87x) |
| Regulatory Risk | Exposure to multi-jurisdictional compliance, focus on ESG services increases scrutiny | Operating worldwide, subject to diverse regulatory environments |
| Operational Risk | Large workforce (145K) risks labor and process inefficiencies | Smaller workforce (31K) but reliant on rapid tech innovation and delivery |
| Environmental Risk | Provides ESG and sustainability services, risk mainly reputational | Tech services with some sustainability offerings; moderate reputational risk |
| Geopolitical Risk | Based in Bermuda, operations in Asia, Americas, Europe; sensitive to geopolitical shifts | Headquarters in Luxembourg, global footprint; exposed to trade and tech policy changes |
Genpact’s moderate market risk and stable financials with strong interest coverage make it resilient, though operational scale presents complexity. Globant’s higher market volatility and tech sector exposure imply greater risk, particularly given its elevated valuation multiples. Regulatory and geopolitical uncertainties remain significant for both, requiring close monitoring.
Which Stock to Choose?
Genpact Limited (G) shows a favorable income evolution with 28.52% revenue growth over 2020-2024 and a 10.78% net margin. Financial ratios are mostly favorable, including a strong 21.5% ROE and a solid 2.16 current ratio; debt levels are moderate. The company holds a very favorable rating (A-) and demonstrates a very favorable moat with a ROIC exceeding WACC by 6.08%, indicating durable competitive advantages.
Globant S.A. (GLOB) exhibits a strong revenue growth of 196.72% over the same period and favorable income metrics but with lower profitability; net margin is 6.86%, and ROE is less favorable at 8.44%. Financial ratios are mixed, with 42.86% favorable and some unfavorable, including a high P/E of 57.64. Its rating is also A- but with a slightly unfavorable moat as ROIC is below WACC by 2.1%, suggesting value erosion despite improving profitability.
Investors focused on stable profitability and strong financial health might find Genpact’s metrics and very favorable moat more appealing, while those prioritizing aggressive growth potential could be more intrigued by Globant’s rapid revenue expansion despite higher valuation and mixed financial ratios. The choice could depend on the investor’s risk tolerance and investment strategy.
Disclaimer: Investment carries a risk of loss of initial capital. The past performance is not a reliable indicator of future results. Be sure to understand risks before making an investment decision.
Go Further
I encourage you to read the complete analyses of Genpact Limited and Globant S.A. to enhance your investment decisions: