Home > Comparison > Consumer Cyclical > TSLA vs GM
The strategic rivalry between Tesla, Inc. and General Motors Company shapes the future of the automotive industry. Tesla operates as an innovative electric vehicle and energy solutions pioneer, emphasizing technology integration and direct sales. General Motors, a legacy automaker, combines traditional manufacturing with expanding autonomous and connected vehicle services. This analysis evaluates which company presents a superior risk-adjusted return, balancing growth potential against established market presence for diversified portfolios.
Table of contents
Companies Overview
Tesla and General Motors stand as two titans shaping the future of the automotive industry.
Tesla, Inc.: Pioneer in Electric Innovation
Tesla dominates the electric vehicle market through direct sales and a proprietary network of Superchargers. Its core revenue stems from electric vehicle sales, regulatory credits, and energy storage solutions. In 2026, Tesla’s strategic focus remains on expanding energy generation products and enhancing in-app vehicle upgrades, reinforcing its technological leadership in sustainable transport.
General Motors Company: Legacy Automaker Embracing Transformation
General Motors leads with a diversified lineup of trucks, crossovers, and electric vehicles across multiple global brands. Its revenue engine combines vehicle sales to consumers and fleets, alongside automotive financing and connected safety services. GM’s 2026 strategy emphasizes autonomous vehicle technology and subscription-based software services, underlining its commitment to innovation within a traditional framework.
Strategic Collision: Similarities & Divergences
Tesla pursues a vertically integrated model, controlling sales and energy segments, while GM leverages a multi-brand, dealer-based ecosystem with a strong software-services push. Both compete fiercely in electric and autonomous vehicles, targeting different customer bases and distribution channels. Their distinct approaches create contrasting investment profiles: Tesla as a pure tech-driven disruptor and GM as a legacy player evolving through diversification.
Income Statement Comparison
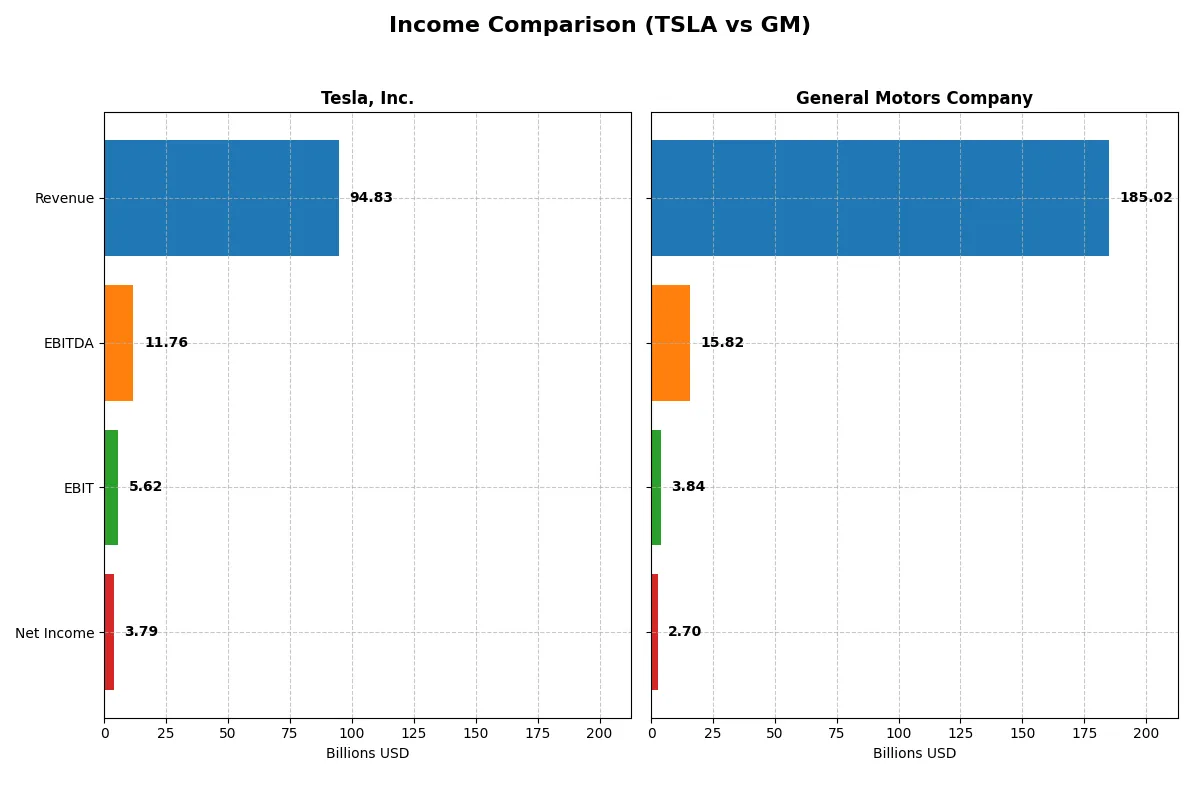
This data dissects the core profitability and scalability of both corporate engines to reveal who dominates the bottom line:
| Metric | Tesla, Inc. (TSLA) | General Motors Company (GM) |
|---|---|---|
| Revenue | 94.8B | 185.0B |
| Cost of Revenue | 77.7B | 173.4B |
| Operating Expenses | 12.7B | 8.7B |
| Gross Profit | 17.1B | 11.6B |
| EBITDA | 11.8B | 15.8B |
| EBIT | 5.6B | 3.8B |
| Interest Expense | 0.3B | 0.7B |
| Net Income | 3.8B | 2.7B |
| EPS | 1.18 | 3.33 |
| Fiscal Year | 2025 | 2025 |
Income Statement Analysis: The Bottom-Line Duel
This income statement comparison uncovers how efficiently Tesla and General Motors convert sales into profits and manage costs over time.
Tesla, Inc. Analysis
Tesla’s revenue rose significantly from 54B in 2021 to 98B in 2025 but dipped slightly in the last year. Net income, however, shrank from 5.5B in 2021 to 3.8B in 2025, reflecting margin pressures. Gross margin held steady around 18%, while net margin declined to 4%, indicating rising expenses and reduced profitability momentum in 2025.
General Motors Company Analysis
GM’s revenue expanded from 127B in 2021 to 185B in 2025 yet also posted a slight decline recently. Net income fell sharply from 10B in 2021 to 2.7B in 2025, and gross margin compressed to just over 6%. Operating efficiency weakened with EBIT margin dropping to 2.1%, signaling significant margin erosion despite higher scale.
Margin Resilience vs. Scale Challenges
Tesla maintains higher gross and net margins than GM, despite revenue fluctuations, showcasing superior cost control and operational leverage. GM’s scale advantage fails to translate into profit growth, with steeper margin deterioration. Tesla’s profile appeals more to investors seeking earnings quality, while GM reflects risks tied to margin compression amid high revenue.
Financial Ratios Comparison
These vital ratios act as a diagnostic tool to expose the underlying fiscal health, valuation premiums, and capital efficiency of the companies compared below:
| Ratios | Tesla, Inc. (TSLA) | General Motors Company (GM) |
|---|---|---|
| ROE | 4.62% | 4.41% |
| ROIC | 2.95% | 1.16% |
| P/E | 383 | 27.7 |
| P/B | 17.7 | 1.22 |
| Current Ratio | 2.16 | 1.17 |
| Quick Ratio | 1.77 | 1.01 |
| D/E (Debt-to-Equity) | 0.10 | 2.13 |
| Debt-to-Assets | 6.08% | 46.3% |
| Interest Coverage | 12.9 | 4.00 |
| Asset Turnover | 0.69 | 0.66 |
| Fixed Asset Turnover | 2.33 | 2.17 |
| Payout Ratio | 0 | 24.4% |
| Dividend Yield | 0% | 0.88% |
| Fiscal Year | 2025 | 2025 |
Efficiency & Valuation Duel: The Vital Signs
Financial ratios serve as a company’s DNA, exposing hidden risks and revealing operational excellence that shapes investor decisions.
Tesla, Inc.
Tesla shows low profitability with a 4.62% ROE and a slim 4% net margin, signaling operational challenges. Its valuation is stretched, posting an extremely high 383 P/E and a 17.7 P/B ratio. Tesla does not pay dividends but reinvests heavily in R&D, reflecting a growth-focused capital allocation strategy despite unfavorable returns on invested capital.
General Motors Company
GM reports a 4.41% ROE and a 1.46% net margin, indicating modest profitability under pressure. Its valuation is more reasonable with a 27.7 P/E and a 1.22 P/B, suggesting less market exuberance. GM pays a small dividend yield of 0.88%, showing some shareholder return, but elevated debt levels and weaker ROIC hint at financial risks.
Balanced Risk vs. Growth: Tesla’s Premium Strain vs. GM’s Modest Footing
Tesla commands a premium valuation with weak profitability, reflecting high growth expectations but significant risk. GM offers a more conservative valuation with marginal returns but higher financial leverage. Investors seeking growth might tolerate Tesla’s stretched metrics; those preferring stability may lean toward GM’s steadier, albeit less exciting, profile.
Which one offers the Superior Shareholder Reward?
I see Tesla (TSLA) pays no dividends, reinvesting heavily in growth and innovation, with zero payout ratio and no dividend yield. GM offers modest dividends yielding around 0.9% with a payout ratio near 24%, signaling steady income but limited distribution. Tesla’s buyback activity is minimal, focusing on expansion, while GM’s free cash flow is volatile and sometimes negative, restricting buybacks. Tesla’s reinvestment strategy supports a high valuation multiple, reflecting growth expectations. GM’s dividend is sustainable but modest, with higher leverage and weaker cash coverage ratios. For 2026, I judge Tesla’s growth-driven model offers superior total return potential, despite zero dividends, compared to GM’s income-focused but riskier distribution.
Comparative Score Analysis: The Strategic Profile
The radar chart reveals the fundamental DNA and trade-offs of Tesla and General Motors, highlighting their financial strengths and valuation disparities:
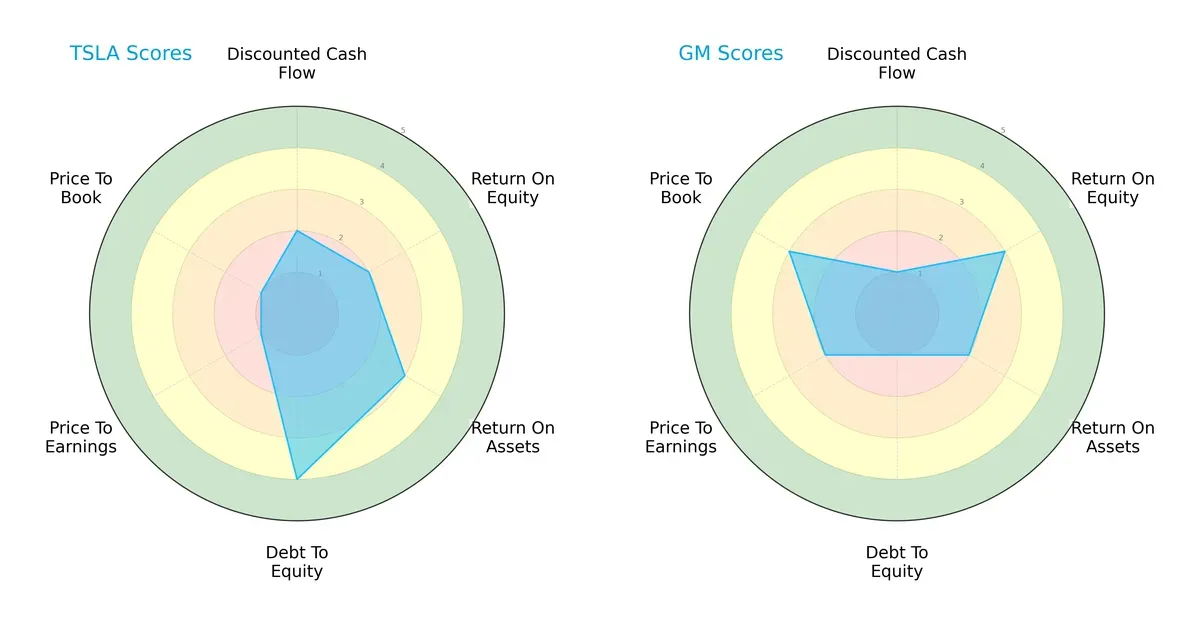
Tesla shows a more balanced financial profile with moderate scores in ROA (3) and debt-to-equity (4), indicating efficient asset use and a strong balance sheet. GM leans on higher ROE (3) and better valuation scores (P/E 2, P/B 3), suggesting relative undervaluation but carries higher financial risk with low debt-to-equity (1). Tesla’s reliance on a solid balance sheet contrasts with GM’s valuation appeal.
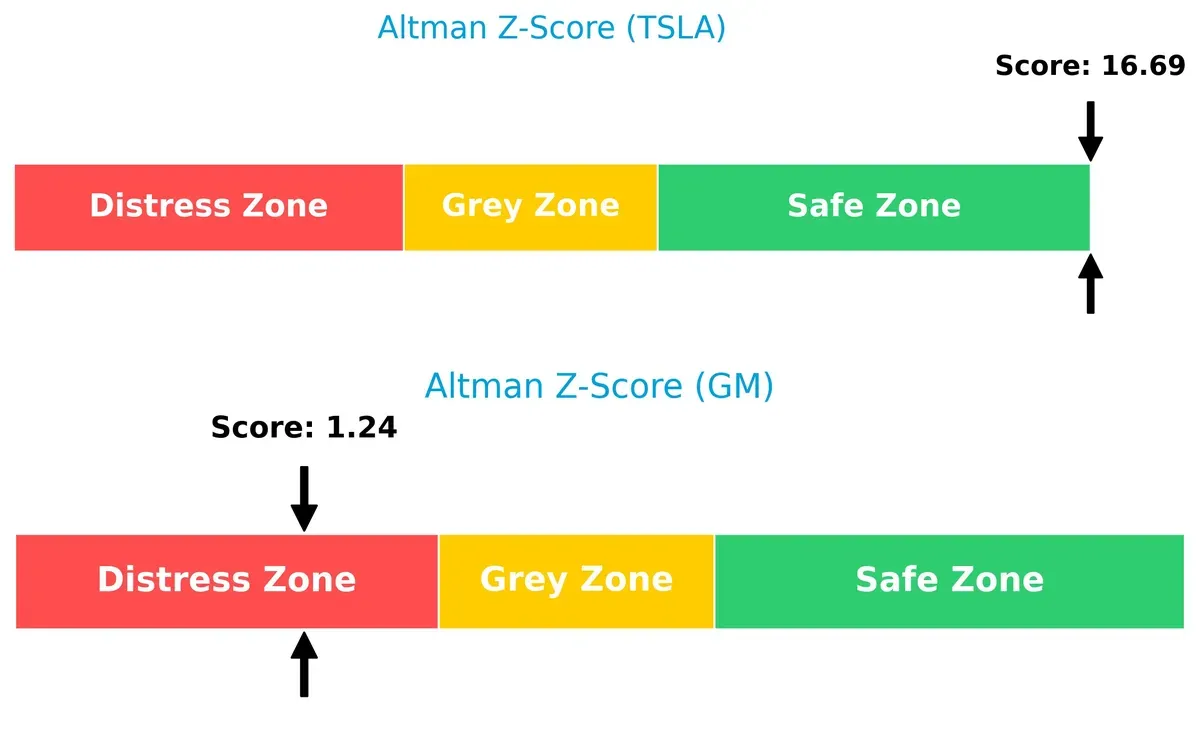
Bankruptcy Risk: Solvency Showdown
Tesla’s Altman Z-Score (16.7) far surpasses GM’s (1.2), signaling Tesla’s robust solvency and minimal bankruptcy risk. GM’s score places it in distress, raising caution for long-term survival in this cycle:
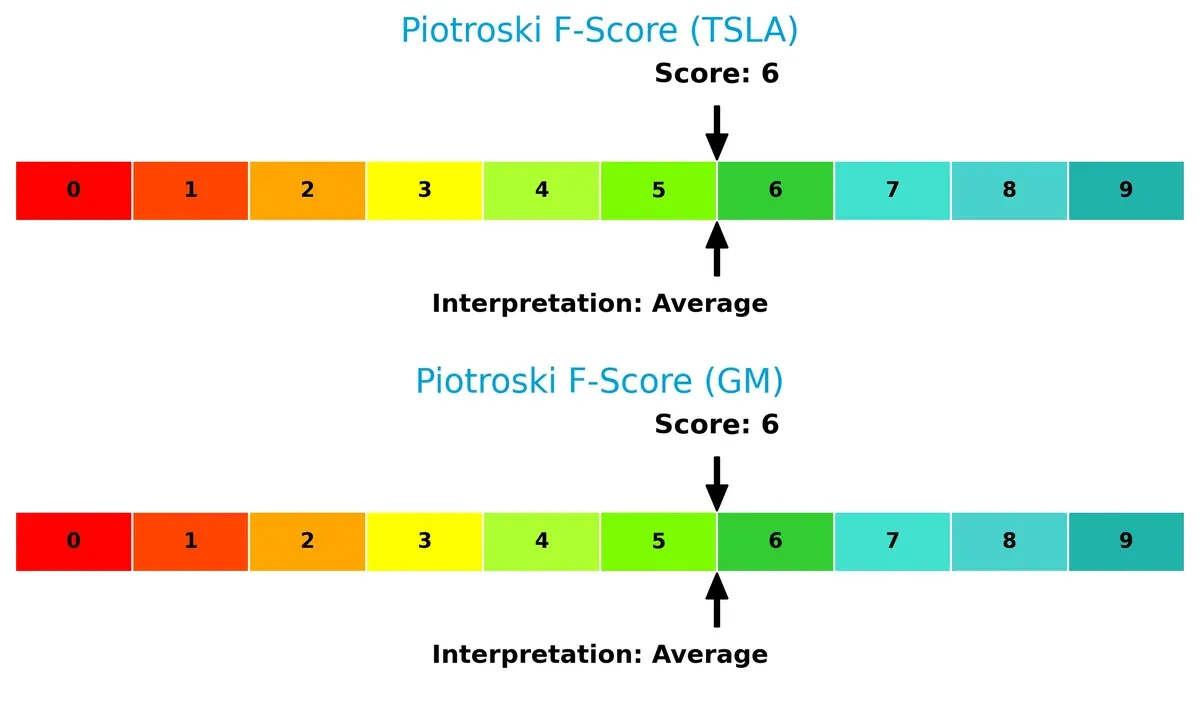
Financial Health: Quality of Operations
Both Tesla and GM share an average Piotroski F-Score of 6, reflecting decent but not peak financial health. Neither company flags severe internal weaknesses, but both have room to strengthen operational quality:
How are the two companies positioned?
This section dissects Tesla’s and GM’s operational DNA by comparing their revenue distribution and internal strengths and weaknesses. The goal is to confront their economic moats to identify which model delivers the most resilient, sustainable competitive advantage today.
Revenue Segmentation: The Strategic Mix
This visual comparison dissects how Tesla, Inc. and General Motors Company diversify their income streams and where their primary sector bets lie:
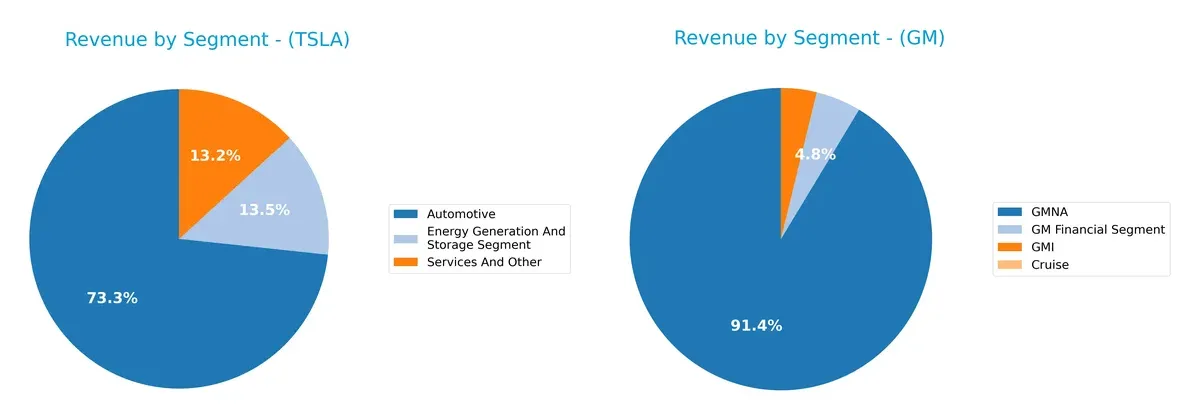
Tesla’s revenue anchors heavily in Automotive at $69.5B, with Energy Generation ($12.8B) and Services ($12.5B) providing notable but smaller contributions. GM dwarfs Tesla in scale, with GMNA dominating at $322.3B, supported by GM Financial ($17.1B) and GMI ($13.4B). Tesla’s mix shows calculated diversification beyond cars, while GM’s massive automotive segment creates infrastructure dominance but elevates concentration risk.
Strengths and Weaknesses Comparison
This table compares the strengths and weaknesses of Tesla and GM based on diversification, profitability, financials, innovation, global presence, and market share:
Tesla Strengths
- Diverse revenue streams across automotive, energy, and services
- Strong liquidity ratios with current ratio at 2.16 and quick ratio at 1.77
- Low leverage with debt to equity at 0.1 and interest coverage at 16.62
- Significant market share in electric vehicles and innovation leadership
GM Strengths
- Broad product segmentation including GMNA and GM Financial
- Favorable weighted average cost of capital at 5.81% and price-to-book at 1.22
- Reasonable interest coverage at 5.29 and quick ratio at 1.01
- Large US market presence with $138B revenue and stable non-US sales
Tesla Weaknesses
- Profitability metrics weak with net margin 4.0%, ROE 4.62%, and ROIC 2.95% below WACC of 12.4%
- High valuation multiples, PE at 383 and PB at 17.69, may imply overpricing
- No dividend yield limits income appeal
GM Weaknesses
- Low profitability with net margin 1.46%, ROE 4.41%, and ROIC 1.16% below WACC of 5.81%
- High leverage with debt to equity at 2.13 despite neutral debt to assets
- Minimal dividend yield at 0.88%
- Lower asset turnover compared to Tesla
Tesla’s strengths lie in its diversified revenue, strong liquidity, and innovation edge, but it faces valuation and profitability headwinds. GM benefits from stable product and geographic diversification and better capital cost management but struggles with profitability and higher leverage. Both face challenges turning scale into strong returns.
The Moat Duel: Analyzing Competitive Defensibility
A structural moat is the only barrier protecting long-term profits from relentless competition and market erosion. Let’s compare Tesla and General Motors:
Tesla, Inc.: Innovation and Brand Intangibles
Tesla’s moat stems from its brand power and innovation leadership, reflected in premium pricing and relatively stable gross margins around 18%. However, declining ROIC signals weakening capital efficiency, threatening its moat unless new products or energy ventures gain traction in 2026.
General Motors Company: Scale and Legacy Cost Advantage
GM leverages scale and cost advantages in traditional vehicles, with large U.S. market share underpinning revenue. Despite a weaker 6% gross margin and also declining ROIC, GM’s established manufacturing footprint offers potential to deepen moats via EV investments and autonomous tech expansion.
Verdict: Innovation Intangibles vs. Scale Cost Advantage
Both companies show declining ROIC, signaling value destruction and challenging moats. Tesla’s innovation moat is deeper but under pressure. GM’s scale offers breadth but less profitability. Tesla remains better positioned to defend market share if it reverses its ROIC decline.
Which stock offers better returns?
The past year shows Tesla’s stock soaring over 145%, with decelerating gains and a high price peak at 481.2. GM also surged above 110%, accelerating with a lower volatility profile.
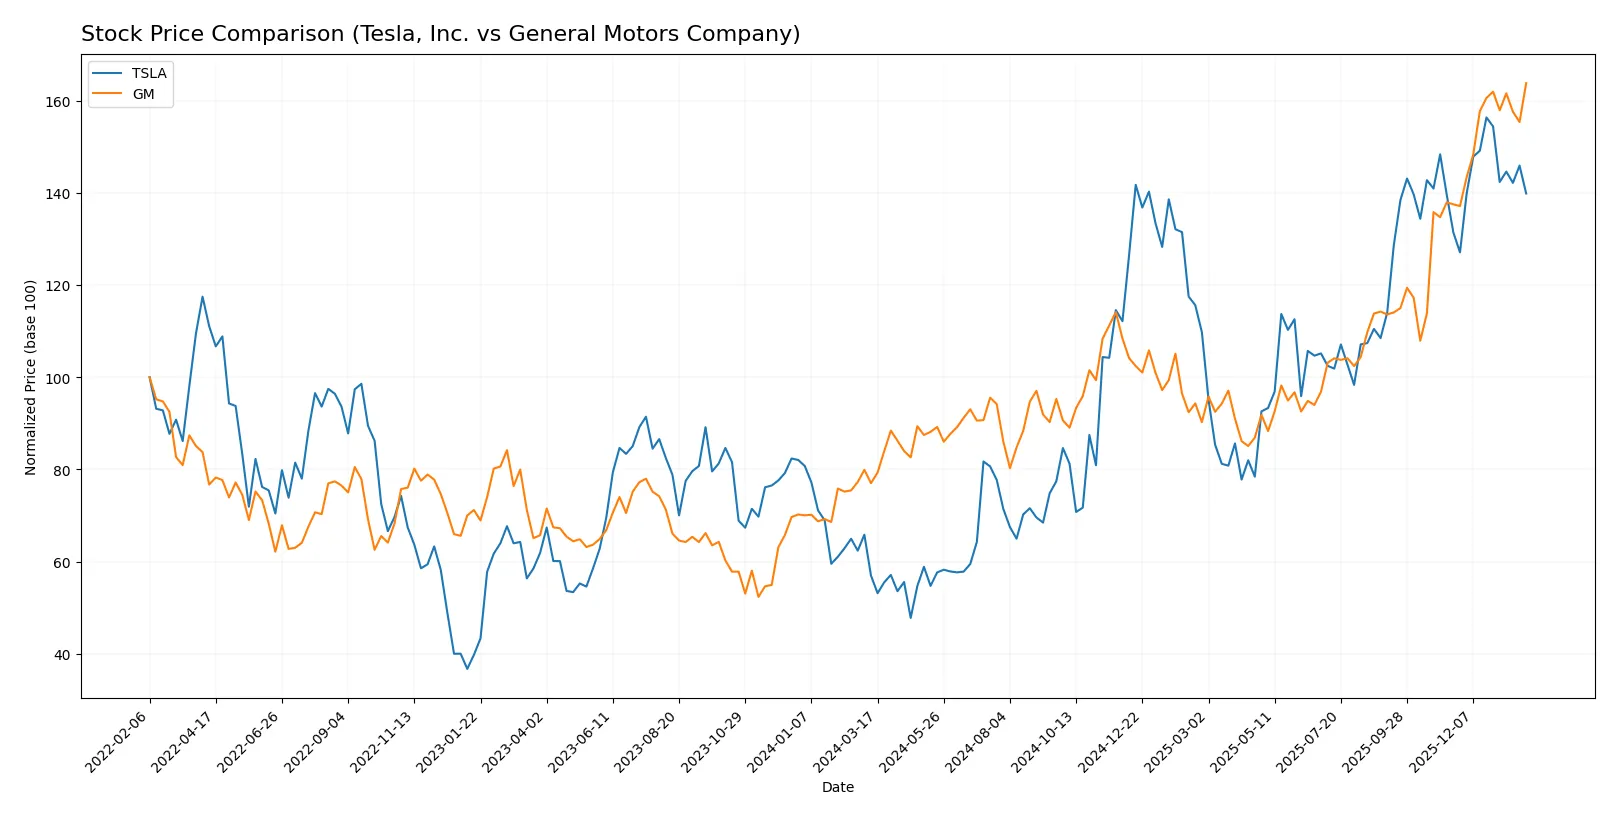
Trend Comparison
Tesla’s stock gained 145.47% over the last 12 months, marking a bullish trend with decelerating momentum and high volatility. The price ranged from 147.05 to 481.2.
General Motors rose 112.66% in the same period, also bullish but accelerating. It showed less volatility, with prices between 39.5 and 84.0.
Tesla outperformed GM, delivering stronger market returns despite decelerating growth and greater price fluctuations.
Target Prices
Analysts present a broad but optimistic consensus on target prices for Tesla and General Motors.
| Company | Target Low | Target High | Consensus |
|---|---|---|---|
| Tesla, Inc. | 300 | 600 | 458.67 |
| General Motors | 55 | 110 | 89.93 |
Tesla’s target consensus at 459 exceeds its current price of 430, signaling upside potential supported by its innovation moat. General Motors’ consensus near 90 also lies above its 84 share price, reflecting steady recovery prospects in the auto sector.

Don’t Let Luck Decide Your Entry Point
Optimize your entry points with our advanced ProRealTime indicators. You’ll get efficient buy signals with precise price targets for maximum performance. Start outperforming now!
How do institutions grade them?
The following tables summarize recent institutional grades for Tesla, Inc. and General Motors Company:
Tesla, Inc. Grades
Here are the latest grades assigned to Tesla by major financial institutions:
| Grading Company | Action | New Grade | Date |
|---|---|---|---|
| Morgan Stanley | Maintain | Equal Weight | 2026-01-29 |
| Mizuho | Maintain | Outperform | 2026-01-29 |
| Wells Fargo | Maintain | Underweight | 2026-01-29 |
| GLJ Research | Maintain | Sell | 2026-01-29 |
| Wedbush | Maintain | Outperform | 2026-01-29 |
| Cantor Fitzgerald | Maintain | Overweight | 2026-01-29 |
| RBC Capital | Maintain | Outperform | 2026-01-29 |
| Truist Securities | Maintain | Hold | 2026-01-29 |
| Needham | Maintain | Hold | 2026-01-29 |
| Barclays | Maintain | Equal Weight | 2026-01-23 |
General Motors Company Grades
Below are the current grades for General Motors from reputable analysts:
| Grading Company | Action | New Grade | Date |
|---|---|---|---|
| RBC Capital | Maintain | Outperform | 2026-01-28 |
| Mizuho | Maintain | Outperform | 2026-01-28 |
| Wells Fargo | Maintain | Underweight | 2026-01-28 |
| Barclays | Maintain | Overweight | 2026-01-28 |
| UBS | Maintain | Buy | 2026-01-28 |
| Deutsche Bank | Maintain | Hold | 2026-01-28 |
| Piper Sandler | Maintain | Overweight | 2026-01-28 |
| Barclays | Maintain | Overweight | 2026-01-23 |
| JP Morgan | Maintain | Overweight | 2026-01-21 |
| HSBC | Maintain | Hold | 2026-01-13 |
Which company has the best grades?
General Motors generally receives more positive ratings, including multiple Overweight and Buy grades, compared to Tesla’s more mixed profile with several Hold and Sell grades. This suggests investors may perceive GM as having stronger near-term prospects.
Risks specific to each company
The following categories identify the critical pressure points and systemic threats facing both firms in the 2026 market environment:
1. Market & Competition
Tesla, Inc.
- Dominates electric vehicle innovation but faces high valuation pressure and intense competition in EV space.
General Motors Company
- Strong legacy brand with broad market reach but slower EV adoption and pressured by new tech entrants.
2. Capital Structure & Debt
Tesla, Inc.
- Low debt levels (D/E 0.1) and high interest coverage (16.62) indicate strong balance sheet discipline.
General Motors Company
- High leverage (D/E 2.13) raises financial risk despite manageable interest coverage (5.29).
3. Stock Volatility
Tesla, Inc.
- High beta at 1.835 signals elevated stock volatility and market sensitivity.
General Motors Company
- Moderate beta 1.317 reflects more stable stock behavior amid market swings.
4. Regulatory & Legal
Tesla, Inc.
- Faces regulatory scrutiny on autopilot safety and environmental compliance globally.
General Motors Company
- Subject to legacy regulatory risks and evolving emissions standards in multiple markets.
5. Supply Chain & Operations
Tesla, Inc.
- Vertically integrated supply chain mitigates some risks but exposed to raw material price swings.
General Motors Company
- Complex global supply chain and reliance on suppliers increase operational risk.
6. ESG & Climate Transition
Tesla, Inc.
- ESG leader with strong positioning in clean energy but faces scrutiny on labor practices.
General Motors Company
- Improving ESG profile but legacy emissions and slower transition pace remain concerns.
7. Geopolitical Exposure
Tesla, Inc.
- Significant China exposure creates potential risk amid US-China tensions.
General Motors Company
- Diversified geographic footprint but also exposed to trade policy volatility.
Which company shows a better risk-adjusted profile?
Tesla’s greatest risk lies in its sky-high valuation and stock volatility, which could amplify market corrections. GM’s major concern is its heavy debt load, increasing financial vulnerability. Despite Tesla’s operational and balance sheet strengths, its elevated beta and valuation pose risks. GM’s financial leverage and regulatory legacy weigh on its profile. I observe Tesla’s Altman Z-Score firmly in the safe zone (16.7) versus GM’s distress zone (1.24), confirming Tesla’s stronger financial stability despite market risks. Overall, Tesla shows a better risk-adjusted profile, but investors must watch valuation and volatility closely.
Final Verdict: Which stock to choose?
Tesla’s superpower lies in its innovation-driven brand and unmatched efficiency in electric vehicle technology. However, its declining profitability and stretched valuation present a point of vigilance. Tesla fits an aggressive growth portfolio willing to embrace volatility for potential long-term leadership in EVs.
General Motors benefits from a strategic moat rooted in legacy manufacturing scale and improving operational discipline. Its safer financial profile, despite debt concerns, offers relatively better stability than Tesla. GM suits a GARP (Growth at a Reasonable Price) portfolio focused on steady recovery and value.
If you prioritize innovation and market disruption, Tesla is compelling due to its brand strength and growth trajectory despite profitability challenges. However, if you seek more financial stability and value orientation, GM offers better risk control and recovery potential, though it lags in dynamism and margin expansion.
Disclaimer: Investment carries a risk of loss of initial capital. The past performance is not a reliable indicator of future results. Be sure to understand risks before making an investment decision.
Go Further
I encourage you to read the complete analyses of Tesla, Inc. and General Motors Company to enhance your investment decisions: