In today’s competitive packaged foods industry, General Mills, Inc. and The Magnum Ice Cream Company N.V. stand out as key players with overlapping market interests and distinct innovation strategies. General Mills, a diversified global giant, contrasts with Magnum’s focused ice cream expertise and recent market debut. This comparison will help investors navigate their strengths and risks, ultimately revealing which company offers the most compelling investment opportunity in 2026.
Table of contents
Companies Overview
I will begin the comparison between General Mills and The Magnum Ice Cream Company by providing an overview of these two companies and their main differences.
General Mills Overview
General Mills, Inc. operates globally in the packaged foods sector, manufacturing and marketing a broad portfolio of branded consumer foods. Its diverse product range includes cereals, snacks, pet food, and various organic items. Headquartered in Minneapolis, the company serves multiple channels like retail, foodservice, and convenience stores, with 34K employees supporting its extensive operations.
The Magnum Ice Cream Company Overview
The Magnum Ice Cream Company N.V. focuses exclusively on the ice cream business. Based in Amsterdam, Netherlands, it operates within the packaged foods industry with around 18.5K employees. The company’s concentrated market approach centers on ice cream products, differentiating its business scope from broader food manufacturers.
Key similarities and differences
Both companies operate in the consumer defensive sector and packaged foods industry, trading on the NYSE. General Mills has a broad product portfolio across multiple food categories, while Magnum Ice Cream specializes solely in ice cream. General Mills has a larger workforce and a longer operational history, whereas Magnum Ice Cream is a newer public entity focused on a niche segment within the same industry.
Income Statement Comparison
This table compares the key income statement metrics for General Mills, Inc. and The Magnum Ice Cream Company N.V. for their most recent fiscal years, reflecting their financial performance side by side.
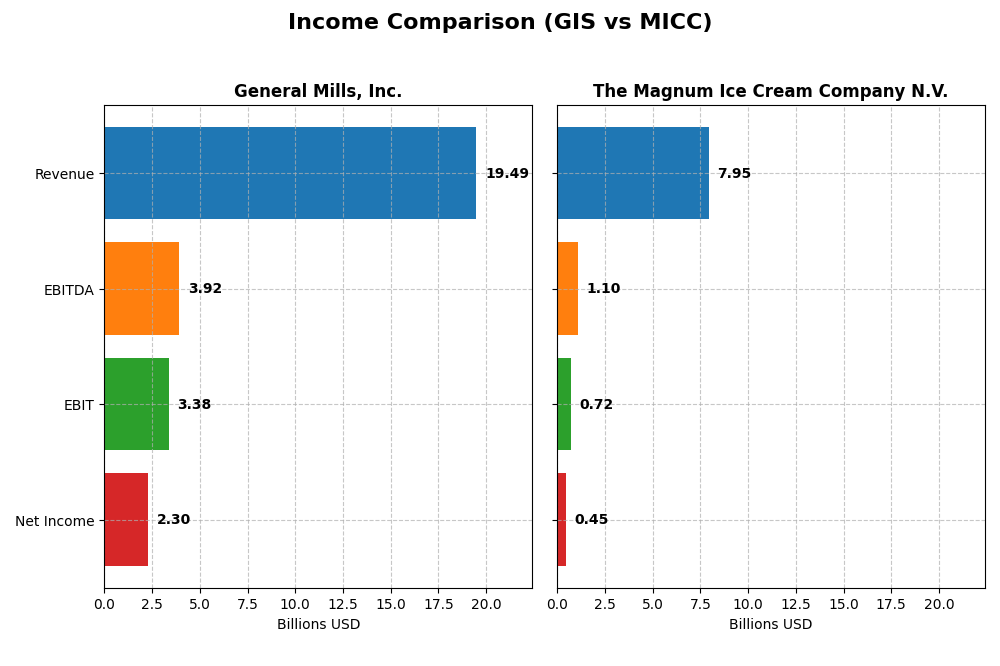
| Metric | General Mills, Inc. (2025) | The Magnum Ice Cream Company N.V. (2024) |
|---|---|---|
| Market Cap | 23.7B | 9.3B |
| Revenue | 19.5B | 7.9B |
| EBITDA | 3.9B | 1.1B |
| EBIT | 3.4B | 725M |
| Net Income | 2.3B | 450M |
| EPS | 4.12 | 0.74 |
| Fiscal Year | 2025 | 2024 |
Income Statement Interpretations
General Mills, Inc.
General Mills showed a modest revenue increase of 7.5% from 2021 to 2025 but experienced a slight decline of 1.87% in the last year. Net income fell by 1.91% overall and dropped 6.32% in the most recent year. Margins remain mostly favorable, with a gross margin of 34.55% and net margin of 11.78%, though net margin and EPS declined in 2025, suggesting some profit pressure.
The Magnum Ice Cream Company N.V.
Magnum Ice Cream’s revenue grew 5.88% over 2022-2024, including a 4.32% increase in the last year. However, net income decreased by 11.59% overall and net margin fell by 16.5%. Gross margin is strong at 34.91%, but EBIT margin is neutral at 9.12%. Recent EPS fell by 7.5%, reflecting margin compression despite revenue gains.
Which one has the stronger fundamentals?
Both companies show unfavorable overall income statement evaluations. General Mills has higher margins and more favorable expense control, but recent profitability and net income growth trends are negative. Magnum’s revenue growth is steadier, yet profitability and margin declines are more pronounced. Each faces challenges in sustaining earnings growth and margin stability.
Financial Ratios Comparison
This table compares key financial ratios for General Mills, Inc. (GIS) and The Magnum Ice Cream Company N.V. (MICC) based on their most recent fiscal year data.
| Ratios | General Mills, Inc. (GIS) | The Magnum Ice Cream Company N.V. (MICC) |
|---|---|---|
| ROE | 24.95% | 16.20% |
| ROIC | 9.62% | 16.42% |
| P/E | 12.90 | 19.60 |
| P/B | 3.22 | 3.18 |
| Current Ratio | 0.67 | 0.80 |
| Quick Ratio | 0.43 | 0.35 |
| D/E | 1.66 | 0.07 |
| Debt-to-Assets | 46.25% | 3.41% |
| Interest Coverage | 6.02 | 5.18 |
| Asset Turnover | 0.59 | 1.44 |
| Fixed Asset Turnover | 4.83 | 3.37 |
| Payout ratio | 58.33% | 2.44% |
| Dividend yield | 4.52% | 0.12% |
Interpretation of the Ratios
General Mills, Inc.
General Mills shows a mix of strong and weak ratios. It has favorable net margin (11.78%) and return on equity (24.95%), but its current and quick ratios are low (0.67 and 0.43), indicating liquidity concerns. Debt levels are high with a debt-to-equity of 1.66. The dividend yield is attractive at 4.52%, supported by a steady payout, though cash flow coverage is negative, raising sustainability questions.
The Magnum Ice Cream Company N.V.
Magnum Ice Cream presents generally favorable ratios, including a strong return on equity (16.2%) and return on invested capital (16.42%). Its leverage is low with a debt-to-equity ratio of 0.07, and liquidity ratios remain below 1, signaling some short-term risk. The dividend yield is minimal at 0.12%, reflecting the company’s reinvestment strategy and growth focus without significant dividend distributions.
Which one has the best ratios?
Magnum Ice Cream exhibits a higher proportion of favorable ratios, particularly in profitability and low leverage, despite weaker liquidity. General Mills has stronger dividend yield and profitability but faces liquidity and debt concerns. Overall, Magnum Ice Cream’s ratios suggest a more balanced financial profile, while General Mills shows mixed strengths and risks.
Strategic Positioning
This section compares the strategic positioning of General Mills, Inc. and The Magnum Ice Cream Company N.V. regarding Market position, Key segments, and Exposure to technological disruption:
General Mills, Inc.
- Large market cap with diverse packaged foods, facing broad industry competition.
- Operates multiple segments including cereals, snacks, pet food, and super-premium ice cream.
- No explicit data on technological disruption exposure provided.
The Magnum Ice Cream Company N.V.
- Mid-size player focused exclusively on ice cream, competing in a niche segment.
- Concentrated solely on ice cream products with no segment diversification.
- No explicit data on technological disruption exposure provided.
General Mills, Inc. vs The Magnum Ice Cream Company N.V. Positioning
General Mills pursues a diversified strategy across several food segments, offering broad market exposure but facing complex competitive pressures. Magnum Ice Cream focuses on a concentrated ice cream business, simplifying focus but limiting diversification benefits.
Which has the best competitive advantage?
General Mills demonstrates a very favorable moat with growing ROIC indicating durable competitive advantage. Magnum Ice Cream shows a favorable moat with stable profitability but less ROIC growth, suggesting a solid yet less dynamic competitive position.
Stock Comparison
The stock price movements of General Mills, Inc. (GIS) and The Magnum Ice Cream Company N.V. (MICC) over the past 12 months reveal distinct bearish trends, with GIS showing accelerated decline and higher volatility compared to MICC’s more stable but still negative performance.
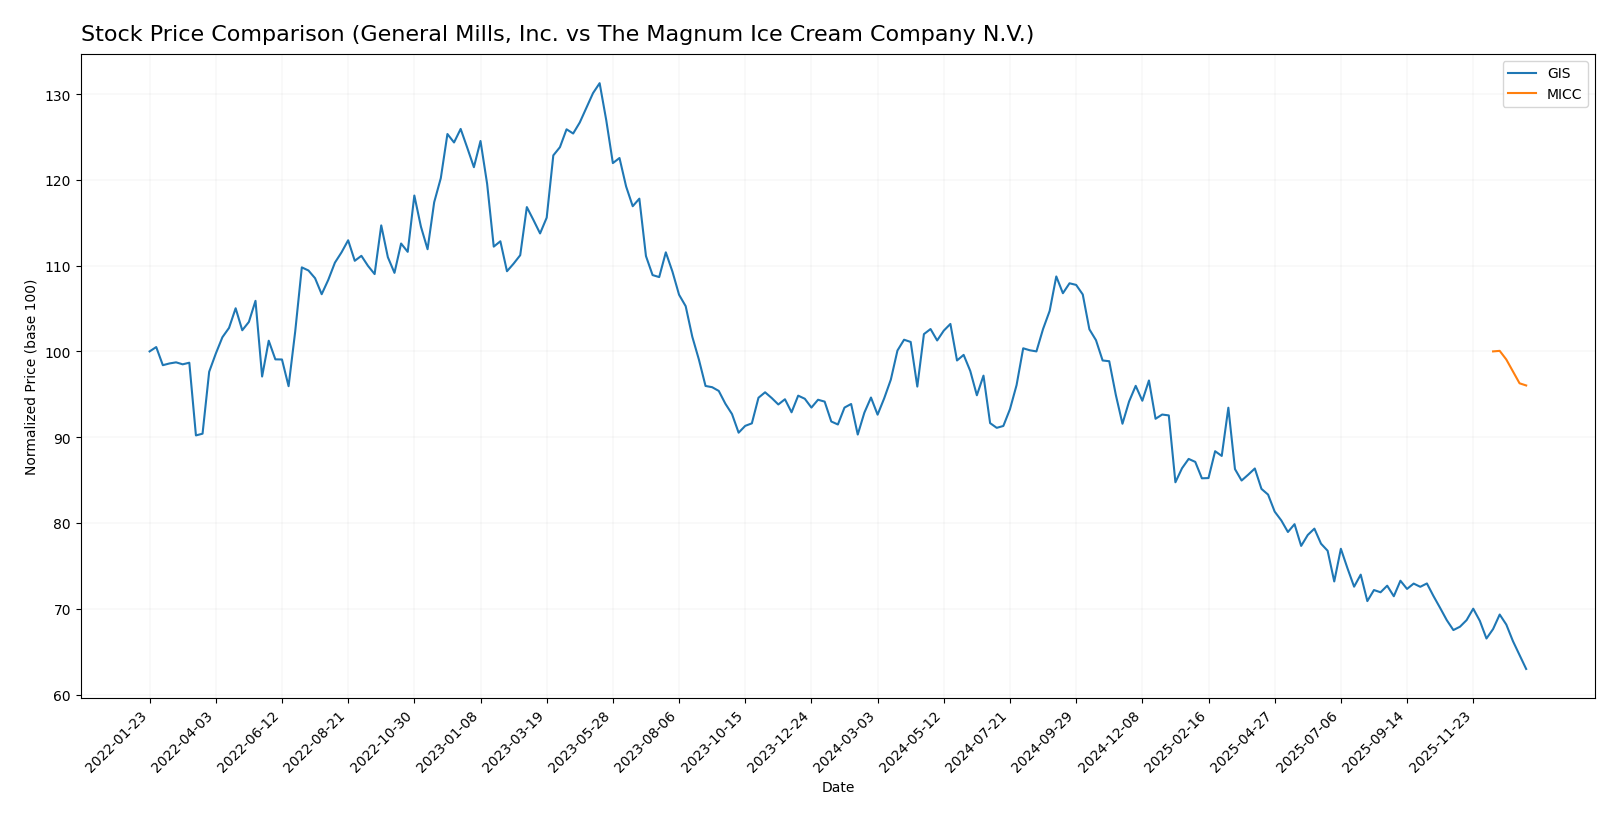
Trend Analysis
General Mills, Inc. (GIS) experienced a significant bearish trend over the past year with a price decline of 33.44%, coupled with accelerating downward momentum and a standard deviation of 8.84. The stock reached a high of 75.06 and a low of 43.48, reflecting substantial volatility.
The Magnum Ice Cream Company N.V. (MICC) also showed a bearish trend with a 3.97% price decrease over the same period. The trend remained stable, displaying low volatility with a standard deviation of 0.26 and a narrow price range between 15.88 and 15.24.
Comparing the two, GIS delivered the lowest market performance with a much steeper decline and higher volatility, whereas MICC’s stock showed a smaller decrease and greater price stability over the past year.
Target Prices
The current analyst consensus presents a clear outlook on target prices for General Mills, Inc. and The Magnum Ice Cream Company N.V.
| Company | Target High | Target Low | Consensus |
|---|---|---|---|
| General Mills, Inc. | 63 | 47 | 52.2 |
| The Magnum Ice Cream Company N.V. | 16 | 16 | 16 |
Analysts expect General Mills’ stock to trade moderately above its current price of 43.48 USD, indicating potential upside. Magnum Ice Cream’s consensus target of 16 USD also suggests a slight increase from its present 15.24 USD.
Analyst Opinions Comparison
This section compares analysts’ ratings and grades for General Mills, Inc. (GIS) and The Magnum Ice Cream Company N.V. (MICC):
Rating Comparison
GIS Rating
- Rating: A- indicating a very favorable overall evaluation.
- Discounted Cash Flow Score: 5, very favorable, suggesting strong future cash flow.
- ROE Score: 5, very favorable, showing excellent profit generation from equity.
- ROA Score: 4, favorable, effective asset utilization.
- Debt To Equity Score: 1, very unfavorable, indicating high financial risk.
- Overall Score: 4, favorable overall financial health.
MICC Rating
- Rating: B- also indicates a very favorable general assessment.
- Discounted Cash Flow Score: 1, very unfavorable, indicating weak cash flow outlook.
- ROE Score: 5, very favorable, also excellent at generating profit from equity.
- ROA Score: 4, favorable, similarly effective in asset use.
- Debt To Equity Score: 1, very unfavorable, similarly high financial risk.
- Overall Score: 3, moderate overall financial standing.
Which one is the best rated?
Based on the provided data, GIS holds a stronger overall rating (A- vs B-) and higher discounted cash flow and overall scores. Both share excellent ROE and ROA scores and similarly unfavorable debt to equity scores, making GIS the better rated stock by analysts.
Scores Comparison
The scores comparison between General Mills, Inc. and The Magnum Ice Cream Company N.V. is as follows:
General Mills, Inc. Scores
- Altman Z-Score: 2.43, indicating a moderate bankruptcy risk (grey zone).
- Piotroski Score: 6, showing average financial strength.
The Magnum Ice Cream Company N.V. Scores
- No data available.
- No data available.
Which company has the best scores?
General Mills, Inc. provides measurable scores with a moderate Altman Z-Score and an average Piotroski Score. The Magnum Ice Cream Company N.V. lacks available score data for comparison.
Grades Comparison
Here is a comparison of the available grades for General Mills, Inc. and The Magnum Ice Cream Company N.V.:
General Mills, Inc. Grades
The table below shows the latest grades assigned by reputable financial institutions for General Mills, Inc.:
| Grading Company | Action | New Grade | Date |
|---|---|---|---|
| Wells Fargo | Maintain | Equal Weight | 2026-01-05 |
| Morgan Stanley | Maintain | Underweight | 2025-12-22 |
| Wells Fargo | Maintain | Equal Weight | 2025-12-18 |
| TD Cowen | Maintain | Hold | 2025-12-18 |
| Bernstein | Maintain | Market Perform | 2025-12-18 |
| TD Cowen | Maintain | Hold | 2025-12-15 |
| Wells Fargo | Maintain | Equal Weight | 2025-12-12 |
| Stifel | Maintain | Buy | 2025-12-11 |
| Jefferies | Maintain | Hold | 2025-12-11 |
| Mizuho | Maintain | Neutral | 2025-09-19 |
The overall trend for General Mills shows a consensus around Hold to Equal Weight, with a few Buy and Underweight ratings indicating a neutral to slightly cautious outlook.
The Magnum Ice Cream Company N.V. Grades
No reliable grading data is available for The Magnum Ice Cream Company N.V. from verifiable grading companies.
Which company has the best grades?
General Mills, Inc. has received multiple grades from recognized institutions, mostly holding a neutral consensus, while The Magnum Ice Cream Company N.V. lacks any reliable grading data. Investors may see this as greater visibility and coverage for General Mills, which could influence perceived risk and decision-making.
Strengths and Weaknesses
The following table summarizes the key strengths and weaknesses of General Mills, Inc. (GIS) and The Magnum Ice Cream Company N.V. (MICC) based on their latest financial and strategic data.
| Criterion | General Mills, Inc. (GIS) | The Magnum Ice Cream Company N.V. (MICC) |
|---|---|---|
| Diversification | Highly diversified product portfolio including snacks (4.19B USD), cereals (3.08B USD), pet segment (2.59B USD), and more | Focused on super-premium ice cream segment; less diversified |
| Profitability | Strong net margin at 11.78%, ROE at 24.95%, with stable dividend yield (4.52%) | Moderate net margin (5.66%), good ROE (16.2%), low dividend yield (0.12%) |
| Innovation | Consistent investments in product innovation across segments | Innovation focused on premium ice cream, with stable ROIC but neutral growth |
| Global presence | Established global footprint with broad market access | Smaller scale and more regional focus, limiting global reach |
| Market Share | Leading positions in multiple food categories | Niche player in premium ice cream market |
In summary, General Mills demonstrates strong diversification and profitability with a very favorable competitive moat and growing returns. Magnum Ice Cream shows favorable profitability metrics but is less diversified and has a stable, not growing, ROIC. Investors should weigh GIS’s broader stability against MICC’s focused premium niche.
Risk Analysis
Below is a comparison of key risks for General Mills, Inc. (GIS) and The Magnum Ice Cream Company N.V. (MICC) based on the most recent data available.
| Metric | General Mills, Inc. (GIS) | The Magnum Ice Cream Company N.V. (MICC) |
|---|---|---|
| Market Risk | Moderate, beta near zero (-0.068) indicating low market volatility exposure | Low, beta is 0, indicating minimal market correlation |
| Debt level | High debt-to-equity ratio (1.66), signaling elevated leverage risk | Very low debt-to-equity (0.07), low leverage risk |
| Regulatory Risk | Moderate, U.S. food industry subject to evolving regulations | Moderate, EU regulations on food safety and labeling apply |
| Operational Risk | Medium, large global footprint with 34K employees and multiple segments | Medium, smaller scale but focused on ice cream business with 18.5K employees |
| Environmental Risk | Moderate, exposure due to agricultural supply chain and packaging waste | Moderate, environmental impact related to dairy sourcing and packaging |
| Geopolitical Risk | Moderate, U.S.-centric with some international exposure | Moderate, headquartered in Netherlands with exposure to European market uncertainties |
The most likely and impactful risks are GIS’s high debt level and MICC’s regulatory environment in Europe. GIS’s leverage could pressure financial stability amid market fluctuations, while MICC faces challenges adapting to stringent EU food regulations. Both companies maintain moderate operational and environmental risks given their industry and scale.
Which Stock to Choose?
General Mills, Inc. (GIS) shows a slight decline in revenue and profitability over recent years, with an unfavorable income statement despite favorable net margin and ROE ratios. The company carries moderate debt with a net debt to EBITDA of 3.81 and holds a very favorable overall rating (A-). Its MOAT evaluation is very favorable, indicating durable competitive advantage and growing ROIC.
The Magnum Ice Cream Company N.V. (MICC) posts moderate revenue growth but faces unfavorable net margin trends and EPS declines. Financial ratios are mostly favorable, including a low debt-to-equity ratio of 0.07 and a favorable ROIC exceeding WACC. Its overall rating is very favorable (B-), and the MOAT status is favorable with stable profitability.
For investors prioritizing strong economic moats and durable competitive advantages, GIS might appear more attractive due to its very favorable MOAT and higher rating despite some income weaknesses. Conversely, MICC could appeal to those valuing lower leverage and stable profitability with favorable financial ratios, fitting a moderate risk profile. Ultimately, the choice could depend on the investor’s risk tolerance and preference for growth durability versus financial stability.
Disclaimer: Investment carries a risk of loss of initial capital. The past performance is not a reliable indicator of future results. Be sure to understand risks before making an investment decision.
Go Further
I encourage you to read the complete analyses of General Mills, Inc. and The Magnum Ice Cream Company N.V. to enhance your investment decisions: