The Kraft Heinz Company (KHC) and General Mills, Inc. (GIS) are two giants in the packaged foods industry, each with a rich heritage and extensive global reach. Both companies compete in overlapping markets, offering a diverse portfolio of consumer staples while pursuing innovation to capture evolving tastes and health trends. This comparison will help you identify which company presents the most compelling investment opportunity in today’s dynamic food sector.
Table of contents
Companies Overview
I will begin the comparison between The Kraft Heinz Company and General Mills, Inc. by providing an overview of these two companies and their main differences.
The Kraft Heinz Company Overview
The Kraft Heinz Company, headquartered in Pittsburgh, Pennsylvania, operates in the packaged foods industry. Founded in 1869, its mission involves manufacturing and marketing a wide range of food and beverage products, including condiments, cheese, meals, and snacks. The company distributes through various channels such as grocery stores, convenience stores, and online platforms, serving markets in the US, Canada, the UK, and internationally.
General Mills, Inc. Overview
General Mills, Inc., based in Minneapolis, Minnesota, is a global manufacturer and marketer of branded consumer foods. Established in 1866, it operates through multiple segments including retail and foodservice, offering products like cereals, snacks, yogurt, and pet food. The company sells through a diverse network including grocery stores, mass merchandisers, and foodservice distributors, and maintains a presence in numerous international markets.
Key similarities and differences
Both companies operate in the packaged foods sector with extensive product portfolios and global distribution networks. Kraft Heinz emphasizes condiments and beverages, while General Mills has a broader range including pet food and frozen products. Both sell through multiple channels, but General Mills operates more segments and has a larger variety of brands. Their market caps are close, with Kraft Heinz at 27.7B and General Mills at 23.7B.
Income Statement Comparison
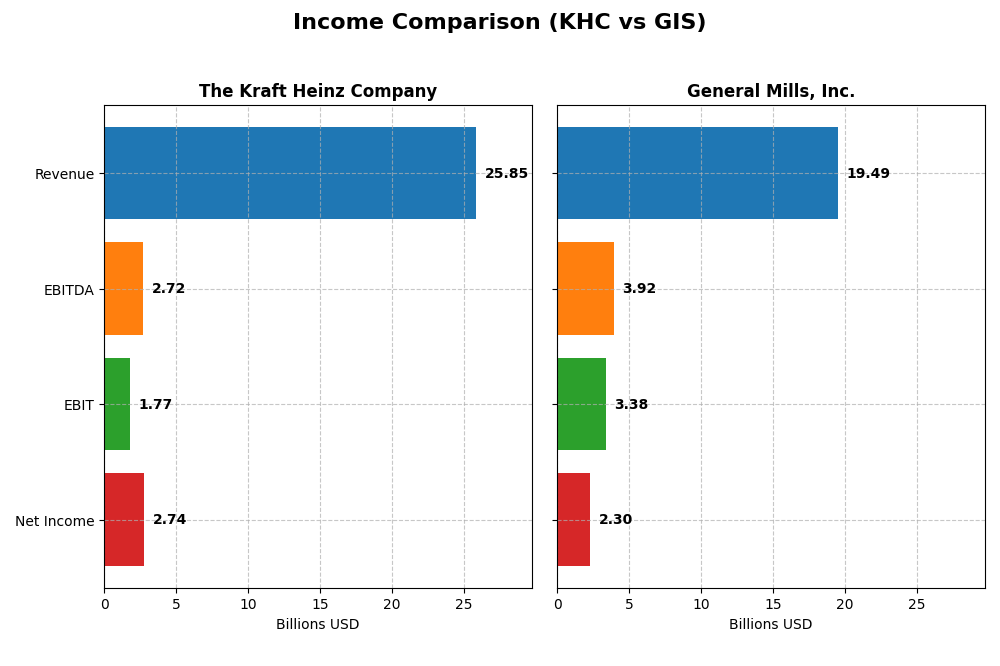
Below is the income statement comparison for The Kraft Heinz Company and General Mills, Inc. based on their most recent fiscal year data.
| Metric | The Kraft Heinz Company | General Mills, Inc. |
|---|---|---|
| Market Cap | 27.7B | 23.7B |
| Revenue | 25.8B | 19.5B |
| EBITDA | 2.72B | 3.92B |
| EBIT | 1.77B | 3.38B |
| Net Income | 2.74B | 2.29B |
| EPS | 2.27 | 4.12 |
| Fiscal Year | 2024 | 2025 |
Income Statement Interpretations
The Kraft Heinz Company
Over 2020-2024, Kraft Heinz’s revenue slightly declined by 1.29% overall, with a 2.98% drop in the most recent year. Net income, however, surged by 670.79% over the period, showing strong bottom-line growth despite slower revenue. Gross margins remained favorable at 34.7%, while EBIT margin was stable. In 2024, net margin slightly contracted and EPS dipped, reflecting some recent operational challenges.
General Mills, Inc.
General Mills experienced a modest overall revenue growth of 7.5% from 2021 to 2025 but faced a 1.87% revenue decline last year. Net income decreased by 1.91% over the full period, with net margin and EBIT margin both favorable though slightly weakening recently. The 2025 fiscal year showed pressure on profitability, with EPS falling 4.87% and net margin contracting by 6.32%, signaling margin compression.
Which one has the stronger fundamentals?
Kraft Heinz shows stronger net income growth and improving margins over the longer term, despite recent revenue softness and EBIT decline. General Mills posts steadier revenue growth but declining net income and margin pressures. While both have favorable gross margins and interest expenses, Kraft Heinz’s notable net income expansion contrasts with General Mills’ more mixed profitability trends, resulting in divergent fundamental profiles.
Financial Ratios Comparison
The table below presents the latest available financial ratios for The Kraft Heinz Company and General Mills, Inc. to facilitate a clear comparison of their recent financial performance.
| Ratios | The Kraft Heinz Company (KHC) | General Mills, Inc. (GIS) |
|---|---|---|
| ROE | 5.58% | 26.57% |
| ROIC | 6.61% | 10.61% |
| P/E | 13.53 | 15.74 |
| P/B | 0.75 | 4.18 |
| Current Ratio | 1.06 | 0.65 |
| Quick Ratio | 0.59 | 0.38 |
| D/E (Debt-to-Equity) | 0.40 | 1.42 |
| Debt-to-Assets | 22.5% | 42.3% |
| Interest Coverage | 1.85 | 6.82 |
| Asset Turnover | 0.29 | 0.63 |
| Fixed Asset Turnover | 3.61 | 4.69 |
| Payout Ratio | 70.4% | 54.6% |
| Dividend Yield | 5.20% | 3.47% |
Interpretation of the Ratios
The Kraft Heinz Company
The Kraft Heinz Company shows a mix of strong and weak ratios, with favorable net margin (10.62%) and valuation metrics like PE (13.53) and PB (0.75). However, return on equity (5.58%) and interest coverage (1.94) are less encouraging. Its dividend yield is steady at 5.2%, supported by consistent payouts, though cash flow coverage and buybacks require monitoring for sustainability.
General Mills, Inc.
General Mills presents generally favorable profitability ratios, including a strong ROE at 24.95% and net margin of 11.78%. The company’s dividend yield stands at 4.52%, backed by solid free cash flow generation and manageable payout ratios. Some liquidity measures and debt-to-equity (1.66) ratios are less favorable, highlighting areas for cautious observation.
Which one has the best ratios?
Both companies have an equal proportion of favorable ratios (50%) and similar global opinions of “slightly favorable.” General Mills excels in profitability and interest coverage, while Kraft Heinz benefits from better valuation and leverage metrics. Each shows specific weaknesses, making neither unequivocally superior across all financial aspects.
Strategic Positioning
This section compares the strategic positioning of The Kraft Heinz Company and General Mills, Inc. in terms of Market position, Key segments, and Exposure to technological disruption:
The Kraft Heinz Company
- Market leader in packaged foods with broad international reach; faces competitive pressure in condiments and meals segments.
- Key segments include Taste Elevation, Easy Ready Meals, Meats, Cheese and dairy, and Hydration products driving revenue.
- Exposure to technological disruption is moderate, focusing on product innovation and e-commerce channels without explicit tech-driven disruption risk.
General Mills, Inc.
- Established player in packaged foods with diverse geographic segments; competition spans retail, foodservice, and pet food markets.
- Operates five segments: North America Retail, Convenience Stores & Foodservice, Europe & Australia, Asia & Latin America, and Pet products.
- Moderate exposure with innovation in organic and pet food categories; extensive distribution through multiple retail and foodservice channels.
The Kraft Heinz Company vs General Mills, Inc. Positioning
KHC focuses on diversified food categories such as condiments and meals, leveraging global sales networks, while GIS maintains a broad product portfolio including pet food and geographic segmentation. KHC’s strength lies in taste-driven products; GIS benefits from segment diversification but both face similar competitive pressures.
Which has the best competitive advantage?
Both KHC and GIS show very favorable MOAT evaluations with growing ROIC above WACC, indicating durable competitive advantages. GIS displays a higher ROIC premium but KHC’s ROIC growth rate is more pronounced, reflecting strong value creation in both firms.
Stock Comparison
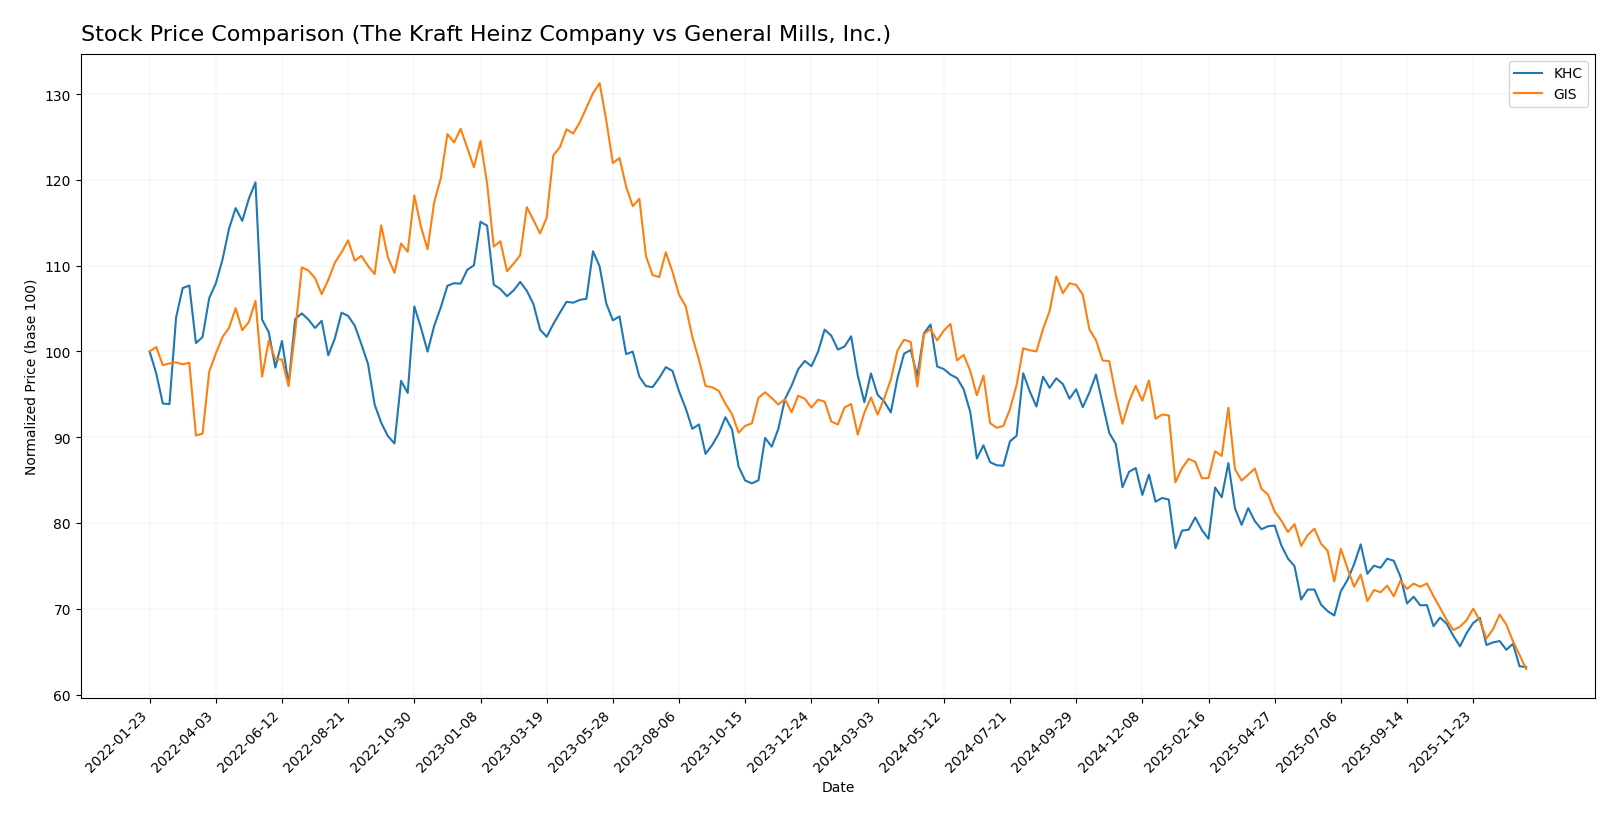
The stock price chart illustrates a significant bearish trend over the past 12 months for both The Kraft Heinz Company and General Mills, Inc., with accelerating declines and notable price volatility shaping their trading dynamics.
Trend Analysis
The Kraft Heinz Company (KHC) experienced a 35.12% price decline over the past year, indicating a bearish trend with acceleration. The stock fluctuated between a high of 38.16 and a low of 23.39, showing moderate volatility with a standard deviation of 4.13.
General Mills, Inc. (GIS) showed a 33.44% decrease in stock price over the last 12 months, also reflecting a bearish trend with acceleration. The price ranged from 75.06 to 43.48, accompanied by higher volatility, evidenced by a standard deviation of 8.84.
Comparing both stocks, KHC and GIS have delivered similar bearish performances, with KHC slightly underperforming GIS in percentage terms over the analyzed period.
Target Prices
The current analyst consensus reveals moderate upside potential for both The Kraft Heinz Company and General Mills, Inc.
| Company | Target High | Target Low | Consensus |
|---|---|---|---|
| The Kraft Heinz Company | 28 | 24 | 26.29 |
| General Mills, Inc. | 63 | 47 | 52.2 |
Analysts expect Kraft Heinz shares to rise slightly above the current price of $23.39, while General Mills shows a stronger upside with targets well above its current $43.48 level, indicating more bullish sentiment.
Analyst Opinions Comparison
This section compares analysts’ ratings and grades for The Kraft Heinz Company and General Mills, Inc.:
Rating Comparison
KHC Rating
- Rating: B- with a very favorable overall status.
- Discounted Cash Flow Score: 5, very favorable.
- ROE Score: 1, very unfavorable.
- ROA Score: 1, very unfavorable.
- Debt To Equity Score: 3, moderate.
- Overall Score: 3, moderate.
GIS Rating
- Rating: A- with a very favorable overall status.
- Discounted Cash Flow Score: 5, very favorable.
- ROE Score: 5, very favorable.
- ROA Score: 4, favorable.
- Debt To Equity Score: 1, very unfavorable.
- Overall Score: 4, favorable.
Which one is the best rated?
Based strictly on the provided data, General Mills (GIS) is better rated overall with an A- rating and higher scores in ROE, ROA, and overall score compared to Kraft Heinz (KHC), despite GIS’s less favorable debt to equity score.
Scores Comparison
The scores comparison between The Kraft Heinz Company and General Mills, Inc. is as follows:
KHC Scores
- Altman Z-Score: 0.44, in distress zone indicating high bankruptcy risk.
- Piotroski Score: 6, classified as average financial strength.
GIS Scores
- Altman Z-Score: 2.43, in grey zone indicating moderate bankruptcy risk.
- Piotroski Score: 6, classified as average financial strength.
Which company has the best scores?
Based on the provided data, General Mills has a higher Altman Z-Score, placing it in a safer grey zone compared to Kraft Heinz’s distress zone. Both have the same average Piotroski Score of 6, indicating similar financial strength.
Grades Comparison
Here is a comparison of recent grades assigned to The Kraft Heinz Company and General Mills, Inc.:
The Kraft Heinz Company Grades
The following table summarizes recent grades from major grading companies for Kraft Heinz:
| Grading Company | Action | New Grade | Date |
|---|---|---|---|
| Piper Sandler | Maintain | Neutral | 2025-12-15 |
| Barclays | Maintain | Equal Weight | 2025-10-31 |
| JP Morgan | Maintain | Neutral | 2025-10-30 |
| UBS | Maintain | Neutral | 2025-10-30 |
| TD Cowen | Maintain | Hold | 2025-10-30 |
| Evercore ISI Group | Maintain | In Line | 2025-10-30 |
| Piper Sandler | Maintain | Neutral | 2025-10-30 |
| Wells Fargo | Maintain | Equal Weight | 2025-10-30 |
| Mizuho | Maintain | Neutral | 2025-10-28 |
| UBS | Maintain | Neutral | 2025-10-08 |
Overall, Kraft Heinz’s grades consistently indicate a neutral to hold stance with no upgrades or downgrades, reflecting stable but cautious sentiment.
General Mills, Inc. Grades
The following table presents recent grades from key grading companies for General Mills:
| Grading Company | Action | New Grade | Date |
|---|---|---|---|
| Wells Fargo | Maintain | Equal Weight | 2026-01-05 |
| Morgan Stanley | Maintain | Underweight | 2025-12-22 |
| Wells Fargo | Maintain | Equal Weight | 2025-12-18 |
| TD Cowen | Maintain | Hold | 2025-12-18 |
| Bernstein | Maintain | Market Perform | 2025-12-18 |
| TD Cowen | Maintain | Hold | 2025-12-15 |
| Wells Fargo | Maintain | Equal Weight | 2025-12-12 |
| Stifel | Maintain | Buy | 2025-12-11 |
| Jefferies | Maintain | Hold | 2025-12-11 |
| Mizuho | Maintain | Neutral | 2025-09-19 |
General Mills shows a slightly wider range of opinions, including buy and underweight ratings, indicating some mixed but generally cautious views.
Which company has the best grades?
Both companies share a consensus rating of “Hold,” but General Mills has a few “Buy” and “Market Perform” grades, whereas Kraft Heinz’s grades remain strictly neutral or hold. This suggests a marginally more positive outlook for General Mills, potentially influencing investor sentiment towards moderate growth opportunities.
Strengths and Weaknesses
Below is a comparative table highlighting key strengths and weaknesses of The Kraft Heinz Company (KHC) and General Mills, Inc. (GIS) based on recent financial and operational data.
| Criterion | The Kraft Heinz Company (KHC) | General Mills, Inc. (GIS) |
|---|---|---|
| Diversification | Broad product range including meals, dairy, coffee, condiments, and snacks; strong in Taste Elevation category with $11.4B revenue in 2024 | Diversified portfolio with strong presence in snacks, cereals, pet segment, and convenient meals; top revenue from snacks ($4.18B) and cereals ($3.08B) |
| Profitability | Net margin 10.62% (favorable); ROIC 6.61% (neutral); ROE low at 5.58% (unfavorable) | Strong profitability with net margin 11.78%, ROE 24.95%, ROIC 9.62% (neutral) |
| Innovation | Moderate innovation with stable product categories; less emphasis on fast-growing segments | Slightly better innovation indicated by product mix including super-premium ice cream and pet segment growth |
| Global presence | Strong global footprint with various product lines, but moderate asset turnover (0.29, unfavorable) | Good global reach with higher asset turnover (0.59, neutral), indicating better asset utilization |
| Market Share | Large share in condiments and sauces; stable but moderate growth in ambient meals and cheeses | Strong market share in snacks and cereals; growing segments in pet products and convenient meals |
Key takeaways: Both companies demonstrate solid diversification and profitability, with GIS showing stronger return on equity and asset utilization. KHC benefits from a broader Taste Elevation portfolio but faces challenges in asset turnover and ROE. GIS’s focus on growing segments like pet products adds to its innovation edge. Investors should weigh KHC’s stable value creation against GIS’s higher profitability and growth potential.
Risk Analysis
Below is a comparative table of key risks for The Kraft Heinz Company (KHC) and General Mills, Inc. (GIS) based on the most recent data from 2025-2026.
| Metric | The Kraft Heinz Company (KHC) | General Mills, Inc. (GIS) |
|---|---|---|
| Market Risk | Low beta (0.065) suggests low volatility | Negative beta (-0.068) indicates possible inverse market movement |
| Debt level | Moderate debt-to-equity (0.4), favorable debt ratios | High debt-to-equity (1.66), unfavorable debt position |
| Regulatory Risk | Moderate; food industry regulations apply globally | Moderate; similar regulatory exposure as KHC |
| Operational Risk | Somewhat unfavorable asset turnover and interest coverage | Better interest coverage (6.16) but low liquidity ratios |
| Environmental Risk | Exposure to sustainability pressures in packaged foods | Similar exposure; growing demand for organic and sustainable products |
| Geopolitical Risk | Moderate; global supply chain dependencies | Moderate; operates worldwide with diverse markets |
The most significant risks are KHC’s weak liquidity and interest coverage, which raise concerns about short-term financial flexibility, and GIS’s high debt level, which increases financial risk despite strong profitability. Both companies face moderate regulatory and environmental risks inherent in the global packaged foods sector.
Which Stock to Choose?
The Kraft Heinz Company (KHC) shows a mixed income evolution with overall net income growth of 671% over 2020-2024, despite recent revenue declines. Its financial ratios are slightly favorable, with strong valuation metrics but weaker profitability and interest coverage. Debt levels remain moderate and the company holds a very favorable moat rating reflecting durable competitive advantage, though Altman Z-Score signals financial distress.
General Mills, Inc. (GIS) displays a neutral to unfavorable income trend, with modest revenue growth but declining net income over 2021-2025. Financial ratios are slightly favorable overall, supported by strong profitability and interest coverage but burdened by high debt-to-equity. GIS has a very favorable moat with growing ROIC and profitability, and a grey zone Altman Z-Score indicating moderate financial risk.
Investors seeking growth potential might find KHC’s improving profitability and strong economic moat appealing, despite its financial distress signals. Conversely, those prioritizing consistent profitability and a robust balance sheet may view GIS’s stable moat and favorable profitability ratios as more suitable, despite higher leverage and weaker income growth. The choice could depend on tolerance for financial risk and investment horizon.
Disclaimer: Investment carries a risk of loss of initial capital. The past performance is not a reliable indicator of future results. Be sure to understand risks before making an investment decision.
Go Further
I encourage you to read the complete analyses of The Kraft Heinz Company and General Mills, Inc. to enhance your investment decisions: