General Mills, Inc. (GIS) and The J. M. Smucker Company (SJM) are two leading players in the packaged foods industry, both with strong footprints in consumer staples and innovation-driven product portfolios. While General Mills boasts a diverse range of food and pet products globally, Smucker focuses on branded food, coffee, and pet care in the U.S. This comparison aims to help investors identify which company aligns better with their portfolio goals and risk appetite. Let’s explore which is the smarter buy today.
Table of contents
Companies Overview
I will begin the comparison between General Mills and The J. M. Smucker Company by providing an overview of these two companies and their main differences.
General Mills Overview
General Mills, Inc. is a major player in the packaged foods industry, manufacturing and marketing branded consumer foods globally. The company operates through five segments covering North America, Europe, Asia, Latin America, and pet foods. Its diverse product portfolio includes cereals, snacks, refrigerated and frozen foods, and pet food, marketed under well-known brands like Cheerios, Betty Crocker, and Blue Buffalo. Founded in 1866, General Mills is headquartered in Minneapolis and employs 34,000 people.
The J. M. Smucker Company Overview
The J. M. Smucker Company focuses on branded food and beverage products worldwide, segmented into U.S. Retail Pet Foods, Coffee, and Consumer Foods. Its offerings include coffee, peanut butter, fruit spreads, pet food, and snacks under brands such as Folgers, Jif, and Meow Mix. Founded in 1897 and based in Orrville, Ohio, Smucker employs around 9,000 staff and emphasizes direct sales alongside brokers to diverse retail channels.
Key similarities and differences
Both companies operate in the consumer defensive sector within packaged foods, offering pet food alongside human food products. General Mills has a broader international footprint with five operating segments, while Smucker is more U.S.-focused with three segments. General Mills employs nearly four times more staff and offers a wider range of product categories, whereas Smucker concentrates strongly on coffee and pet food as core areas. Both rely on established brand portfolios and multi-channel distribution strategies.
Income Statement Comparison
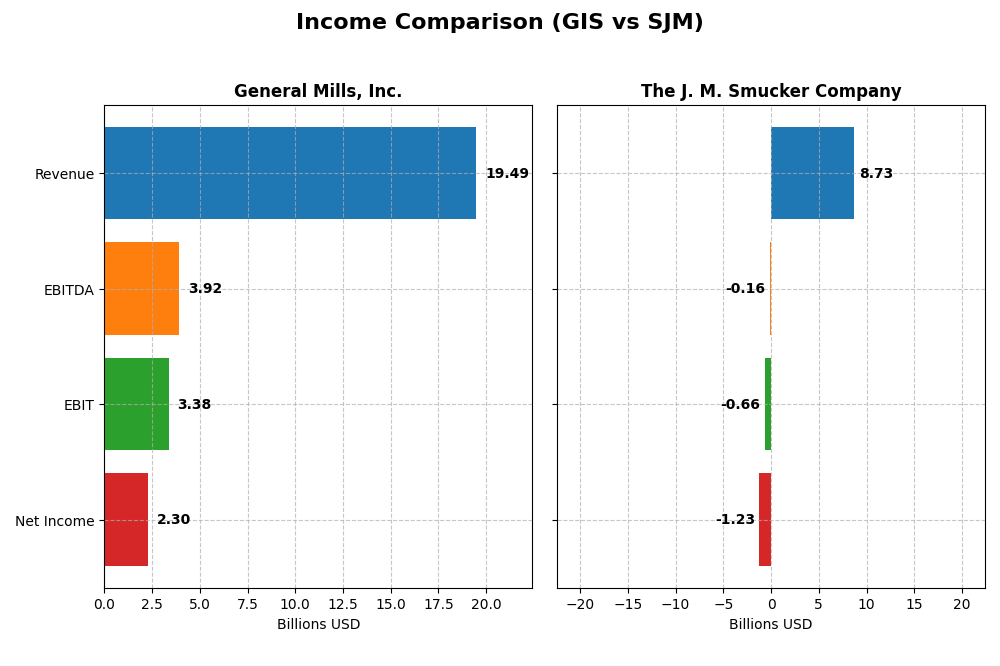
Below is a side-by-side comparison of key income statement metrics for General Mills, Inc. and The J. M. Smucker Company for the most recent fiscal year.
| Metric | General Mills, Inc. (GIS) | The J. M. Smucker Company (SJM) |
|---|---|---|
| Market Cap | 23.7B | 10.7B |
| Revenue | 19.5B | 8.7B |
| EBITDA | 3.9B | -156M |
| EBIT | 3.4B | -658M |
| Net Income | 2.3B | -1.2B |
| EPS | 4.12 | -11.57 |
| Fiscal Year | 2025 | 2025 |
Income Statement Interpretations
General Mills, Inc.
General Mills experienced modest revenue growth of 7.5% over 2021-2025 but a slight decline of 1.87% in the latest year. Net income decreased overall by 1.91% with a 6.32% drop in net margin last year. Despite this, the company maintains favorable gross and EBIT margins near 34.5% and 17.4%, respectively, though recent earnings per share dipped by 4.87%.
The J. M. Smucker Company
Smucker’s revenue grew 9.04% over five years and 6.69% in the last year, signaling moderate expansion. However, net income sharply declined by 240.45% overall, with net margin falling to -14.1% in 2025. EBIT margin turned negative at -7.54%, reflecting operational challenges despite a favorable gross margin near 38.8%, and EPS dropped significantly by 262.27% last year.
Which one has the stronger fundamentals?
Both companies show unfavorable overall income statement trends, but General Mills presents stronger fundamentals with positive margins, controlled interest expenses, and only slight recent declines. Smucker faces deeper profitability issues, including negative net and EBIT margins and severe earnings deterioration. Thus, General Mills currently holds relatively stronger income statement metrics.
Financial Ratios Comparison
The table below presents key financial ratios for General Mills, Inc. (GIS) and The J. M. Smucker Company (SJM) based on their most recent fiscal year data, providing a snapshot of their profitability, liquidity, leverage, and market valuation.
| Ratios | General Mills, Inc. (GIS) | The J. M. Smucker Company (SJM) |
|---|---|---|
| ROE | 24.95% | -20.23% |
| ROIC | 9.62% | -5.09% |
| P/E | 12.90 | -10.05 |
| P/B | 3.22 | 2.03 |
| Current Ratio | 0.67 | 0.81 |
| Quick Ratio | 0.43 | 0.35 |
| D/E (Debt-to-Equity) | 1.66 | 1.28 |
| Debt-to-Assets | 46.25% | 44.19% |
| Interest Coverage | 6.02 | -1.88 |
| Asset Turnover | 0.59 | 0.50 |
| Fixed Asset Turnover | 4.83 | 2.73 |
| Payout Ratio | 58.33% | -37.00% |
| Dividend Yield | 4.52% | 3.68% |
Interpretation of the Ratios
General Mills, Inc.
General Mills shows a generally strong financial profile with favorable net margin (11.78%) and return on equity (24.95%), but some weaknesses include a low current ratio (0.67) and high debt-to-equity ratio (1.66), indicating liquidity and leverage concerns. Its dividend yield is attractive at 4.52%, supported by a stable payout, though the payout ratio and buyback programs should be monitored for sustainability.
The J. M. Smucker Company
Smucker’s financial ratios reveal weaknesses, including negative net margin (-14.1%) and return on equity (-20.23%), indicating profitability challenges. Liquidity is also weak, with a current ratio of 0.81 and quick ratio of 0.35. Despite this, it maintains a dividend yield of 3.68%, yet ongoing negative earnings may question long-term dividend sustainability and require careful monitoring of cash flows and debt levels.
Which one has the best ratios?
General Mills has the more favorable ratio profile, with half of its metrics rated positively and solid profitability indicators, despite some liquidity and leverage issues. In contrast, The J. M. Smucker Company faces significant unfavorable ratios, notably negative profitability measures and weak liquidity, leading to an overall unfavorable evaluation.
Strategic Positioning
This section compares the strategic positioning of General Mills, Inc. (GIS) and The J. M. Smucker Company (SJM) in terms of market position, key segments, and exposure to technological disruption:
General Mills, Inc.
- Leading packaged foods company with broad global reach and significant competitive pressures.
- Diverse segments including cereals, snacks, pet food, yogurt, baking mixes, and super-premium ice cream.
- Limited explicit exposure to technological disruption mentioned in available data.
The J. M. Smucker Company
- Mid-sized packaged foods firm focused mainly on U.S. retail markets with moderate competition.
- Concentrated in U.S. retail pet foods, coffee, sweet baked snacks, and consumer foods.
- No direct mention of technological disruption exposure in provided information.
General Mills, Inc. vs The J. M. Smucker Company Positioning
General Mills maintains a diversified portfolio across multiple food and pet segments globally, enhancing resilience but increasing complexity. Smucker concentrates on U.S. retail segments, which may simplify focus but limits geographic and product diversification.
Which has the best competitive advantage?
Based on MOAT evaluation, General Mills exhibits a very favorable moat with growing ROIC above WACC, indicating durable competitive advantage. In contrast, Smucker shows a very unfavorable moat with declining ROIC and value destruction, reflecting weaker competitive positioning.
Stock Comparison
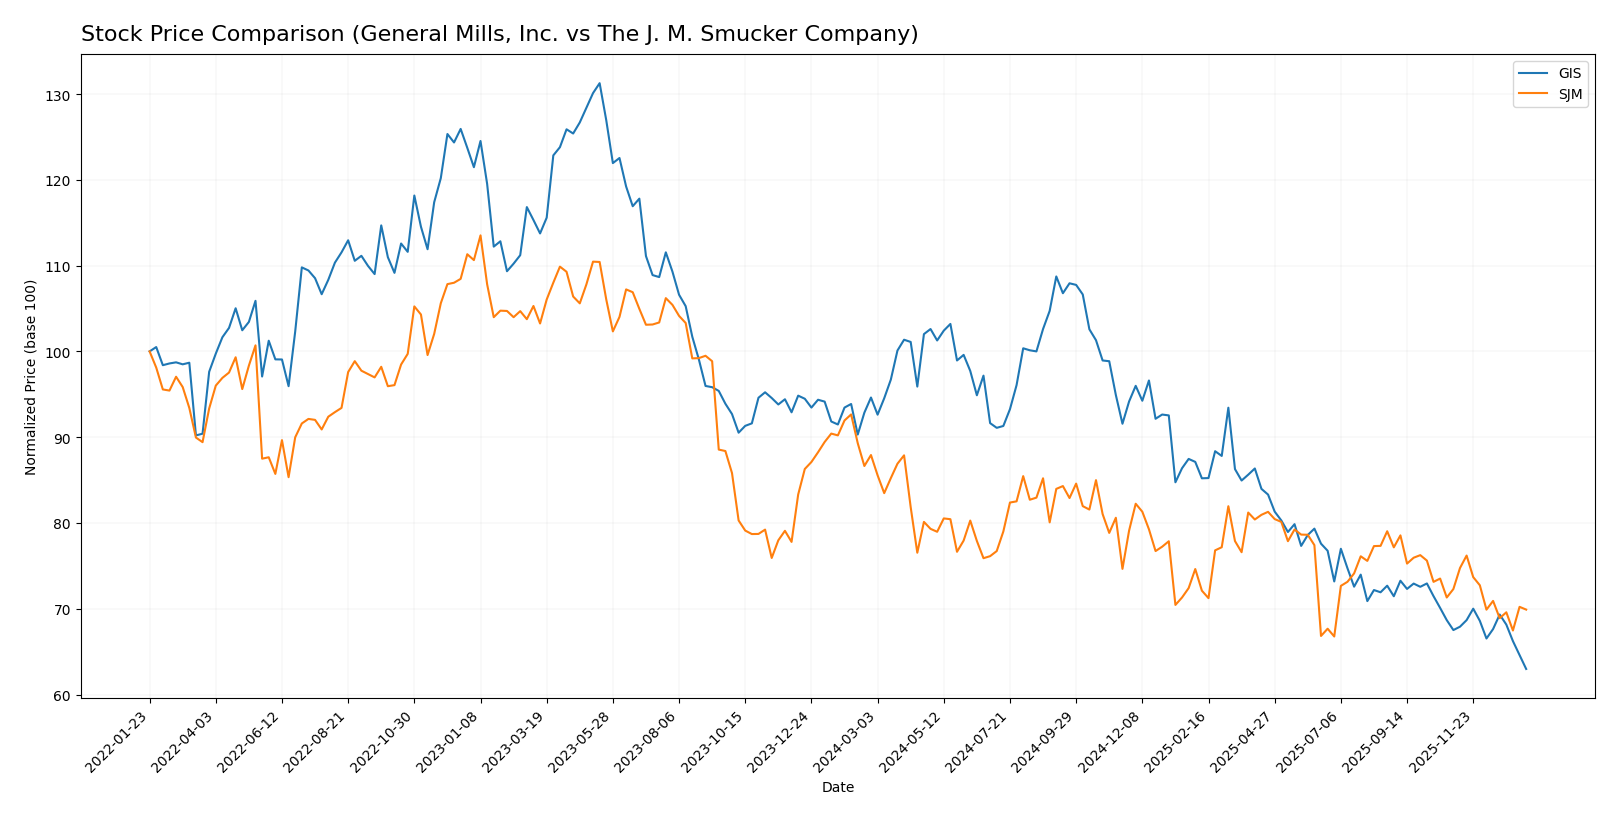
The stock price movements of General Mills, Inc. (GIS) and The J. M. Smucker Company (SJM) over the past 12 months reveal distinct bearish trends with varying intensities and trading volumes, reflecting different market reactions and momentum shifts.
Trend Analysis
General Mills, Inc. (GIS) experienced a significant bearish trend over the past year, with a price decline of 33.44%. The trend shows acceleration and high volatility, with prices ranging from a high of 75.06 to a low of 43.48.
The J. M. Smucker Company (SJM) also faced a bearish trend, but less severe, with a 20.49% price decrease over the same period. This trend shows deceleration and moderate volatility, with prices fluctuating between 125.92 and 95.63.
Comparing the two, GIS delivered the lower market performance with a sharper decline and accelerating downward momentum, while SJM’s decline was more moderate and decelerating.
Target Prices
Analysts present a clear consensus with defined target price ranges for both General Mills, Inc. and The J. M. Smucker Company.
| Company | Target High | Target Low | Consensus |
|---|---|---|---|
| General Mills, Inc. | 63 | 47 | 52.2 |
| The J. M. Smucker Company | 117 | 110 | 113.4 |
The consensus target prices for General Mills and Smucker exceed current market prices, signaling analysts expect moderate to strong upside potential. Investors should weigh this against current valuations and volatility.
Analyst Opinions Comparison
This section compares analysts’ ratings and grades for General Mills, Inc. (GIS) and The J. M. Smucker Company (SJM):
Rating Comparison
GIS Rating
- Rating: A- rating indicates a very favorable standing.
- Discounted Cash Flow Score: 5, showing very favorable DCF analysis.
- ROE Score: 5, very favorable, indicating efficient profit generation.
- ROA Score: 4, favorable, showing effective asset utilization.
- Debt To Equity Score: 1, very unfavorable, indicating higher financial risk.
- Overall Score: 4, favorable overall financial assessment.
SJM Rating
- Rating: C+ rating, classified as very favorable.
- Discounted Cash Flow Score: 5, also very favorable.
- ROE Score: 1, very unfavorable, reflecting weak equity returns.
- ROA Score: 1, very unfavorable, poor asset efficiency.
- Debt To Equity Score: 1, very unfavorable, similarly high financial risk.
- Overall Score: 2, moderate overall financial assessment.
Which one is the best rated?
Based strictly on the data, GIS holds a stronger financial profile with better ROE, ROA, and overall scores, despite both having the same unfavorable debt-to-equity score. SJM lags with lower profitability and asset return metrics.
Scores Comparison
The companies’ financial health scores are compared below:
GIS Scores
- Altman Z-Score: 2.43, in grey zone, indicating moderate bankruptcy risk.
- Piotroski Score: 6, classified as average financial strength.
SJM Scores
- Altman Z-Score: 0.90, in distress zone, indicating high bankruptcy risk.
- Piotroski Score: 4, also classified as average financial strength.
Which company has the best scores?
Based strictly on the data, GIS has a higher Altman Z-Score, placing it in the grey zone versus SJM’s distress zone. Both have average Piotroski Scores, but GIS’s score is higher, indicating relatively better financial health.
Grades Comparison
Here is a detailed comparison of recent grades assigned to General Mills, Inc. and The J. M. Smucker Company by reputable grading firms:
General Mills, Inc. Grades
The following table summarizes recent grades and actions from established grading companies for General Mills, Inc.:
| Grading Company | Action | New Grade | Date |
|---|---|---|---|
| Wells Fargo | Maintain | Equal Weight | 2026-01-05 |
| Morgan Stanley | Maintain | Underweight | 2025-12-22 |
| Wells Fargo | Maintain | Equal Weight | 2025-12-18 |
| TD Cowen | Maintain | Hold | 2025-12-18 |
| Bernstein | Maintain | Market Perform | 2025-12-18 |
| TD Cowen | Maintain | Hold | 2025-12-15 |
| Wells Fargo | Maintain | Equal Weight | 2025-12-12 |
| Stifel | Maintain | Buy | 2025-12-11 |
| Jefferies | Maintain | Hold | 2025-12-11 |
| Mizuho | Maintain | Neutral | 2025-09-19 |
The overall trend for General Mills shows a consensus leaning towards Hold or Equal Weight ratings, with a few Buy recommendations and no recent downgrades.
The J. M. Smucker Company Grades
Below is a summary of recent grades and rating actions from recognized grading companies for The J. M. Smucker Company:
| Grading Company | Action | New Grade | Date |
|---|---|---|---|
| TD Cowen | Maintain | Hold | 2026-01-08 |
| Bernstein | Maintain | Market Perform | 2025-11-26 |
| Stifel | Maintain | Hold | 2025-11-26 |
| UBS | Maintain | Buy | 2025-11-26 |
| Morgan Stanley | Maintain | Overweight | 2025-11-26 |
| JP Morgan | Maintain | Overweight | 2025-11-26 |
| Stifel | Maintain | Hold | 2025-10-24 |
| Argus Research | Downgrade | Hold | 2025-09-12 |
| Barclays | Maintain | Equal Weight | 2025-08-29 |
| JP Morgan | Maintain | Overweight | 2025-08-28 |
The J. M. Smucker Company’s ratings show a stronger bias towards Buy and Overweight positions, with mostly stable or maintained ratings and one recent downgrade.
Which company has the best grades?
Between the two, The J. M. Smucker Company has received relatively more positive ratings, including multiple Buy and Overweight designations, compared to General Mills’ predominantly Hold and Equal Weight grades. This difference could influence investor sentiment regarding growth potential and risk appetite.
Strengths and Weaknesses
Below is a comparison of key strengths and weaknesses for General Mills, Inc. (GIS) and The J. M. Smucker Company (SJM) based on their latest financial and operational data.
| Criterion | General Mills, Inc. (GIS) | The J. M. Smucker Company (SJM) |
|---|---|---|
| Diversification | Broad product portfolio including snacks, cereals, pet food, and dairy segments generating diversified revenue streams. | Focused portfolio with strong emphasis on U.S. retail coffee, pet foods, and consumer foods; less diversified internationally. |
| Profitability | Favorable net margin (11.78%) and ROE (24.95%) indicate strong profitability. | Negative net margin (-14.1%) and ROE (-20.23%) point to profitability challenges. |
| Innovation | Consistent ROIC growth (+2.87% trend) shows efficient capital use and competitive advantage. | Declining ROIC (-172.19% trend) signals weakening capital efficiency and innovation. |
| Global presence | Strong global footprint with varied product segments including super-premium ice cream and snacks. | More limited global presence, primarily focused on U.S. market with some international exposure. |
| Market Share | Leading positions in multiple consumer packaged goods categories with robust revenue (e.g., $4.18B snacks). | Significant presence in pet foods and coffee in U.S., but shrinking profitability may affect market strength. |
In summary, General Mills demonstrates a durable competitive advantage with strong profitability, diverse product lines, and global reach, making it a more favorable investment. Conversely, Smucker faces profitability headwinds and declining returns, indicating higher risk in the current environment.
Risk Analysis
Below is a comparative risk table for General Mills, Inc. (GIS) and The J. M. Smucker Company (SJM) based on the most recent financial and market data from 2025:
| Metric | General Mills, Inc. (GIS) | The J. M. Smucker Company (SJM) |
|---|---|---|
| Market Risk | Low beta (-0.068) indicates low volatility versus market | Moderate beta (0.22) suggests mild market sensitivity |
| Debt level | High debt-to-equity ratio (1.66), moderate debt-to-assets (46.25%) | Elevated debt-to-equity (1.28), similar debt-to-assets (44.19%) but weaker coverage |
| Regulatory Risk | Moderate, operating globally with exposure in multiple regions | Moderate, with diversified product segments and geographic distribution |
| Operational Risk | Stable with diverse products and strong operational metrics | Higher operational risk due to negative margins and lower asset turnover |
| Environmental Risk | Standard industry exposure; no critical issues reported | Standard industry exposure; no critical issues reported |
| Geopolitical Risk | Moderate, given global operations in volatile regions | Moderate, primarily U.S. focused but with international supply chains |
In summary, Smucker faces the most impactful risks from poor profitability, negative returns, and financial distress signals (Altman Z-Score in distress zone), heightening bankruptcy risk. General Mills shows stronger financial health but carries notable debt risk and liquidity concerns. Investors should weigh Smucker’s operational and financial instability against General Mills’ higher leverage but overall favorable market position.
Which Stock to Choose?
General Mills, Inc. (GIS) shows a slightly unfavorable income trend with declining margins and EPS over recent years but maintains favorable profitability ratios including a 24.95% ROE and a strong interest coverage of 6.16. Its debt levels are moderately high, reflected in a 1.66 debt-to-equity ratio, and the overall rating is very favorable at A-.
The J. M. Smucker Company (SJM) faces unfavorable income metrics with negative net margins and declining profitability, evidenced by a -20.23% ROE and negative returns on invested capital. Despite a moderate debt-to-equity ratio of 1.28, financial ratios and ratings are largely unfavorable, with an overall rating of C+.
Investors prioritizing stable profitability and a durable competitive advantage might find GIS’s very favorable rating and positive ROIC trend suggestive of value creation, while those with a tolerance for risk and focus on potential turnaround scenarios might consider SJM’s current challenges and moderate market valuation.
Disclaimer: Investment carries a risk of loss of initial capital. The past performance is not a reliable indicator of future results. Be sure to understand risks before making an investment decision.
Go Further
I encourage you to read the complete analyses of General Mills, Inc. and The J. M. Smucker Company to enhance your investment decisions: