General Mills, Inc. (GIS) and Pilgrim’s Pride Corporation (PPC) are two prominent players in the packaged foods industry, each with distinct market approaches and product portfolios. While General Mills focuses on branded consumer foods and pet products worldwide, Pilgrim’s Pride specializes in poultry and pork products with a strong presence in foodservice and retail sectors. This comparison will help you identify which company aligns best with your investment goals.

Table of contents
Companies Overview
I will begin the comparison between General Mills, Inc. and Pilgrim’s Pride Corporation by providing an overview of these two companies and their main differences.
General Mills Overview
General Mills, Inc. is a global manufacturer and marketer of branded consumer foods, operating across five segments including North America Retail and Pet. The company offers a wide array of products such as cereals, yogurt, snacks, frozen foods, and pet food under well-known brands like Cheerios and Blue Buffalo. Headquartered in Minneapolis, it serves diverse retail and foodservice channels worldwide.
Pilgrim’s Pride Overview
Pilgrim’s Pride Corporation specializes in producing, processing, and distributing fresh, frozen, and value-added chicken and pork products. It markets its offerings under several brands including Pilgrim’s and Moy Park, serving retail and foodservice customers across the US and internationally. The company is headquartered in Greeley, Colorado, and operates as a subsidiary of JBS S.A.
Key similarities and differences
Both companies operate in the packaged foods industry within the consumer defensive sector, focusing on branded food products distributed to retail and foodservice markets. General Mills has a broader product portfolio spanning multiple food categories, including pet food, while Pilgrim’s Pride concentrates mainly on poultry and pork products. Their market caps and employee counts differ significantly, reflecting scale and operational scope variations.
Income Statement Comparison
The table below compares the key income statement metrics for General Mills, Inc. and Pilgrim’s Pride Corporation for their most recent fiscal years.

| Metric | General Mills, Inc. (GIS) | Pilgrim’s Pride Corporation (PPC) |
|---|---|---|
| Market Cap | 23.7B | 9.5B |
| Revenue | 19.5B | 17.9B |
| EBITDA | 3.9B | 2.0B |
| EBIT | 3.4B | 1.6B |
| Net Income | 2.3B | 1.1B |
| EPS | 4.12 | 4.58 |
| Fiscal Year | 2025 | 2024 |
Income Statement Interpretations
General Mills, Inc.
General Mills showed a modest revenue growth of 7.5% over 2021-2025, but net income declined by 1.91%. Margins weakened overall, with net margin falling 8.75% and EPS growth favorable at 8.47%. In 2025, revenue and gross profit dipped by about 2%, alongside a 6.32% net margin decrease, signaling some recent margin pressure despite generally favorable margin levels.
Pilgrim’s Pride Corporation
Pilgrim’s Pride experienced strong growth with revenue up 47.85% and net income surging over 1000% across 2020-2024. Margins improved significantly, especially net margin increasing 675% and EPS growth exceeding 1000%. The latest fiscal year (2024) saw a slight 3% revenue rise but strong gross profit, EBIT, and net margin growth, reflecting robust operational improvements and margin expansion.
Which one has the stronger fundamentals?
Pilgrim’s Pride displays stronger fundamentals with substantial revenue and net income growth, accompanied by marked margin improvements, particularly in net margin and EPS. General Mills presents more moderate revenue growth and declining net income and margins recently, despite maintaining favorable margin levels. Overall, Pilgrim’s Pride’s income statement reflects a more favorable trajectory over the observed periods.
Financial Ratios Comparison
The table below compares key financial ratios for General Mills, Inc. (GIS) and Pilgrim’s Pride Corporation (PPC) based on their most recent fiscal year data to provide a clear view of their financial performance and stability.
| Ratios | General Mills, Inc. (GIS) | Pilgrim’s Pride Corporation (PPC) |
|---|---|---|
| ROE | 25.0% | 25.6% |
| ROIC | 9.6% | 14.2% |
| P/E | 12.9 | 9.9 |
| P/B | 3.22 | 2.54 |
| Current Ratio | 0.67 | 2.01 |
| Quick Ratio | 0.43 | 1.31 |
| D/E (Debt-to-Equity) | 1.66 | 0.82 |
| Debt-to-Assets | 46.3% | 32.5% |
| Interest Coverage | 6.02 | 9.34 |
| Asset Turnover | 0.59 | 1.68 |
| Fixed Asset Turnover | 4.83 | 5.27 |
| Payout Ratio | 58.3% | 0% |
| Dividend Yield | 4.52% | 0% |
Interpretation of the Ratios
General Mills, Inc.
General Mills shows a mix of strong and weak ratios. It has favorable net margin (11.78%), ROE (24.95%), and interest coverage (6.16), but unfavorable liquidity ratios like current ratio (0.67) and quick ratio (0.43). Its payout yields a 4.52% dividend, supported by free cash flow, yet the high debt-to-equity (1.66) and price-to-book (3.22) ratios may raise concerns about leverage and valuation.
Pilgrim’s Pride Corporation
Pilgrim’s Pride exhibits mostly favorable ratios, including ROE at 25.63%, ROIC at 14.2%, and strong liquidity with a current ratio of 2.01. While it does not pay dividends, likely due to reinvestment or growth focus, its free cash flow position appears stable. Its low debt-to-equity (0.82) and favorable asset turnover (1.68) suggest operational efficiency and moderate leverage.
Which one has the best ratios?
Pilgrim’s Pride holds the edge with a higher proportion of favorable ratios (64.29%) compared to General Mills (50%), especially in liquidity and operational metrics. General Mills offers a dividend yield but faces more unfavorable liquidity and leverage ratios. Overall, Pilgrim’s Pride’s ratios suggest stronger financial health and operational efficiency.
Strategic Positioning
This section compares the strategic positioning of General Mills, Inc. and Pilgrim’s Pride Corporation in terms of market position, key segments, and exposure to technological disruption:
General Mills, Inc.
- Large market cap of 23.7B with diversified packaged foods; faces broad competitive pressure.
- Operates multiple segments including cereals, snacks, pet food, and meals, driven by branded consumer foods globally.
- No explicit mention of technological disruption exposure or innovation challenges.
Pilgrim’s Pride Corporation
- Smaller market cap of 9.5B focused on poultry and pork production; industry competition present.
- Concentrated on fresh, frozen, and value-added chicken and pork products, serving retail and foodservice.
- No explicit mention of technological disruption exposure or innovation challenges.
General Mills, Inc. vs Pilgrim’s Pride Corporation Positioning
General Mills exhibits a diversified product portfolio across multiple food categories, providing multiple revenue streams. Pilgrim’s Pride is more concentrated in poultry and pork products, focusing on fresh and processed meats. Diversification in General Mills may mitigate segment-specific risks, while Pilgrim’s Pride’s focus could offer operational efficiencies but higher segment risk.
Which has the best competitive advantage?
Both companies demonstrate very favorable MOAT evaluations with growing ROIC above WACC, indicating durable competitive advantages. Pilgrim’s Pride shows a higher ROIC trend percentage, suggesting a stronger recent improvement in capital efficiency.
Stock Comparison
The past year has seen contrasting price movements for General Mills, Inc. (GIS) and Pilgrim’s Pride Corporation (PPC), with GIS experiencing a marked decline while PPC demonstrated strong upward momentum and buyer dominance in trading activity.
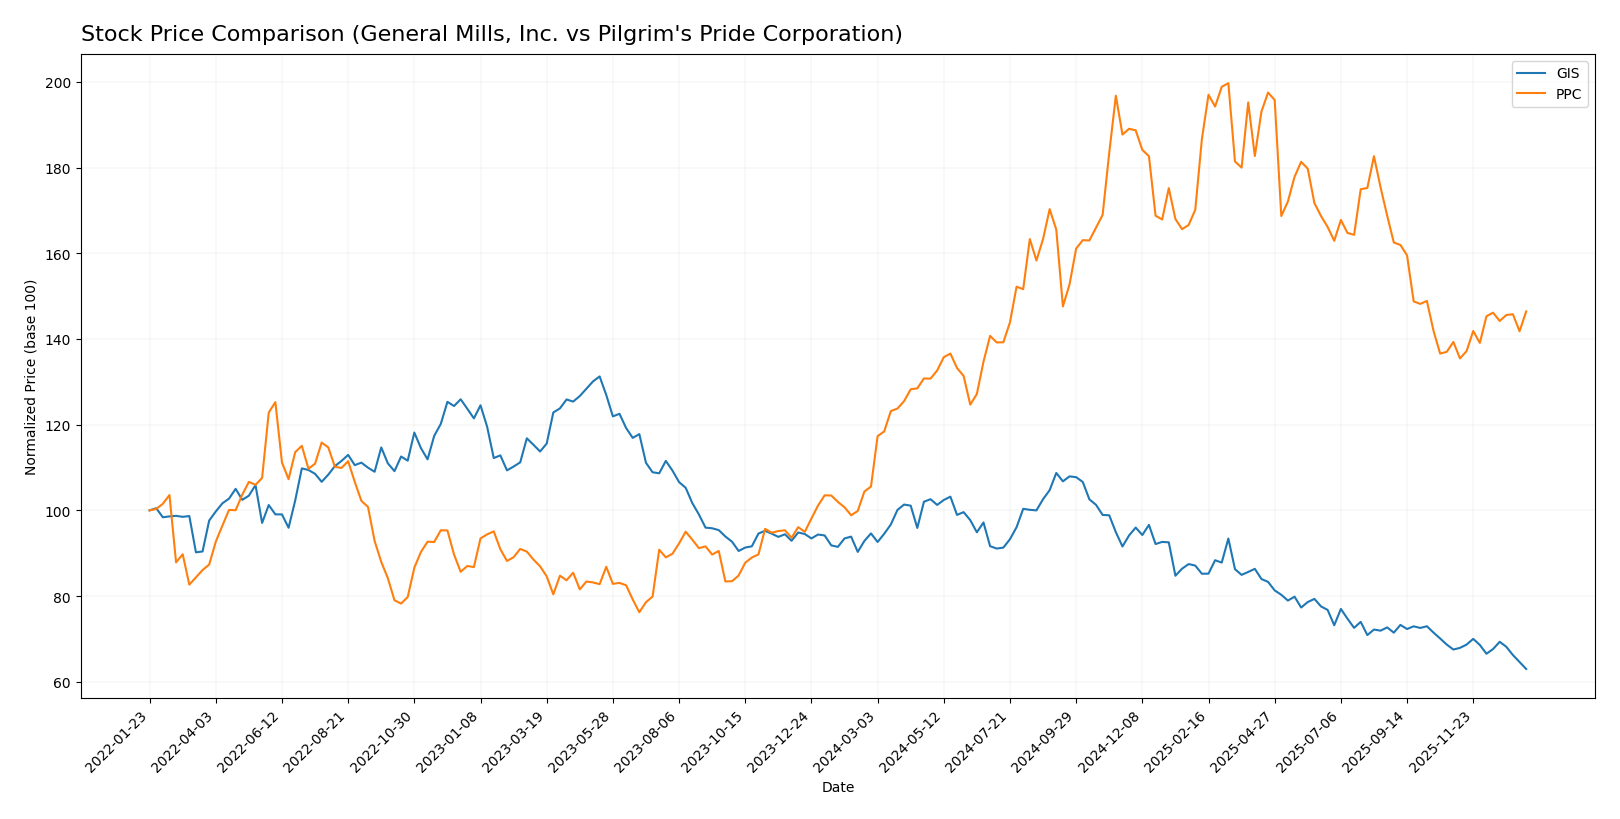
Trend Analysis
General Mills, Inc. stock shows a bearish trend over the past 12 months with a price decrease of 33.44%. The trend is accelerating downward, with a high volatility indicated by an 8.84 standard deviation and recent continued decline of 6.72%.
Pilgrim’s Pride Corporation displays a bullish trend, gaining 38.73% over the same period. This upward trend is accelerating, supported by moderate volatility at 6.11 standard deviation and a recent 5.12% price increase reflecting buyer dominance.
Comparing the two, Pilgrim’s Pride Corporation has delivered the highest market performance, with a strong positive trend contrasting sharply with General Mills’ significant decline.
Target Prices
The latest analyst consensus target prices indicate a positive outlook for both General Mills, Inc. and Pilgrim’s Pride Corporation.
| Company | Target High | Target Low | Consensus |
|---|---|---|---|
| General Mills, Inc. | 63 | 47 | 52.2 |
| Pilgrim’s Pride Corporation | 56 | 45 | 50.5 |
Analysts expect General Mills’ stock to rise from its current price of $43.48 toward a consensus target of $52.2, while Pilgrim’s Pride could increase from $40.05 to about $50.5, reflecting moderate upside potential for both.
Analyst Opinions Comparison
This section compares analysts’ ratings and financial scores for General Mills, Inc. (GIS) and Pilgrim’s Pride Corporation (PPC):
Rating Comparison
GIS Rating
- Rating: A- indicating a very favorable outlook.
- Discounted Cash Flow Score: 5, very favorable, highest possible score.
- ROE Score: 5, very favorable, strong profit generation from equity.
- ROA Score: 4, favorable, effective asset utilization.
- Debt To Equity Score: 1, very unfavorable, high financial risk.
- Overall Score: 4, favorable overall financial standing.
PPC Rating
- Rating: A+ indicating a very favorable outlook.
- Discounted Cash Flow Score: 4, favorable, indicating strong cash flow projections.
- ROE Score: 5, very favorable, equally strong profit generation.
- ROA Score: 5, very favorable, indicating excellent asset utilization.
- Debt To Equity Score: 4, favorable, showing moderate financial risk.
- Overall Score: 4, favorable overall financial standing.
Which one is the best rated?
PPC holds a higher overall rating (A+) compared to GIS’s A-, with stronger scores in ROA and debt-to-equity, indicating better asset use and lower financial risk. Both share the same overall score of 4, reflecting favorable standings.
Scores Comparison
Here is a comparison of the Altman Z-Score and Piotroski Score for General Mills, Inc. (GIS) and Pilgrim’s Pride Corporation (PPC):
GIS Scores
- Altman Z-Score: 2.43, in the grey zone, moderate bankruptcy risk.
- Piotroski Score: 6, average financial strength.
PPC Scores
- Altman Z-Score: 3.75, in the safe zone, low bankruptcy risk.
- Piotroski Score: 5, average financial strength.
Which company has the best scores?
PPC has a stronger Altman Z-Score in the safe zone, indicating lower bankruptcy risk than GIS’s grey zone score. Both companies have similar average Piotroski Scores, with GIS slightly higher.
Grades Comparison
Here is a detailed comparison of the latest grades from recognized grading companies for both companies:
General Mills, Inc. Grades
The following table summarizes recent grades from established financial institutions for General Mills, Inc.:
| Grading Company | Action | New Grade | Date |
|---|---|---|---|
| Wells Fargo | Maintain | Equal Weight | 2026-01-05 |
| Morgan Stanley | Maintain | Underweight | 2025-12-22 |
| Wells Fargo | Maintain | Equal Weight | 2025-12-18 |
| TD Cowen | Maintain | Hold | 2025-12-18 |
| Bernstein | Maintain | Market Perform | 2025-12-18 |
| TD Cowen | Maintain | Hold | 2025-12-15 |
| Wells Fargo | Maintain | Equal Weight | 2025-12-12 |
| Stifel | Maintain | Buy | 2025-12-11 |
| Jefferies | Maintain | Hold | 2025-12-11 |
| Mizuho | Maintain | Neutral | 2025-09-19 |
Overall, General Mills has mostly received neutral to hold ratings, with a few buy recommendations, indicating a cautious but stable outlook.
Pilgrim’s Pride Corporation Grades
The table below presents recent grades from reputable grading firms for Pilgrim’s Pride Corporation:
| Grading Company | Action | New Grade | Date |
|---|---|---|---|
| Barclays | Maintain | Equal Weight | 2025-12-09 |
| Goldman Sachs | Maintain | Neutral | 2025-10-13 |
| BMO Capital | Maintain | Market Perform | 2025-03-17 |
| Barclays | Maintain | Equal Weight | 2024-11-01 |
| BMO Capital | Maintain | Market Perform | 2024-11-01 |
| Barclays | Maintain | Equal Weight | 2024-09-09 |
| Argus Research | Maintain | Buy | 2024-08-28 |
| B of A Securities | Downgrade | Neutral | 2024-08-15 |
| BMO Capital | Downgrade | Market Perform | 2024-08-12 |
| Barclays | Maintain | Equal Weight | 2024-08-02 |
Pilgrim’s Pride shows a consistent consensus around neutral and market perform grades, with occasional buy calls and some recent downgrades, reflecting moderate confidence tempered by caution.
Which company has the best grades?
Both General Mills and Pilgrim’s Pride have predominantly neutral to hold ratings, but General Mills has a slightly higher number of buy ratings. This difference may suggest marginally stronger analyst conviction in General Mills, potentially impacting investor sentiment toward stability and moderate growth prospects.
Strengths and Weaknesses
Below is a comparative overview of General Mills, Inc. (GIS) and Pilgrim’s Pride Corporation (PPC) highlighting key strengths and weaknesses based on recent financial and strategic data.
| Criterion | General Mills, Inc. (GIS) | Pilgrim’s Pride Corporation (PPC) |
|---|---|---|
| Diversification | Highly diversified product portfolio with strong segments in snacks (4.19B), cereal (3.08B), and pet food (2.59B) | Less diversified, mainly focused on poultry products |
| Profitability | Moderate net margin (11.78%), strong ROE (24.95%), slightly favorable overall profitability | Moderate net margin (6.08%), strong ROE (25.63%), favorable overall profitability |
| Innovation | Moderate innovation inferred from stable ROIC growth (2.87%) and diverse segments | Strong innovation indicated by very high ROIC growth (455%) and improving profitability |
| Global presence | Strong global brand recognition and distribution channels | Primarily North American market focus, less global exposure |
| Market Share | Established player with solid market share in packaged foods | Growing market share in poultry, benefiting from operational efficiency |
Key takeaways: General Mills benefits from a broad product portfolio and global reach, providing revenue stability. Pilgrim’s Pride shows exceptional ROIC growth and operational efficiency, signaling strong value creation but with less diversification. Investors should weigh diversification versus rapid profitability growth when choosing between these companies.
Risk Analysis
The table below summarizes key risks for General Mills, Inc. (GIS) and Pilgrim’s Pride Corporation (PPC) based on their latest available data.
| Metric | General Mills, Inc. (GIS) | Pilgrim’s Pride Corporation (PPC) |
|---|---|---|
| Market Risk | Moderate (beta -0.068, defensive sector) | Moderate (beta 0.445, some volatility) |
| Debt level | Elevated (D/E 1.66, debt-to-assets 46.25%) | Moderate (D/E 0.82, debt-to-assets 32.55%) |
| Regulatory Risk | Moderate (food safety and labeling regulations) | Moderate to high (meat processing regulations, export controls) |
| Operational Risk | Moderate (diverse product lines, supply chain complexity) | Elevated (perishable products, supply chain and production scale) |
| Environmental Risk | Moderate (packaged foods impact, sustainability pressure) | Elevated (livestock farming environmental concerns) |
| Geopolitical Risk | Low to moderate (global markets exposure) | Moderate (global exports, trade policies impact) |
General Mills faces its largest risk from elevated debt levels and supply chain complexity, despite a defensive market position. Pilgrim’s Pride’s most impactful risks are operational and environmental, driven by perishable product handling and livestock industry challenges, though it benefits from a safer debt profile and favorable financial scores.
Which Stock to Choose?
General Mills, Inc. (GIS) shows a mixed income evolution with a slight revenue decline last year and an overall unfavorable income statement trend. Its profitability remains solid with a 24.95% ROE but debt levels and liquidity ratios are weak, although its rating stands very favorable at A-.
Pilgrim’s Pride Corporation (PPC) exhibits strong income growth, notably over recent years, with improving margins and profitability. Its financial ratios are largely favorable, including a strong liquidity position and moderate debt, supported by a very favorable A+ rating reflecting financial strength.
Investors seeking growth and improving earnings might find PPC’s favorable income trends and strong ratio profile appealing, while those valuing stable profitability despite some financial constraints could view GIS’s durable competitive advantage and solid ROE as a positive signal. The choice could depend on individual risk tolerance and investment focus.
Disclaimer: Investment carries a risk of loss of initial capital. The past performance is not a reliable indicator of future results. Be sure to understand risks before making an investment decision.
Go Further
I encourage you to read the complete analyses of General Mills, Inc. and Pilgrim’s Pride Corporation to enhance your investment decisions: